
June 9, 2026
The Hidden Architecture Behind Gold's Most Important Price Levels in 2026
Most investors approach gold pricing the wrong way. They scan headlines for forecasts, react to central bank statements, and chase momentum after a breakout has already occurred. What separates disciplined capital allocators from reactive traders is not access to better data — it is the use of pre-defined structural frameworks that remove emotion from the equation entirely. In a market shaped by sovereign debt expansion, currency debasement cycles, and geopolitical realignment, the gold $4,900 and $4,100 buy zones represent exactly that kind of framework: technically grounded, historically anchored, and strategically actionable.
When big ASX news breaks, our subscribers know first
Why Price Zones and Price Targets Are Fundamentally Different Things
Before examining the specific levels at play in mid-2026, it is worth clarifying a distinction that many retail investors overlook. A price target is a forecast — an analyst's projection of where an asset may trade in the future. A price zone, by contrast, is a region of historical market structure where prior highs or lows have created meaningful support or resistance. Buying at a forecast target without waiting for price to enter a pre-defined accumulation zone is not strategic investing — it is speculative positioning dressed in analytical language.
The gold $4,900 and $4,100 buy zones each serve a different function in this framework:
| Price Level | Classification | Strategic Role |
|---|---|---|
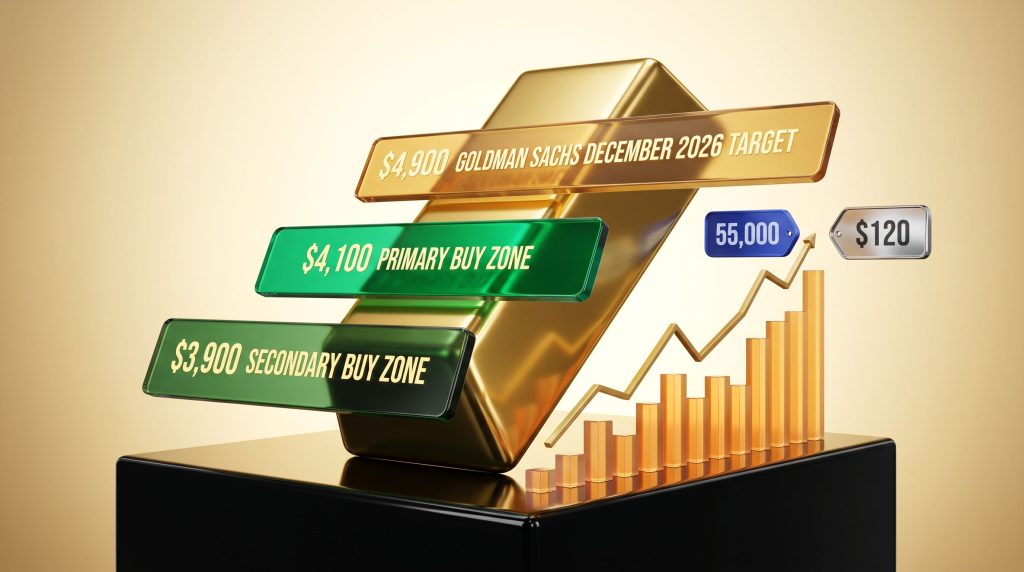
| $4,900 | Resistance / Upside Target | Goldman Sachs December 2026 forecast; prior high resistance zone |
| $4,100 | Primary Buy Zone | Downside accumulation level; convergence of multiple technical frameworks |
| $3,900 | Secondary Buy Zone | Deeper pullback accumulation level if $4,100 fails to hold |
The Goldman Sachs gold forecast published a December 2026 gold price target of $4,900, a figure widely cited in financial media. However, sophisticated technical frameworks treat this level as a potential resistance zone and upside target — not a buy signal. A confirmed breakout above $4,900 supported by elevated volume would be required before that level could reasonably be reclassified as support.
A buy zone is not a prediction. It is a pre-defined price range where historical market structure creates a statistically meaningful convergence of support. Entering positions outside these zones without confirmation is speculative activity — not strategic accumulation.
Fifty Years of Fiat Currency Debasement and What It Means for Gold
Understanding why gold's structural bull market persists requires stepping back from short-term price action and examining the long-duration forces that drive fiat currency erosion. Over more than five decades, every major fiat currency has experienced cycles of temporary strengthening against gold, followed by renewed weakness that ultimately produced fresh all-time lows for the currency and new all-time highs for the metal.
This pattern is not coincidental. It is the mechanical consequence of sovereign fiscal behaviour. Governments across the developed world have systematically expanded debt levels, with the United States now carrying federal debt exceeding $36 trillion as of mid-2026. Historically, periods of elevated debt-to-GDP ratios correlate strongly with gold appreciation as investors seek stores of value outside the monetary system.
Furthermore, gold safe-haven demand remains structurally elevated as the current US dollar rally against gold — modest by historical standards — fits squarely within this cyclical framework. Whether the dollar's relative strength extends for months or collapses abruptly is genuinely unknowable. What the historical record does confirm is that the eventual trajectory resolves in gold's favour.
This is the structural logic underpinning zone-based gold accumulation: use fiat strength as an opportunity to build positions at better prices, not as a signal to abandon precious metals exposure.
Several macro forces are reinforcing this structural case simultaneously:
- Debt ceiling dynamics continue to create recurring fiscal uncertainty in the United States
- Empire transition economics — the gradual shift in global reserve currency dominance — historically accelerates demand for monetary alternatives
- Inflation data distortions (sometimes referred to in technical analysis circles as fakeflation in reference to CPI and PPI readings that may not accurately reflect real-world price pressures) create short-term volatility that zone-based investors can exploit as entry opportunities
- Monetary supply expansion across major economies maintains long-term structural tailwinds for hard assets
The US Stock Market's Role as a Hidden Catalyst
Gold's next significant move may be partially catalysed not by currency dynamics alone, but by what happens in US equity markets. The S&P 500's Shiller CAPE (Cyclically Adjusted Price-to-Earnings) ratio — which adjusts earnings for inflation over a ten-year period — sits at historically extreme levels in mid-2026. This measure of valuation has preceded every major equity bear market in modern history, though the timing of the inflection point remains inherently uncertain.
Technical Scenario Breakdown for the Dow Jones Industrial Average:
- Pattern identified: Inverse Head-and-Shoulders bull continuation formation
- Post-breakout expectation: Classic pullback before momentum resumes
- Projected target zone: 55,000
- Risk window: August 1 through October 31 (historically elevated equity volatility period)
Federal Reserve Chair Kevin Warsh has publicly described the US equity market as significantly overvalued — notably, he expressed this view before valuations reached their current extreme levels, which lends additional weight to his assessment. His policy orientation appears to favour a combination of quantitative tightening (QT) alongside potential rate cuts. This creates a broadly neutral near-term monetary environment for gold.
However, the longer-term implication of sustained balance sheet reduction while fiscal deficits remain elevated is structurally bullish for hard assets including gold. In addition, central bank gold buying has remained a persistent tailwind throughout this cycle, further underpinning the structural case.
The combination of QT and rate cuts creates a nuanced environment: neither aggressively inflationary nor deflationary for gold in the short run. The structural bullish case for gold rests on the medium-to-long term trajectory of debt expansion outpacing monetary normalisation efforts.
Should a major equity bear market materialise during the historically volatile August-October window, capital rotation into gold and precious metals could accelerate dramatically. Investors who have pre-positioned within technical buy zones would benefit from this dynamic without having to make reactive decisions under pressure.
Breaking Down the $4,100 Buy Zone in Detail
Of the two key gold price levels in focus, the $4,100 zone carries the most immediate strategic relevance for investors seeking to build or expand gold positions. This level was constructed from prior market structure — specifically, it sits at an inflection point defined by previous highs and lows that have created meaningful price memory in the market.
Gold buyers may find particular value near these zones, as from mid-2026 price levels, a move to $4,100 would represent approximately an 8-10% pullback — entirely consistent with healthy corrections within a sustained bull market. Historically, corrections of this magnitude within gold bull markets have represented optimal accumulation opportunities rather than signals of trend reversal.
Multiple independent analytical frameworks have converged on $4,100 as a primary downside accumulation level. This convergence matters because it suggests the level is not an artifact of a single methodology but rather a genuine structural feature of the gold market's price architecture.
If $4,100 fails to hold, the secondary accumulation zone at $3,900 provides a deeper entry opportunity. Pre-planning for both scenarios eliminates the psychological paralysis that often afflicts investors when prices move against their initial expectations.
Silver and Gold Miners: Reading the Confirming Signals
The gold framework does not operate in isolation. Silver and gold mining equities provide important confirming or diverging signals that refine the overall picture. Monitoring the gold-silver ratio alongside these zone signals adds a further layer of analytical precision.
Silver's weekly chart is developing an inverse Head-and-Shoulders formation with a price target implied by the pattern near the prior high of approximately $120. This is a significant potential upside scenario, though pattern completion is not guaranteed.
For gold mining equities, the technical picture presents a mixed but developing signal:
| Indicator | GDXJ Status | Signal Interpretation |
|---|---|---|
| Stochastics (14,5,5) | Washed out / oversold | Early value signal present |
| RSI | Not yet in value zone | Confirmation still pending |
| MACD (20,40,10) | Negative | No bullish crossover yet |
GDX, the large-cap gold miner ETF, is currently sitting at support defined by a prior low and an established trendline. Stochastics readings are similarly oversold to GDXJ, though RSI and MACD have not yet confirmed a bullish inflection. The practical implication is clear: miner buy signals should be timed alongside gold zone entries rather than independently, using the gold $4,900 and $4,100 levels as the primary timing anchors.
Gold mining equities amplify gold's directional moves, typically offering enhanced leverage during recoveries from technical buy zones. However, oscillator confirmation — particularly RSI reaching value territory — is the preferred validation tool before deploying capital into miners.
Furthermore, gold miners leverage to gold price movements means that disciplined zone-based entries in the metal itself can significantly enhance the risk-adjusted returns available through mining equity exposure.
The next major ASX story will hit our subscribers first
A Step-by-Step Zone-Based Gold Accumulation Framework
Translating zone identification into disciplined portfolio action requires a systematic approach. The following framework integrates technical zone analysis with practical capital allocation principles:
- Define target zones explicitly — establish $4,100 as the primary accumulation level and $3,900 as the secondary level, written into your investment plan before price reaches these areas
- Assign capital allocation percentages — determine what proportion of total gold exposure deploys at each zone, avoiding the temptation to commit all capital to a single entry
- Eliminate anticipatory buying — entering positions before price reaches the defined zone removes the structural advantage that zone-based accumulation is specifically designed to deliver
- Validate entries with oscillator confirmation — use Stochastics and RSI readings to confirm zone entries; do not use them to override pre-defined zone logic
- Pre-plan your $4,900 response — decide before the fact whether $4,900 represents a partial profit-taking level, a hold level, or a breakout trigger for adding exposure on volume confirmation
- Use inflation data events strategically — CPI and PPI releases create short-term volatility that can push prices temporarily into buy zones; macro-aware investors treat these as entry opportunities rather than directional signals
- Maintain pre-committed discipline through volatility — the primary psychological benefit of zone-based investing is that it eliminates reactive decision-making during sharp price movements
The Four Biggest Risks to This Framework
No analytical framework is without risk. Investors applying the gold $4,900 and $4,100 buy zone approach should be explicitly aware of the following scenarios:
- Risk 1: Deeper equity selloff — a severe equity bear market could trigger broad liquidation pressure that temporarily drags gold below $4,100, activating the secondary $3,900 zone earlier than anticipated
- Risk 2: Sustained dollar strength — a more prolonged fiat currency rally than historical precedent suggests could delay gold's return to the $4,100 accumulation zone, requiring patience from investors
- Risk 3: Fed policy reversal — if Warsh abandons the QT trajectory in favour of aggressive balance sheet expansion, inflationary pressures could rebuild rapidly, potentially pushing gold above $4,900 without a meaningful pullback to the buy zone
- Risk 4: Geopolitical shock — a sudden geopolitical event could trigger a V-shaped gold recovery that bypasses both the $4,100 and $3,900 zones entirely, leaving zone-focused investors without a meaningful entry point
Frequently Asked Questions
Is $4,900 a buy zone or a price target for gold?
$4,900 is primarily a price target and resistance zone, not a traditional accumulation level. It represents a prior high where selling pressure is structurally anticipated. A high-volume confirmed breakout above this level would be required before it could reasonably transition into support.
Why does $4,100 carry the most strategic weight right now?
The level represents a convergence of prior market structure and multiple independent analytical frameworks, and sits at a pullback magnitude — roughly 8-10% from mid-2026 prices — that is historically consistent with bull market corrections rather than trend reversals. Gold's recent record above $4,100 further validates this level as a meaningful structural reference point.
Should investors buy gold before it reaches $4,100?
Zone-based frameworks specifically advise against anticipatory buying. Entering before price reaches the defined accumulation zone introduces timing risk and negates the statistical edge that structural zone analysis is specifically designed to provide.
What happens to gold miners when gold enters the $4,100 zone?
Mining equities tracked through GDXJ typically amplify gold's directional moves. Zone entries in miners should ideally coincide with RSI reaching value territory alongside gold's zone entry, rather than being timed independently.
What is the silver upside target if the pattern completes?
The inverse Head-and-Shoulders formation developing on silver's weekly chart implies a target near the prior high of approximately $120, representing a substantial upside scenario contingent on gold's broader bull market continuation.
How does the Shiller CAPE ratio relate to gold demand?
Historically, extreme CAPE valuations have preceded major equity bear markets. As equity valuations become increasingly stretched, institutional capital tends to diversify toward hard assets. A bear market during the historically volatile August-October window could accelerate this rotation into gold significantly.
The Strategic Takeaway: Preparation Outperforms Prediction
The deepest insight embedded in the gold $4,900 and $4,100 buy zone framework is not about predicting price direction — it is about removing the need to predict. By pre-defining accumulation levels grounded in historical market structure, investors transform an inherently uncertain environment into one where their response to any scenario has already been determined.
The macro backdrop — characterised by expanding sovereign debt, structurally elevated equity valuations, potential empire-level reserve currency transition, and a Federal Reserve navigating the tension between tightening and accommodation — collectively reinforces the long-duration case for gold ownership. What zone-based analysis adds to this macro thesis is tactical precision: not just why to own gold, but when and at what price to add to positions in a disciplined, repeatable way.
Whether gold moves first to $4,900 or corrects toward $4,100 in the months ahead, investors who have pre-planned their response to both scenarios are positioned to act with conviction rather than react with uncertainty. In markets shaped by debt, inflation, and geopolitical realignment, that preparation is the actual edge.
Disclaimer: This article is for informational and educational purposes only and does not constitute financial or investment advice. All forecasts, technical analysis, and price projections referenced involve inherent uncertainty. Past performance of technical patterns and historical price relationships does not guarantee future results. Readers should consult qualified investment professionals before making any investment decisions. Investing in gold, precious metals, and mining equities carries risk, including the potential loss of capital.
Want to Identify the Next Major Mineral Discovery Before the Broader Market?
While gold's structural frameworks offer strategic precision for precious metals investors, Discovery Alert's proprietary Discovery IQ model delivers real-time alerts on significant ASX mineral discoveries — instantly translating complex mineral data into actionable opportunities for both short-term traders and long-term investors. Explore how historic discoveries have generated substantial returns on Discovery Alert's dedicated discoveries page, and begin your 14-day free trial today to position yourself ahead of the market.