May 23, 2026
The Hidden Language of Gold: What Every Investor Misses When They Check the Price
Most financial assets speak a single dialect. Equities reflect corporate earnings power. Bonds encode interest rate expectations. Commodities like oil and copper track industrial cycles. Gold, however, operates across all of these registers simultaneously, functioning as a kind of monetary Rosetta Stone. It encodes information about currency credibility, sovereign debt sustainability, institutional trust, and geopolitical risk all at once. Understanding what the gold price per ounce really tells you requires shifting from price-watching to signal-reading, and the difference between those two activities is substantial.
The investors who profit most from gold over long periods are rarely the ones who time entries perfectly. They are the ones who understand what the number is actually measuring, and why the forces driving it have been compounding for decades without reversal.
When big ASX news breaks, our subscribers know first
How the Gold Spot Price Is Actually Constructed
Before interpreting what the number means, it helps to understand precisely how it is built. The gold spot price represents the benchmark value for the immediate delivery of one troy ounce of pure gold. It is not a single exchange price but rather the output of a continuous, globally interconnected price discovery process operating across three primary venues.
| Exchange | Location | Primary Function |
|---|---|---|
| LBMA (London Bullion Market Association) | London, UK | Twice-daily AM/PM auction fix; institutional settlement benchmark |
| COMEX (CME Group) | New York, USA | Futures-driven continuous price discovery; ~200,000+ contracts daily |
| Shanghai Gold Exchange | Shanghai, China | Physical demand-weighted pricing; processes 600-800 tonnes monthly |
The LBMA and COMEX gold markets publish benchmarks that govern institutional settlement for central banks, sovereign wealth funds, mining royalty agreements, and large commercial contracts. The LBMA publishes its official gold price twice daily, with the AM auction closing at approximately 10:30 AM GMT and the PM auction at approximately 3:00 PM GMT. Critically, the LBMA fix has existed in some form since 1919, making it the most historically entrenched pricing benchmark in global commodities markets.
COMEX futures, by contrast, generate the continuous real-time price most retail investors see on their screens. Daily volumes regularly exceed 200,000 contracts, each representing 100 troy ounces, meaning COMEX alone processes the equivalent of roughly 620 tonnes of notional gold exposure every trading day. The Shanghai Gold Exchange adds a third dimension: physical, yuan-denominated demand that has grown so significant that Asian trading hours now contribute approximately 35-40% of 24-hour price discovery.
These three venues form a continuous loop: London opens, sets the institutional tone, Asia builds momentum through physical demand, and New York arbitrages any divergence when COMEX opens. The result is seamless 24-hour pricing in which local imbalances are corrected within minutes.
The Troy Ounce Distinction That Changes Every Calculation
A detail most retail investors overlook: the unit itself. One troy ounce equals precisely 31.1035 grams, while a standard avoirdupois ounce equals 28.35 grams. The difference is approximately 9.7%, and it is not trivial. Every spot price, every futures contract, every LBMA settlement, and every physical bar weight in the global gold market is denominated in troy ounces — a system inherited from the 12th-century Champagne Fairs in Troyes, France. Misunderstanding this unit distorts every calculation an investor performs on physical holdings, premium analysis, or per-gram conversions.
The Bid-Ask Spread: A Cost of Access, Not a Pricing Error
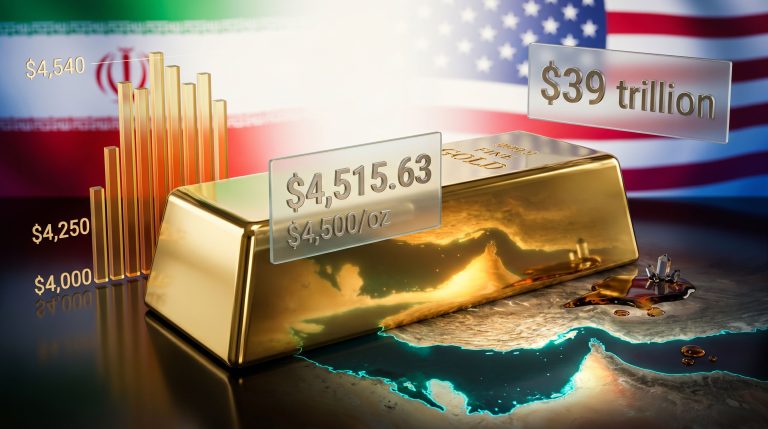
When a dealer quotes a spot price of $4,600 per troy ounce, buyers typically pay slightly above that figure (the ask) while sellers receive slightly below it (the bid). In institutional LBMA contexts, these spreads narrow to as little as 0.05-0.15% of the spot price. In retail dealer markets, spreads expand to 1-3% or more depending on product type, order size, market volatility, and dealer inventory. Understanding this distinction prevents investors from misinterpreting normal market mechanics as pricing errors or dealer manipulation. For a broader overview of what drives gold prices, the interplay between these mechanics and macroeconomic forces is well worth exploring.
What the Gold Price Is Actually Measuring Beneath the Surface
Treating gold as a supply-and-demand commodity like copper or wheat fundamentally misrepresents its function in the global financial system. The gold price per ounce is simultaneously a statement about:
- USD purchasing power: Gold is denominated in U.S. dollars, meaning every price quote is an implicit assessment of dollar value. When the dollar depreciates, the USD-denominated gold price rises arithmetically, even if gold's intrinsic properties are unchanged.
- Real interest rate levels: When inflation-adjusted bond yields fall toward zero or turn negative, the opportunity cost of holding non-yielding gold collapses, making it directly competitive with sovereign debt instruments.
- Sovereign debt credibility: Sustained gold price appreciation historically correlates with periods of escalating government debt relative to GDP in major reserve-currency-issuing nations.
- Geopolitical risk premium: Periods of escalating international tension embed a measurable additional premium into gold prices, independent of monetary conditions.
- Institutional reserve confidence: Central bank accumulation patterns, made across multi-decade horizons, signal how sovereign institutions assess the durability of the existing reserve currency architecture.
"A rising gold price does not necessarily mean gold is becoming more valuable in absolute terms. It may simply mean the unit used to measure it is becoming progressively less valuable." This distinction is among the most important in monetary economics, and most retail investors never make it.
Furthermore, understanding the gold safe-haven role helps clarify why institutional and sovereign investors consistently return to the metal during periods of systemic uncertainty.
The Long-Run Purchasing Power Argument
In 1971, President Nixon severed the U.S. dollar's convertibility to gold, ending the Bretton Woods system at a fixed rate of $35 per troy ounce. As of early May 2026, gold trades near $4,600 per ounce — a nominal increase of approximately 13,043%. Expressed differently, a dollar in 1971 purchased 1/35th of a troy ounce; a dollar in May 2026 purchases roughly 1/4,600th of an ounce, a gold-equivalent purchasing power loss of approximately 99.2% [Federal Reserve Bank of St. Louis, FRED].
Gold carries no earnings, dividends, or yield. Its multi-decade price appreciation is therefore not a function of asset improvement but rather a direct reflection of the progressive debasement of the currencies used to measure it. This is not a controversial claim — it is a mathematical consequence of fiat currency systems that expand money supply faster than economic output.
The Real Interest Rate Connection Most Investors Miss
The single most reliable short-to-medium-term driver of gold price direction is the level of real interest rates, calculated as nominal bond yields minus inflation expectations. When 10-year Treasury yields sit at 4.5% and breakeven inflation stands at 2.5%, real rates equal 2.0%, creating meaningful competition for non-yielding assets. When yields compress to 3.8% while inflation expectations rise to 4.2%, real rates turn negative, and the logic for holding gold becomes arithmetically compelling.
This relationship explains gold's 20% correction in 2022 (when the Federal Reserve aggressively raised nominal rates) and equally explains the recovery from late 2024 onward as real rates compressed back toward the 0-0.25% range. Consequently, tracking the 10-year Treasury Inflation-Protected Securities (TIPS) yield provides a reliable leading indicator for gold price momentum that operates independently of sentiment or narrative. The gold and bond dynamics at play across economic cycles reinforce this relationship further.
The 2025-2026 Gold Price Surge: Structural, Not Speculative
The scale of gold's recent advance demands structural explanation rather than narrative storytelling. Consider the trajectory:
| Metric | Data Point | Source |
|---|---|---|
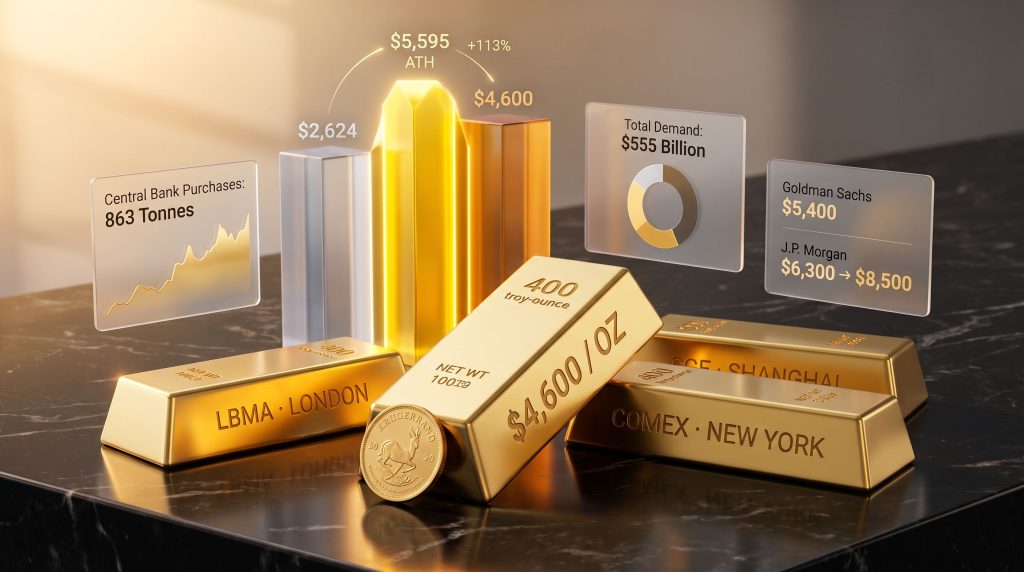
| Gold price, January 2025 | ~$2,624/oz | Trading Economics |
| All-time high (January 28-29, 2026) | ~$5,589-$5,595/oz | Trading Economics |
| Price as of early May 2026 | ~$4,600/oz | Trading Economics |
| Gain from January 2025 to ATH | ~+113% | Calculated |
| Pullback from ATH to May 2026 | ~17-18% | Calculated |
| New all-time highs set during 2025 | 53 | World Gold Council |
A 113% advance followed by a 17-18% correction is not anomalous gold behaviour. During the 2001-2011 bull market, gold advanced from approximately $250 per troy ounce to $1,895, a gain exceeding 650% trough to peak [CNBC]. Along the way, it suffered corrections of 15-34% on multiple occasions, including a 34% drawdown in 2008 during the global financial crisis, before resuming its upward trajectory. The current correction falls well within the historical range of healthy bull market consolidation.
Four Structural Drivers Behind the Breakout
1. Real Interest Rate Compression
Inflation-adjusted yields on government bonds declined through 2024 and into 2025, reducing the yield advantage of sovereign debt over gold. As real rates moved toward zero, gold's lack of yield became irrelevant from an opportunity-cost perspective. This was not a sentiment-driven shift but a mathematical recalibration of relative asset attractiveness.
2. Multi-Currency Dollar Weakness
Dollar depreciation through 2025 provided a persistent mechanical tailwind for USD-denominated gold. However, the more important signal is that gold simultaneously reached all-time highs in euros, Japanese yen, British sterling, and Canadian dollars. When an asset achieves simultaneous records across multiple major currency denominations, the signal is not asset-specific appreciation but rather broad-based fiat currency debasement operating across the entire reserve currency system.
3. Sovereign Reserve Reallocation at Historic Scale
Central bank gold demand reached 863 tonnes in 2025 — nearly double the 2010-2021 annual average of approximately 473 tonnes [World Gold Council, Gold Demand Trends: Full Year 2025]. These decisions are not short-term trades. They are multi-decade strategic reserve positions made by sovereign institutions specifically choosing an asset with zero counterparty risk. Gold cannot be sanctioned, defaulted on, or devalued by a third-party government — properties that have become increasingly valued in an era of escalating geopolitical fragmentation.
4. Geopolitical Risk Premium Expansion
Capital consistently gravitates toward assets that exist outside the conventional financial system during periods of institutional fragility. Gold's unique position — carrying no counterparty exposure and functioning independently of banking infrastructure — became structurally more attractive as geopolitical tensions across multiple theatres intensified through late 2025 and into 2026. Historically, geopolitical shock events embed measurable risk premiums into gold prices independent of underlying monetary conditions.
The Demand Numbers That Confirm a Structural Shift
| Demand Metric | 2025 Data | Significance |
|---|---|---|
| Total global gold demand | Over 5,000 tonnes (first time in recorded history) | Structural, not cyclical |
| Total market value of demand | $555 billion | +45% above prior year |
| Gold ETF assets under management | $559 billion (doubled year-on-year) | Institutional re-entry underway |
| Physical ETF gold holdings | 4,025 tonnes (record) | Tangible asset accumulation at scale |
| Central bank purchases | 863 tonnes | 82% above long-run average |
Source: World Gold Council, Gold Demand Trends: Full Year 2025
Global gold demand exceeding 5,000 tonnes for the first time in recorded history, generating $555 billion in market value at 45% above the prior year, is not the fingerprint of speculative momentum. It is a structural shift in capital allocation occurring simultaneously across institutional, sovereign, and retail channels.
What Major Institutions Are Forecasting for 2026
| Institution | 2026 Year-End Target | Upside Scenario | Date Issued |
|---|---|---|---|
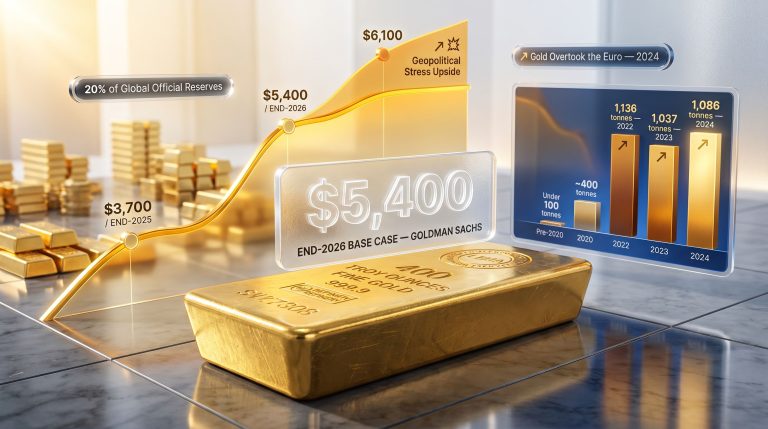
| Goldman Sachs | $5,400/oz | Not specified | January 2026 |
| J.P. Morgan | $6,300/oz | $8,000-$8,500/oz | February 2026 |
Sources: Reuters; TheStreet
Two important interpretive points about these forecasts deserve attention. First, Goldman Sachs maintained its $5,400 target through the March 2026 sell-off rather than revising downward — a signal of analytical conviction rather than reactive positioning. Second, J.P. Morgan's upside scenario of $8,000-$8,500 is explicitly conditional on a meaningful increase in private investor allocations, a demand category that remains structurally underweight relative to institutional positioning.
The gap between the base case and the upside scenario reflects genuine uncertainty about private investor re-entry velocity rather than disagreement about the structural bull case itself.
Analytical Caution: Institutional price targets are risk-adjusted scenario frameworks used to calibrate client exposure, not investment guarantees. The fact that both institutions issued targets above the then-current price during a correction period signals they view the structural bull thesis as intact, but past performance and institutional forecasts do not guarantee future results. Investors should seek qualified financial advice before making any investment decisions.
Five Frameworks for Reading the Gold Price Like a Professional
Framework 1: Multi-Currency Cross-Analysis
Rather than tracking gold exclusively in USD, monitor its performance across AUD, EUR, JPY, GBP, and CNY simultaneously. If gold is rising strongly in USD but flat or declining in other currencies, the signal is dollar-specific weakness rather than broad monetary deterioration. If it is rising in all currency denominations simultaneously, the signal shifts to systemic fiat debasement — a fundamentally different and more structurally significant message.
Framework 2: TIPS Yield Correlation Monitoring
Plot gold price against the 10-year U.S. Treasury Inflation-Protected Securities (TIPS) yield on a rolling 12-month basis. When real yields decline toward zero or turn negative, gold historically enters periods of sustained upward pressure. Use real rate direction as a leading indicator for gold price momentum rather than lagging price signals.
Framework 3: Central Bank Accumulation Tracking
The World Gold Council publishes quarterly central bank demand data. Treat sustained sovereign purchases above 600 tonnes annually as a structural support signal. Unlike retail or institutional fund managers, central banks do not trade on quarterly sentiment. Their accumulation patterns signal long-duration reserve diversification with multi-decade timeframes, providing one of the most durable underlying demand signals available.
Framework 4: Historical Correction Depth Assessment
Gold bull markets regularly produce corrections of 15-35% without terminating the broader trend. Before interpreting a price pullback as a trend reversal, compare its depth and duration against historical precedents. The current approximately 17-18% correction from the January 2026 peak is consistent with prior bull market consolidation patterns. Context transforms what appears alarming in isolation into what is normal within a longer-duration cycle.
Framework 5: Spot-to-Physical Premium Spread Analysis
When dealer premiums above spot widen significantly, it signals excess physical demand relative to paper market pricing. Elevated premiums on coins and bars are a leading indicator of demand surges that futures markets have not yet fully absorbed. Monitoring dealer premiums provides a real-time demand gauge that operates independently of — and sometimes ahead of — the spot price itself. This approach to understanding gold pricing is well-established among experienced market participants.
The next major ASX story will hit our subscribers first
Understanding the Premium Gap: Spot Price Versus Real Purchase Cost
The spot price is the starting point, not the final price. Every physical gold purchase involves a premium above spot that reflects manufacturing costs, distribution logistics, dealer margins, insurance, and assay verification. Understanding the premium structure by product type is essential for calculating the true cost of ownership.
| Gold Product | Typical Premium Above Spot | Liquidity Profile |
|---|---|---|
| Large gold bars (400 oz) | 0.1-0.5% | Institutional; lower retail accessibility |
| 1 oz gold bars | 1-3% | High retail liquidity |
| 1 oz gold coins (e.g., Krugerrand, Eagle) | 3-6% | Very high; globally recognised |
| Fractional gold coins (1/4 oz, 1/10 oz) | 8-15%+ | High liquidity; higher cost per gram |
| Numismatic or collectible coins | 20%+ (variable) | Specialist market; lower fungibility |
A critically underappreciated risk in physical gold ownership is premium asymmetry. An investor purchasing gold at elevated premiums during periods of high demand and selling during periods of compressed premiums may experience a loss in real dollar terms even if the spot price has risen. Premium management is a distinct discipline from price timing, and most retail investors never account for it in their return calculations.
It is also worth distinguishing clearly between gold ETFs and physically held gold. An ETF provides price exposure through a financial instrument that remains within the banking system, subject to counterparty risk, fund structure risk, and potential redemption constraints during systemic stress events. Physical gold held directly or in allocated vault storage carries no counterparty risk. In a conventional environment this distinction may seem theoretical; in a genuine financial stress event, it becomes practical and material. Indeed, understanding gold in the monetary system clarifies precisely why this distinction carries such long-term significance.
What Would Reverse the Structural Case for Gold
Intellectual honesty requires identifying the conditions that would undermine the structural bull thesis rather than presenting a one-directional narrative. The conditions that would most meaningfully change the structural picture include:
- A durable return of positive real interest rates at meaningful levels (sustained TIPS yields well above 2%) across major economies simultaneously
- A structural and sustained strengthening of the U.S. dollar against all major currency pairs over a multi-year horizon
- A material reduction in sovereign debt trajectories across the United States, Japan, and the European Union
- A significant and sustained decline in geopolitical fragmentation, reducing the demand for assets outside the conventional financial system
- A structural reversal in central bank reserve diversification away from USD-denominated assets
As of early May 2026, none of these conditions are in evidence as a sustained trend. That observation is not a prediction of future performance but rather a description of the current macro environment as it stands.
Reading the Macro Signal Embedded in Today's Gold Price
| Signal | Current Reading | Implication |
|---|---|---|
| Gold in USD | ~$4,600/oz (May 2026) | 75% above January 2025 starting price |
| Gold in EUR, JPY, GBP | All-time highs reached | Broad fiat debasement signal confirmed |
| Central bank demand (2025) | 863 tonnes | Structural reserve diversification underway |
| Gold ETF assets under management | $559 billion (doubled year-on-year) | Institutional re-entry phase active |
| Correction depth from ATH | ~17-18% | Within historical bull market norms |
| Goldman Sachs 2026 target | $5,400/oz | Maintained through sell-off; conviction signal |
| J.P. Morgan 2026 target | $6,300/oz (upside: $8,000-$8,500) | Conditional on private investor flow acceleration |
From Price-Watching to Signal-Reading
What the gold price per ounce really tells you is far more than a daily market number — it is a compressed signal about the health of the global monetary architecture. Checking the daily price provides almost no analytical value on its own. What provides genuine analytical value is understanding the multi-year directional trend, the cross-currency pattern, the institutional demand structure, the real interest rate environment, and the sovereign reserve allocation behaviour that collectively drive it.
At approximately $4,600 per troy ounce as of early May 2026, gold sits roughly 75% above where it began 2025, has reached record levels simultaneously across six major currency denominations, is being accumulated by central banks at nearly double their decade-long average pace, and has attracted institutional ETF inflows that doubled assets under management in a single year. The number is speaking clearly. The question, as always with gold, is whether the person watching it possesses the analytical framework to understand what it is actually saying.
Learning to answer that question is one of the most durable skills a long-term investor can develop — not because gold will always rise, but because understanding what drives its price illuminates the structure of the monetary system itself.
Disclaimer: This article is intended for informational and educational purposes only. It does not constitute financial or investment advice. All data and figures cited reflect publicly available information as of early May 2026. Past performance of any asset, including gold, is not a guarantee of future results. Institutional price forecasts referenced are scenario frameworks, not guarantees. Investors should consult a qualified financial adviser before making any investment decisions.
Want to Act on the Next Major ASX Mineral Discovery Before the Market Does?
Discovery Alert's proprietary Discovery IQ model scans ASX announcements in real time, instantly translating complex mineral data into actionable investment insights across more than 30 commodities — giving subscribers a decisive edge the moment a significant discovery is made. Explore historic discoveries and their extraordinary returns, then begin your 14-day free trial at Discovery Alert to position yourself ahead of the broader market.