May 23, 2026

When a Single Strait Controls the World's Energy Destiny
Few structural vulnerabilities in global energy infrastructure are as exposed as a narrow corridor of water stretching barely 33 kilometres at its narrowest point. The Strait of Hormuz has long been the silent pressure valve of the global oil market, largely taken for granted during periods of geopolitical calm. But when that valve closes, the reverberations reach every refinery, every strategic reserve depot, and every futures trading desk on the planet.
Understanding current crude oil prices means starting here, with geography, before moving to diplomacy or inventory data. Oil rebounds on Iran peace deal uncertainty and inventory drawdowns have become the defining market narrative, and the Strait of Hormuz sits at the centre of that story.
The oil market's behaviour in the week of May 21, 2026 perfectly illustrates what happens when physical supply disruption collides with speculative diplomacy. The result is not a clean price trend in either direction. It is violent oscillation, driven not by production data or demand forecasts, but by the perceived probability of a political agreement that may or may not materialise.
When big ASX news breaks, our subscribers know first
Brent and WTI: Parsing the Numbers Behind the Rebound
On the morning of May 21, 2026, Brent and WTI futures moved sharply higher. Brent crude climbed $1.27, or 1.21 percent, reaching $106.29 per barrel by 09:18 a.m. Saudi time, whilst West Texas Intermediate rose $1.29, or 1.31 percent, to $99.55 per barrel. Consequently, these gains arrived immediately after both benchmarks had fallen more than 5.6 percent in a single session on Wednesday — their sharpest intraday decline in over a week.
That Wednesday sell-off was triggered by signals from President Donald Trump that US-Iran peace negotiations were approaching a conclusion, prompting traders to rapidly unwind geopolitical risk premiums. The Thursday rebound, however, tells a different story. It signals that a meaningful portion of the market viewed that optimism as premature and reasserted the physical supply fundamentals that remain deeply strained.
The sequence of a 5.6% collapse followed by a 1.3% recovery within 24 hours is not a market correcting — it is a market repricing uncertainty itself, oscillating between two incompatible narratives simultaneously.
The US-Iran Conflict: A Diplomatic Timeline with No Clear Endpoint
The conflict that reshaped global energy markets began on February 28, 2026, when US and Israeli military action initiated hostilities with Iran. An April ceasefire halted the majority of active fighting, but the downstream consequences for energy markets have not followed the same trajectory. Peace talks are widely described as being in their closing stages, yet experienced energy analysts caution against interpreting that framing as certainty.
ING analysts noted in a research note published on May 21 that the market has cycled through near-identical situations on multiple prior occasions, each time arriving at disappointment rather than resolution. Their base case Brent forecast for the current quarter stands at an average of $104 per barrel, reflecting sustained uncertainty rather than resolution. That forecast prices in the diplomatic noise without betting on a diplomatic outcome.
Furthermore, several factors explain why the scepticism is well-founded:
- Iran's hardline military leadership continues to play an active role in the negotiating process, with senior figures holding significant leverage over any final agreement
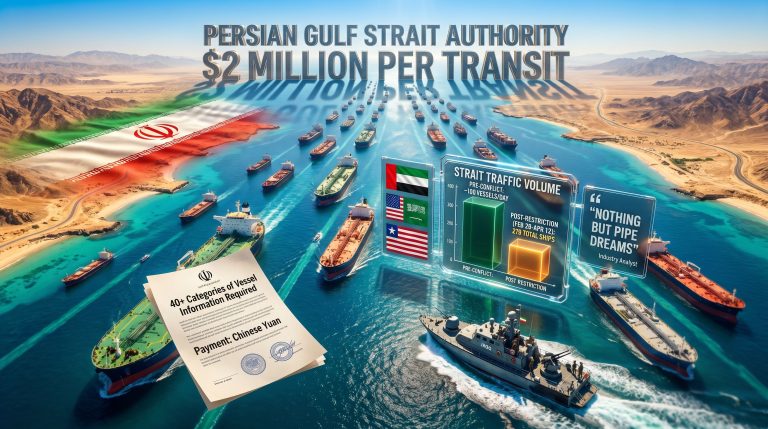
- Rather than signalling de-escalation, Iran announced the establishment of a new Persian Gulf Strait Authority on Wednesday, May 20, institutionalising its control over Hormuz access through what it described as a controlled maritime zone
- The US naval blockade of Iran's coastline remains in place, creating a dual-sided chokepoint with no precedent in modern energy market history
- The ceasefire has paused fighting but has not addressed the foundational political conditions that triggered the conflict
The Strait of Hormuz: Anatomy of a Chokepoint
How Much Oil Actually Transits Hormuz?
Before the February 28 conflict, the Strait of Hormuz served as the transit corridor for approximately one-fifth of all global oil and liquefied natural gas consumption. No other single geographic feature carries a comparable share of the world's energy supply. Its effective closure since the conflict began represents a structural supply removal, not a temporary disruption.
In addition, the disruption to global LNG supply through this corridor has compounded the broader energy market crisis, extending the impact well beyond crude oil markets. The mechanics of that closure have created cascading effects across global trade flows:
| Supply Chain Factor | Pre-Conflict Status | Current Status |
|---|---|---|
| Hormuz oil and LNG transit share | ~20% of global consumption | Largely blocked |
| Iranian maritime control | Internationally recognised free passage | Controlled maritime zone declared |
| US naval posture | Standard regional presence | Active blockade of Iranian coastline |
| Alternative routing via Cape of Good Hope | Marginal use | Significantly increased utilisation |
| Asian importer procurement | Middle East-dependent | Sourcing from alternative regions at premium cost |
The Rerouting Cost
The rerouting of tankers around the Cape of Good Hope adds roughly 15,000 to 20,000 kilometres to a journey that would otherwise transit Hormuz, adding weeks of transit time and substantially increasing freight costs. For Asian importers whose refining infrastructure is optimised for Middle Eastern crude grades, this creates a quality mismatch problem that cannot simply be resolved by redirecting trade flows.
Heavy, sour Arabian crude has specific refinery processing characteristics that West African or North Sea crude does not replicate, meaning even available alternative volumes face technical barriers to substitution.
Record SPR Drawdowns and the Vanishing Inventory Buffer
What Do the Latest EIA Figures Reveal?
The US Energy Information Administration released data on Wednesday, May 20 confirming that the United States withdrew nearly 10 million barrels from its Strategic Petroleum Reserve in a single week — the largest single-week drawdown on record. This figure was compounded by a larger-than-expected concurrent decline in commercial US crude inventories during the same reporting period.
The Strategic Petroleum Reserve was architected as an emergency buffer for short-duration supply disruptions. A near-record weekly withdrawal occurring within a sustained conflict scenario raises serious questions about how long this mechanism can continue to compensate for structural supply losses.
Energy researcher Mingyu Gao, chief researcher for energy and chemicals at China Futures, noted that the scale of inventory depletion makes it structurally difficult for oil prices to remain at suppressed levels. Gao further outlined a specific timeline: with Hormuz access remaining restricted, global refined-product and onshore crude inventories are projected to fall below their lowest seasonal levels of the past five years by late May for refined products and by late June for crude. (China Futures, May 2026)
This projection carries significant implications. Seasonal inventory norms represent the market's built-in buffer against unexpected demand spikes or additional supply shocks. Once inventories fall below that band, the market loses its shock-absorbing capacity and price volatility amplifies in response to events that would otherwise be manageable.
Projected Inventory Trajectory Through Mid-2026
| Period | Inventory Position | Market Implication |
|---|---|---|
| May 21, 2026 | Below seasonal average | Moderate structural price support |
| Late May 2026 | Projected below 5-year low (refined products) | Elevated price floor, increased volatility sensitivity |
| Late June 2026 | Projected below 5-year low (crude) | Significant risk premium amplification |
| Q3 2026 onwards | SPR capacity constrained if conflict persists | Emergency buffer effectiveness diminished |
Three Scenarios That Could Define Oil's Next Directional Move
The current market sits at an unusually binary junction. Diplomatic progress and physical scarcity are pulling in opposite directions, and the resolution of that tension will determine the medium-term oil price trajectory. Three distinct scenarios frame the range of outcomes:
Scenario 1: Diplomatic Resolution
A formal US-Iran peace agreement is reached, and Hormuz access begins to normalise. The geopolitical risk premium embedded in current prices would compress sharply, potentially pushing Brent back toward the $85 to $90 range. However, the physical restoration of supply through the strait would take weeks to months, meaning the inventory deficit would continue to provide a price floor even in this bearish scenario.
Scenario 2: Prolonged Stalemate (Base Case)
Talks remain active but inconclusive. Hormuz access stays restricted under the Persian Gulf Strait Authority framework. Inventory drawdowns continue accelerating, and Brent holds within a $100 to $110 range with headline-driven volatility remaining structurally elevated. This is the scenario ING's $104 average Brent forecast is calibrated to reflect.
Scenario 3: Escalation or Breakdown
Peace talks collapse, Iran tightens Hormuz restrictions further, or the US naval posture intensifies. Under this scenario, the SPR's remaining buffer capacity comes under critical scrutiny, and Brent could test the $115 to $120 range. The secondary economic impact of sustained energy costs at this level carries meaningful global recession risk, particularly for import-dependent Asian economies.
The next major ASX story will hit our subscribers first
What the Hormuz Disruption Has Revealed About Energy Market Architecture
Beyond the immediate price dynamics, the current situation has exposed structural fragilities in global energy supply design. The crude oil price trends emerging from this conflict have, furthermore, revealed vulnerabilities that longer-term analytical frameworks cannot afford to ignore.
Refinery Grade Dependency
Asian refineries, which collectively represent the world's largest crude import complex, have been optimised over decades to process Middle Eastern crude grades. The sulphur content, viscosity, and distillate yield profiles of Arabian crude are unique. When that supply is removed, the available alternatives require either expensive refinery reconfiguration or acceptance of lower refinery throughput efficiency.
The SPR Duration Problem
The Strategic Petroleum Reserve was never intended to function as a sustained supply source for an extended conflict scenario. At a withdrawal pace approaching 10 million barrels per week, even a reserve measured in hundreds of millions of barrels faces a finite operational horizon. If the conflict extends through Q3 2026 without resolution, the SPR's marginal utility as a price management tool will be materially reduced.
Alternative Supplier Capacity Limits
US shale producers, West African exporters, and North Sea operators are all functioning near practical capacity constraints. The concept of a swift supply surge from non-Middle Eastern producers to replace Hormuz volumes is not realistic in the near term. Shale well productivity cycles, infrastructure limitations, and capital allocation timelines mean that production increases take quarters, not weeks, to materialise at scale.
However, OPEC's market influence over non-conflict member production decisions adds another layer of complexity, as coordinated output responses from the broader alliance remain constrained by internal political dynamics.
Key Indicators for Market Participants to Monitor
For those tracking this situation, the following data points and events carry the highest near-term signal value:
- Weekly EIA inventory reports: Both commercial stocks and SPR withdrawal rates are the primary quantitative signal for physical supply tightness
- US-Iran diplomatic communiqués: Any formal statements from negotiating parties carry immediate price-moving potential given current headline sensitivity
- Persian Gulf Strait Authority announcements: Changes to Iran's declared maritime zone conditions would have direct Hormuz traffic implications
- ING and institutional bank Brent forecasts: Consensus price anchors that reflect professional aggregation of geopolitical and fundamental risk
- Asian refiner procurement behaviour: Spot market premiums for non-Middle Eastern crude grades reflect the real cost of Hormuz disruption to end users
- SPR drawdown rate trajectory: An acceleration in weekly withdrawals would signal intensifying supply stress before it fully registers in commercial inventory data
Reuters reporting via TradingView confirms that oil rebounds on Iran peace deal uncertainty and inventory drawdowns remain the dominant market theme as negotiations continue without a definitive conclusion. Indeed, the interplay between diplomatic signals and inventory data is likely to define price behaviour well into the second half of 2026.
Disclaimer: This article contains forward-looking projections, analyst forecasts, and scenario analyses related to crude oil markets. These represent analytical perspectives and not financial advice. Oil market conditions are subject to rapid change based on geopolitical developments. Investors should conduct independent research and seek qualified financial guidance before making investment decisions.
Want To Position Ahead of the Next Major Commodity Discovery?
While geopolitical shocks like the Hormuz crisis dominate energy headlines, the biggest wealth-creation opportunities in commodities often emerge from significant mineral discoveries — and Discovery Alert's proprietary Discovery IQ model delivers real-time ASX alerts the moment those discoveries are announced, turning complex data across 30+ commodities into actionable insights for both traders and long-term investors. Explore historic discovery returns on Discovery Alert's dedicated discoveries page and begin your 14-day free trial today to ensure you're positioned before the broader market moves.