May 24, 2026
The Hidden Danger in Precious Metals Market Narratives
Investor psychology has a well-documented tendency to anchor on the most dramatic price event within a recent window, treating a spectacular peak as a proxy for ongoing strength. In 2026, this cognitive pattern is distorting how millions of market participants perceive the performance of gold and silver. When a market opens a new year with a historic surge and then spends the following months pulling back, the year-to-date return figure remains technically positive, yet the actual price trajectory is one of sustained retreat. Understanding this distinction is central to forming accurate precious metals prices perspectives for the months ahead.
When big ASX news breaks, our subscribers know first
What the Year-to-Date Numbers Are Actually Telling You
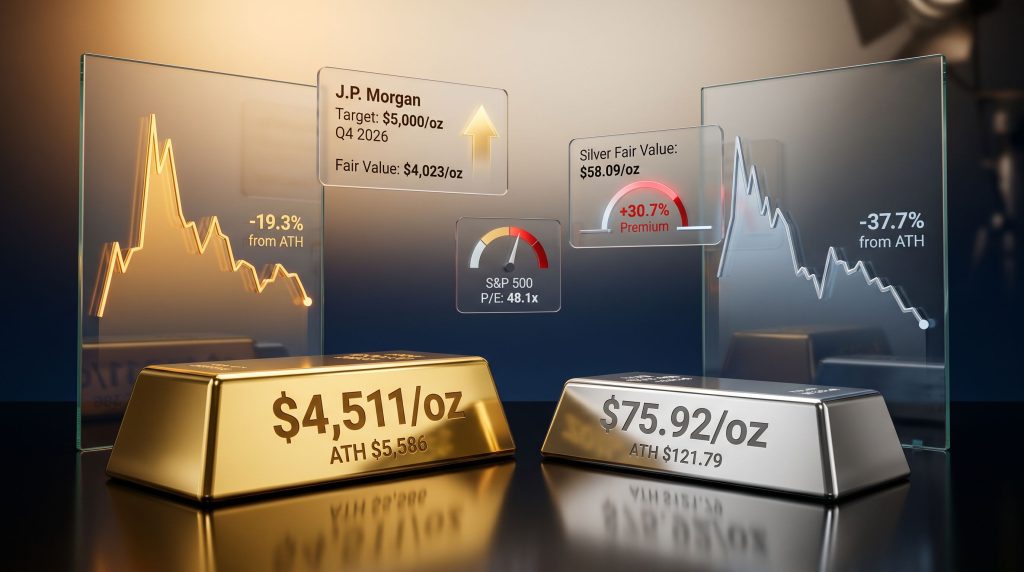
The surface-level story for 2026 reads as follows: gold is up +4.1% year-to-date, settling near $4,511/oz, while silver has posted a +7.0% gain to trade near $75.92/oz. On a standalone basis, both figures appear respectable. However, neither number captures where these metals actually came from, or where their price trajectories are pointing.
Gold achieved its current price level just four trading days into 2026 on January 7, before surging to an all-time intra-day high of $5,586/oz on January 29. Silver reached the equivalent of its current price as early as January 5, then spiked to an extraordinary $121.79/oz on the same January 29 date. Both metals have since experienced deep and sustained corrections:
- Gold is currently -19.3% below its all-time high
- Silver is -37.7% below its record peak
- Linear regression applied to daily closing prices for both metals shows a negative trend slope across the 98 trading days completed so far in 2026
This is a technically unflattering picture that is almost entirely obscured by the dramatic early-year spike. The year-to-date gains exist on paper, but the directionality of the price trend since late January tells a very different story. For broader precious metals prices perspectives, the gold-silver ratio insights also provide a useful supplementary lens when assessing relative performance between the two metals.
When AI-driven financial tools describe gold and silver as having a standout year, they are anchoring on the calendar-year starting price relative to the early peak, not on trend direction or drawdown depth. This framing error can lead investors to hold or accumulate positions under false assumptions about market momentum.
Historical Ranking Provides Important Context
Placing 2026's performance in a multi-decade frame reveals just how ordinary, and in gold's case below-average, this year has been by historical standards.
Across all years since 2000, gold's 98-trading-day return for 2026 ranks only 16th-best out of 26 comparable periods. Silver performs somewhat better at 9th-best, reflecting the white metal's marginally stronger intra-year momentum despite its deeper drawdown from peak.
| Metric | Gold | Silver |
|---|---|---|
| YTD Settlement Price | $4,511/oz | $75.92/oz |
| All-Time High (Jan 29, 2026) | $5,586/oz | $121.79/oz |
| Drawdown from ATH | -19.3% | -37.7% |
| YTD Return | +4.1% | +7.0% |
| Historical YTD Rank (98 days) | 16th-best | 9th-best |
| Net Up Days vs. Down Days | +5 | +13 |
Gold has recorded just five more up days than down days across 98 sessions, a marginally positive skew that falls well short of a genuinely bullish distribution. Silver has outperformed directionally, logging 13 more up days than down days, which helps explain its somewhat better historical ranking even as its absolute drawdown from peak is far steeper. You can track live precious metal prices to monitor these movements in real time.
Valuation Models: Where Gold and Silver Should Theoretically Be Trading
The BEGOS Market Value Framework Explained
One of the more sophisticated yet underappreciated tools for assessing precious metals pricing is the BEGOS Market Value framework, developed by independent market analyst Mark Mead Baillie of de Meadville International. The model derives near-term implied values from the correlated price movements of five primary markets: Bonds, Euro, Gold, Oil, and the S&P 500. By tracking how each of these instruments moves relative to the others, the framework generates a market-implied value that accounts for broader macro correlations rather than relying on gold or silver price data in isolation.
Under this framework:
- Gold's current BEGOS Market Value sits at $4,766/oz, meaning spot gold at $4,511/oz is trading approximately -5.4% below its near-term implied fair value
- A broader intrinsic Fair Value calculation places gold at $4,023/oz, meaning spot prices carry a +12.1% premium to this longer-term anchor
- Silver's Fair Value is estimated at $58.09/oz, against which a spot price of $75.92/oz represents a substantial +30.7% premium
Why Silver's Valuation Premium Demands Attention
Silver's premium to Fair Value is not a trivial figure. A deviation of +30.7% above a longer-term intrinsic price estimate carries meaningful mean reversion implications. It is important to note that mean reversion is not a timing mechanism; it does not predict when prices will fall, only that structural gravitational forces exist.
Fair Value itself tends to appreciate over time, meaning the gap between spot price and intrinsic value can close through price consolidation, Fair Value appreciation, or a combination of both. Crucially, silver's valuation premium does not preclude new record highs. However, investors who are not accounting for this structural overhang may be underweighting a significant risk factor in their position sizing.
A note on rate cycle dynamics: During the Federal Reserve's 2004-2006 tightening cycle, gold broadly appreciated even as borrowing costs rose. This historical precedent is relevant today, given that bond markets have fully priced in a rate hike before year-end 2026. Rising rates do not automatically suppress precious metals, particularly when inflation remains persistently above target.
Reading the Technical Tape: Charts That Tell an Uncomfortable Story
Gold's Weekly Structure: Parabolic Short and a 600-Point Gap
Gold's weekly bar chart is currently displaying a parabolic Short trend that has been active for ten consecutive weeks. The rightmost short signal has converged with the dashed linear regression trendline, a technical intersection worth monitoring, though it does not independently signal a directional reversal.
More significant is the distance between current prices and the regression trendline. At over 600 points below the trendline on a weekly closing basis, this represents the largest negative deviation recorded across the past 12 months of weekly data. Historically, deviations of this magnitude have been associated with technically oversold conditions that precede a bounce, even within an active downtrend framework. Furthermore, understanding gold in volatile markets helps contextualise why these technical extremes tend to form rapidly.
Daily Chart Dynamics: The Big Gap Formation
On the daily timeframe, Gold's 10-day Market Profile reveals what technicians refer to as a "Big Gap" — a discontinuity in the price-volume distribution. In Gold's case, this gap spans 139 points, meaningfully wider than the metal's expected daily trading range of 103 points. The volume-dominant resistance level within the profile sits at $4,548/oz.
The regression consistency indicators (commonly referred to as baby blue dots within the BEGOS framework) are drifting without directional conviction, confirming that price action remains technically unresolved within the broader corrective structure.
Silver's Technical Mirror: Greater Amplitude, Similar Direction
Silver's three-month price structure broadly mirrors gold's directional behaviour, with the characteristic amplification that defines the white metal's trading personality. A comparable Big Gap has formed in Silver's Market Profile, with the volume-dominant resistance level at $76.75/oz.
One figure that underscores how dramatically silver's volatility has expanded: Silver's expected daily trading range is now 4.42 points, which exceeds the entire annual trading range for 2018 of 3.85 points. This compression of multi-year volatility into a single expected daily move illustrates the speculative intensity that has entered the silver market.
What Major Institutions Are Projecting for Precious Metals
J.P. Morgan's Structural Bull Case
J.P. Morgan has maintained a constructive long-term outlook for gold throughout 2026, targeting $5,000/oz by Q4 2026 with a base case of $5,055/oz in Q4 and $5,400/oz by end-2027. Their thesis rests on three structural demand pillars:
- Continued central bank gold demand across emerging and developed markets
- Approximately 250 tonnes of ETF inflows projected for 2026
- Sustained bar-and-coin demand from global retail investors
The longer-term path toward $6,000/oz that J.P. Morgan references is contingent on these demand forces being sustained and on the macro environment remaining broadly supportive of real asset positioning.
BlackRock's Volatility-Aware Constructive Stance
BlackRock's analysis acknowledges the violent price action that defined early 2026, including some of the largest single-day declines in decades following the January highs. The firm attributes the correction primarily to a strengthening U.S. dollar and the unwinding of crowded speculative positions in leveraged futures markets.
Despite this, BlackRock's structural investment case for gold remains intact, supported by:
- Falling real interest rates as a medium-term macro tailwind
- Persistent central bank demand serving as a price floor
- Emerging demand vectors including correlations with cryptocurrency markets and capital rotation from AI-sector equity positions into hard assets
A particularly striking datapoint underpinning the institutional consensus: approximately 95% of surveyed central banks expect global gold reserves to increase in 2026, according to the World Gold Council's annual survey. This reinforces the structural foundations that support the broader precious metals prices perspectives held by institutional analysts.
The Macro Backdrop: Equity Overvaluation and Fed Policy Tensions
The S&P 500 Overhang: Valuations at Historic Extremes
The S&P 500's current configuration presents a unique backdrop for precious metals positioning. The index settled near 7,473 in late May 2026 while sitting technically overbought across 32 consecutive trading days. Its trailing twelve-month price-to-earnings ratio stands at approximately 48.1x, a level that historically correlates with elevated correction risk.
This creates a genuine tension in the precious metals market. On one hand, an equity correction of sufficient scale could trigger risk-off flows into gold, potentially catalysing a sharp recovery. On the other hand, the same correction could initially suppress all risk assets simultaneously, including silver, which carries a meaningful industrial and speculative component.
Counterintuitively, Q1 2026 earnings delivered robustly: 80% of the 446 reporting S&P 500 constituents beat year-over-year earnings comparisons, representing the strongest performance since Q3 2018 (85%), excluding the 2021 COVID recovery period. This divergence between valuation extremes and earnings quality is being sustained by persistent investor preference for equities over fixed income, even as Treasury yields exceed triple the dividend yield of the S&P 500.
| Macro Indicator | Latest Reading | Signal |
|---|---|---|
| S&P 500 P/E Ratio | 48.1x | Overbought / Correction Risk |
| Q1 2026 Earnings Beat Rate | 80% | Fundamentally Strong |
| Conference Board LEI (April) | +0.1% | Barely Positive (5th time in 48 months) |
| Philadelphia Fed Index | -0.4 (May) vs. +26.7 (April) | Sharp Deterioration |
| Fed Rate Hike Probability | Fully Priced In | Tightening Bias |
| PCE Inflation vs. 2% Target | Above Target | Persistent Inflationary Pressure |
Federal Reserve Inflation Dynamics and the Rate Hike Scenario
Bond market pricing has shifted meaningfully, with traders now fully pricing in a Federal Reserve rate hike before year-end 2026. The April Personal Consumption Expenditures report, the Fed's preferred inflation gauge, is expected to show both headline and core readings that continue to annualise well above the 2% policy target.
The Conference Board's Leading Economic Indicators recorded a positive reading in April for only the fifth time in 48 months (+0.1%). However, this fragile improvement may face reversal pressure given that the Philadelphia Fed Index swung from +26.7 in April to -0.4 in May, a dramatic deterioration in regional manufacturing sentiment.
The precedent of the 2004-2006 rate-rise cycle remains instructive here. During that period, gold broadly appreciated even as the Fed systematically tightened monetary policy, demonstrating that the relationship between rate hikes and gold prices is far more nuanced than a simple inverse correlation. Consequently, gold's safe-haven role tends to reassert itself when inflation persists above target while real rates remain historically contained.
The next major ASX story will hit our subscribers first
Bull and Bear Cases: A Balanced Framework for Mid-2026
The Bull Case
- Central bank demand remains structurally elevated, with 95% of surveyed institutions expecting global reserves to grow
- J.P. Morgan's $5,000-$6,000/oz long-term target reflects genuine institutional conviction in the multi-year bull thesis
- ETF inflows of approximately 250 tonnes are projected for 2026, deepening the demand base
- Gold's 600-point negative deviation from its weekly regression trendline suggests a technically oversold bounce may be developing
- Historical precedent from the 2004-2006 tightening cycle demonstrates gold can appreciate alongside rising rates when inflation remains elevated
The Bear Case and Key Risk Factors
- Both metals remain well below January 2026 all-time highs, with active parabolic short signals on weekly technical charts
- Silver's +30.7% premium to Fair Value creates substantial mean reversion risk over a medium-term horizon
- A strengthening U.S. dollar or accelerated policy tightening could extend the unwinding of leveraged long positions
- Gold's year-to-date performance ranks only 16th-best historically, suggesting this cycle lacks the momentum of prior bull runs at an equivalent stage
- Equity market resilience, despite extreme valuations, continues to divert institutional and retail capital away from safe-haven allocations
In addition, the current gold price forecast from multiple analytical frameworks suggests the path forward is likely to remain uneven, requiring investors to weigh both structural tailwinds and near-term technical headwinds carefully.
Frequently Asked Questions: Precious Metals Prices Perspectives
Is gold still in a bull market in 2026?
Gold's structural case remains intact over a multi-year horizon, supported by central bank demand, ETF inflows, and inflation persistence. However, the near-term technical picture, including a ten-week parabolic short signal and a price sitting more than 600 points below its weekly regression trendline, indicates the metal is in a corrective phase within a broader uptrend. Investors should distinguish between structural positioning and tactical entry timing.
Why is silver more volatile than gold?
Silver's dual role as both a monetary metal and an industrial commodity makes it uniquely sensitive to shifts in risk appetite, speculative positioning, and margin call dynamics. Its expected daily trading range of 4.42 points in 2026 now exceeds silver's entire annual range from 2018, illustrating how dramatically the speculative component has expanded. This amplification cuts both ways: silver tends to outperform gold in bull phases and underperform sharply in corrections.
What does silver's Fair Value premium mean for investors?
A +30.7% premium to intrinsic Fair Value does not trigger an automatic sell signal, but it does establish a structural gravitational force that works against sustained price gains over time. For risk-managed positioning, this premium is a meaningful factor in determining position size and defining realistic upside scenarios relative to downside risk.
How does the BEGOS framework differ from conventional price analysis?
Rather than analysing gold or silver in isolation, the BEGOS framework tracks correlated movements across Bonds, Euro, Gold, Oil, and the S&P 500 simultaneously. This multi-market correlation model generates an implied near-term value for each component based on how the others are behaving, providing a more dynamically adjusted benchmark than static technical indicators or fundamental valuation metrics alone.
Key Takeaways for Navigating Precious Metals in H2 2026
-
The headline YTD return figures are misleading. Both gold and silver achieved their current price levels within the first five trading days of 2026. The subsequent period has been characterised by a negative trend slope and significant drawdowns from peak.
-
Valuation premiums are real and require active monitoring. Gold's +12.1% premium to Fair Value and silver's +30.7% premium represent structural headwinds, not immediate sell signals, but they matter for risk-adjusted position management.
-
Technical conditions suggest an oversold bounce may be forming. Gold's 600-point deviation below its weekly regression trendline is the largest recorded over the past 12 months.
-
Institutional conviction remains structurally intact. J.P. Morgan's $5,000-$5,400/oz targets and BlackRock's constructive macro thesis reflect a long-duration rather than a short-term tactical view.
-
The macro backdrop is increasingly complex. A fully priced-in Fed rate hike, above-target PCE inflation, a Conference Board LEI that has turned positive only five times in four years, and an S&P 500 trading at 48.1x earnings collectively create a volatile and unpredictable environment for precious metals through the remainder of 2026.
Disclaimer: This article is for informational and educational purposes only and does not constitute financial advice. Precious metals markets involve significant risk, and past performance is not indicative of future results. Readers should conduct their own due diligence or consult a licensed financial adviser before making any investment decisions. Price forecasts cited from institutional sources reflect their stated views as of the time of publication and are subject to change.
Want to Position Ahead of the Next Major ASX Mineral Discovery?
Discovery Alert's proprietary Discovery IQ model delivers real-time alerts on significant ASX mineral discoveries, cutting through complex data to surface actionable opportunities the moment they are announced — explore historic discoveries and their exceptional returns to understand what early positioning can mean, then begin your 14-day free trial at Discovery Alert to gain a market-leading edge.