June 9, 2026
Why Oil Markets Move Long Before the Headlines Tell You To
Commodity markets have a well-documented tendency to reprice before the broader public understands why. In energy markets specifically, the gap between physical reality and market perception creates windows of extraordinary volatility, and occasionally, extraordinary opportunity. The Strait of Hormuz sits at the centre of this dynamic in 2026, functioning less as a geopolitical flashpoint and more as a structural stress test for the entire global energy architecture.
Understanding the mechanics of an oil supply shock in the Strait of Hormuz requires moving beyond headline risk and into the physical plumbing of global oil supply. Tankers, insurance markets, refinery scheduling, and cargo sequencing do not respond to press releases. They respond to restored capacity, verified infrastructure, and rebuilt commercial confidence — all of which operate on timelines measured in months, not days.
What follows is a structured analysis of how this disruption works, why its scale is historically significant, and what the compounding downstream effects mean for prices, economies, and regional energy security. Furthermore, understanding the broader oil market dynamics at play provides essential context for interpreting the signals emerging from this disruption.
When big ASX news breaks, our subscribers know first
The World's Most Critical Oil Chokepoint: A Structural Overview
Why the Strait of Hormuz Is Irreplaceable in Global Energy Architecture
The Strait of Hormuz is not merely one of several important trade routes. It is the single most concentrated point of vulnerability in the global oil supply system. At its narrowest, the usable shipping channel spans roughly three kilometres in each direction, threading between Iran to the north and Oman and the UAE to the south. There is no viable deep-water alternative that can replicate its throughput capacity at comparable cost and speed.
Several pipeline alternatives exist, including the Abu Dhabi Crude Oil Pipeline and the East-West Pipeline through Saudi Arabia, but their combined capacity falls well short of replacing Hormuz-level volumes. These routes also carry their own logistical and political constraints and cannot be scaled rapidly to compensate for a major disruption.
How Much Oil Actually Flows Through the Strait?
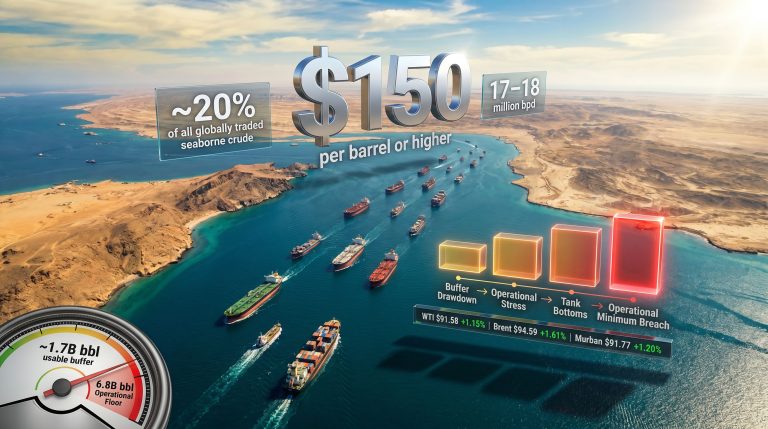
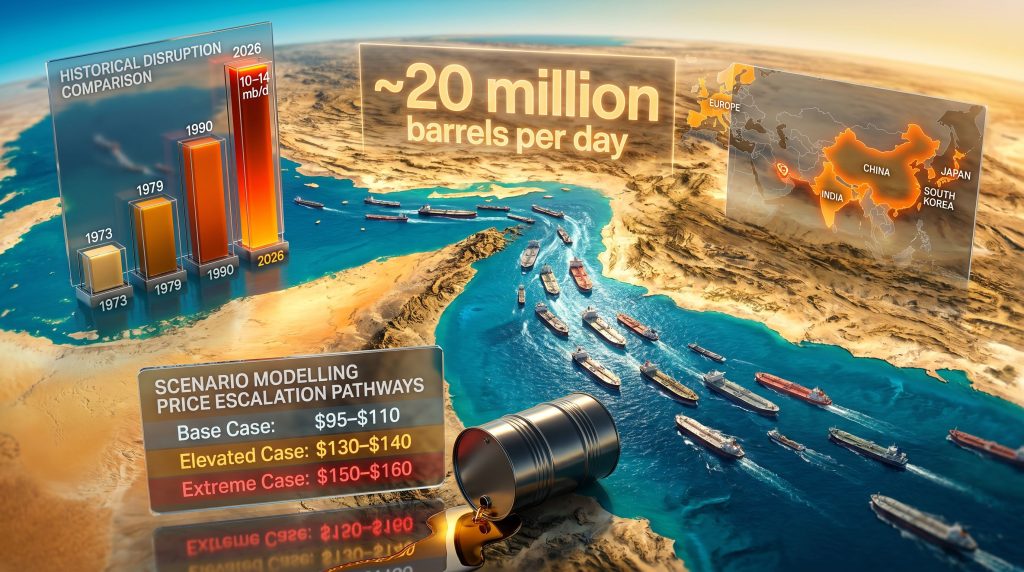
Approximately 20 million barrels of oil and petroleum products transit the Strait of Hormuz every day, representing roughly one-fifth of total global oil consumption. According to the U.S. Energy Information Administration, the Strait is the world's most important oil chokepoint by a significant margin, with volumes that dwarf any other maritime energy corridor including the Suez Canal and the Strait of Malacca.
The composition of these flows matters as much as the volume. Gulf producers including Saudi Arabia, Iraq, the UAE, Kuwait, and Iran collectively account for the bulk of Hormuz traffic, with the majority of these exports directed toward Asian markets. Japan, South Korea, China, and India are structurally dependent on this corridor in ways that create acute vulnerability when transit is disrupted.
The Geographic Concentration Problem
| Metric | Estimated Figure |
|---|---|
| Daily oil flow through the Strait (2025) | ~20 million barrels per day |
| Share of global oil consumption transiting the Strait | ~20% |
| Current supply reportedly shut in or constrained | 10–14 million barrels per day |
| Global oil demand baseline | ~103 million barrels per day |
| Estimated supply impairment as % of global demand | ~13% |
Note: Current disruption figures are estimates based on available market reporting and are subject to revision as conditions evolve.
What makes the Hormuz concentration problem structurally dangerous is that no amount of demand-side adjustment or strategic reserve release can substitute for the physical restoration of supply flows through the channel. Global spare capacity — the additional production that OPEC+ members could theoretically bring online — has eroded significantly over the past several years, leaving the market with limited cushion against a sustained disruption of this scale. In addition, OPEC's market influence on available spare capacity has become increasingly constrained, further limiting the system's ability to absorb a shock of this magnitude.
How Does a Strait of Hormuz Supply Shock Actually Unfold?
Phase 1: The Immediate Price Spike
The initial market response to a Hormuz disruption is driven primarily by sentiment and precautionary buying rather than actual physical shortages. Traders price in the risk of reduced future supply by bidding up available cargoes. This creates a front-loaded price spike that can be disproportionate to the actual volume of oil immediately removed from the market.
Benchmark crude prices typically jump sharply in the first days of a confirmed disruption, as risk premiums are layered onto already-elevated structural prices. The speed and scale of this initial repricing depends heavily on how tight inventories already are at the time of the disruption. When storage buffers are thin, the psychological premium compounds the physical reality, amplifying the price move beyond what fundamentals alone would justify.
Phase 2: The Inventory Draw
As the disruption persists, the market transitions from a sentiment-driven shock to a physically-driven shortage. Commercial inventories, along with strategic petroleum reserves where governments choose to intervene, begin absorbing the supply gap. This is the phase where inventory data becomes the critical variable that markets watch most closely.
Data from the U.S. Energy Information Administration indicates that US commercial crude stocks recently fell to approximately 441.7 million barrels, sitting around 2% below the five-year seasonal average. A single-week decline of 8.3 million barrels in total commercial petroleum inventories reflects the pace at which physical buffers are being consumed under current conditions. At the same time, US refinery crude utilisation is running near 94.5%, close to operational capacity limits, with crude imports elevated near 17 million barrels per day as refiners compete for available supply.
Phase 3: The Slow Recovery
Counter-intuitively, the most underappreciated phase of a Hormuz supply shock is the recovery period following any formal resolution. Markets and media tend to treat a political agreement or ceasefire as the end of the disruption. Physically, it is only the beginning of a multi-month normalisation process.
Even after a formal resolution, restoring steady export volumes through the Strait can take approximately two months or longer, as tanker logistics, shipping insurance markets, port infrastructure, and refinery supply chains must all be sequentially reset rather than simultaneously switched back on.
This structural lag is the central insight that separates informed market participants from those reacting to headlines. According to Oxford Energy's analysis of the anatomy of the Strait of Hormuz oil shock, the recovery timeline consistently exceeds what political announcements suggest, precisely because the physical and commercial systems operate independently of diplomatic ones.
Why the 2026 Hormuz Disruption Is Historically Unprecedented
Comparing Current Disruption Severity to Past Oil Shocks
To contextualise the scale of what is unfolding in 2026, it is instructive to compare the current disruption against the major supply shocks of the past half-century. Each previous episode is well-documented by the IEA and EIA in retrospective analyses that provide reliable benchmarks for comparison.
| Disruption Event | Duration | Estimated Supply Loss | Price Impact |
|---|---|---|---|
| 1973 Arab Oil Embargo | ~6 months | ~4–5 mb/d | +300% |
| 1979 Iranian Revolution | ~12 months | ~5–6 mb/d | +150% |
| 1990 Gulf War | ~6 months | ~4 mb/d | +100% |
| 2026 Hormuz Constraint (current) | 100+ days | 10–14 mb/d | Ongoing |
Note: 2026 figures are current estimates and subject to revision. Historical figures sourced from EIA and IEA retrospective analyses.
What distinguishes the current episode is not merely the scale of constrained supply but the combination of factors that surround it. Previous shocks occurred against backdrops of higher spare capacity, more resilient inventory levels, and less structurally complex refining systems. The 2026 disruption arrived at a moment when global spare capacity was already compressed, strategic reserves in key consuming nations had been partially drawn down in prior cycles, and refinery utilisation rates were already running near peak.
The 100-Day Mark: What Prolonged Constraint Means for Market Structure
Historical oil supply disruptions have tended to resolve relatively quickly, either through diplomatic intervention, alternative supply activation, or producer behaviour changes. A disruption that extends beyond 100 days enters territory where structural market damage begins to compound. Producers reconfigure supply chains, consumers accelerate diversification strategies, and the logistical networks built around Hormuz transit begin to atrophy.
Reaching the 100-day threshold also means that seasonal demand dynamics begin to overlap with the disruption in ways that amplify tightness. A disruption that coincides with the northern hemisphere's peak summer consumption period places simultaneous pressure on both supply availability and demand intensity, creating conditions where inventory draws accelerate faster than during other seasons.
Why This Disruption Is Described as the Most Severe in Oil Market History
The combination of volume constrained, duration, and the depleted state of global buffers entering the disruption makes the current situation quantitatively distinct from any previous episode. With 10 to 14 million barrels per day potentially impaired against a global demand baseline of approximately 103 million barrels per day, the implied supply deficit represents a structural gap roughly two to three times larger than any previous recorded disruption in absolute volume terms. The trade war oil impact has further complicated the supply picture by reshaping trade flows and accelerating the fragmentation of previously reliable supply arrangements.
What Are the Macro-Economic Consequences of a Prolonged Hormuz Closure?
Inflation Transmission: How Energy Prices Ripple Through the Broader Economy
Energy costs are embedded in virtually every link of the global production and distribution chain. When crude oil prices rise sharply and remain elevated, the transmission mechanism into broader consumer prices operates across multiple channels simultaneously. Transport costs rise, lifting prices across virtually all goods categories. Petrochemical inputs become more expensive, raising manufacturing costs for plastics, fertilisers, and synthetic materials. Heating and cooling costs rise for households and commercial buildings, and jet fuel costs climb, raising airline ticket prices and freight charges.
This multi-channel transmission means that even a temporary oil price spike does not simply affect petrol station prices. It enters the inflation data across dozens of sub-categories, creating a diffuse but persistent upward pressure on consumer price indices that persists long after the initial energy shock subsides.
Stagflation Risk: When Supply Shocks Collide With Tightening Monetary Policy
A sustained oil supply shock does not merely raise fuel prices. It simultaneously slows economic output while pushing consumer prices higher, creating the dual-pressure environment known as stagflation. Central banks face an acute policy dilemma: raising rates to contain inflation risks deepening the economic slowdown already triggered by the energy shock itself.
The stagflation scenario is particularly challenging for policymakers because the standard monetary policy toolkit is designed to address demand-side inflation, not supply-side cost-push inflation. Raising interest rates reduces consumer spending and corporate investment, helping to cool demand-driven price increases. However, when inflation is driven by a physical shortage of a critical commodity, rate hikes cannot increase the supply of oil. They can only reduce the economic activity that generates oil demand, effectively shrinking the economy as the primary inflation-fighting mechanism.
Corporate Margin Compression and Central Bank Dilemma
The corporate sector faces simultaneous pressure from multiple directions during a sustained energy shock. Transport and logistics costs rise directly. Input costs across energy-intensive manufacturing sectors climb. And if central banks respond with rate increases, financing costs also rise, compressing margins further. This triple-squeeze creates conditions where corporate earnings revisions tend to run persistently negative, reinforcing broader equity market weakness.
For central banks specifically, the dilemma is acute. Raising rates to contain inflation risks deepening the economic slowdown already in progress. Keeping rates accommodative risks allowing inflation expectations to become unanchored, potentially requiring even more aggressive tightening later. Neither path is without significant economic cost, which is precisely why sustained energy supply disruptions have historically coincided with prolonged periods of market uncertainty.
Which Regions Are Most Exposed to a Hormuz Supply Disruption?
Regional exposure to an oil supply shock in the Strait of Hormuz is highly uneven, shaped by the degree to which each region depends directly on Gulf crude imports versus accessing oil from alternative sources.
| Region | Primary Exposure Channel | Vulnerability Level |
|---|---|---|
| East Asia (China, Japan, South Korea, India) | Direct crude imports from Gulf | Very High |
| Europe | Refined product prices, LNG competition | Moderate–High |
| United States | Gasoline, diesel, jet fuel prices | Moderate |
| Emerging Markets (Southeast Asia, Africa) | Import costs, currency depreciation | High |
Asia's Structural Vulnerability
East Asian economies occupy the most exposed position in the global energy system relative to Hormuz disruptions. Japan imports the vast majority of its crude from the Middle East, with Gulf producers accounting for roughly 90% of Japanese crude imports according to data from Japan's Ministry of Economy, Trade and Industry. South Korea faces a similarly concentrated import profile. China, while more diversified, still draws a substantial share of its crude from Gulf suppliers, and any large-scale return to aggressive Chinese import buying could act as a significant demand multiplier in an already-tight physical market.
United States and Europe: Indirect Exposure
While the United States has significantly increased domestic oil production through the shale revolution, reducing its direct dependence on Middle Eastern crude, exposure to global price effects remains substantial. US consumers pay global market prices for refined petroleum products regardless of where the underlying crude originates. Europe faces indirect exposure primarily through refined product markets, LNG competition with Asia, and the broader macroeconomic effects of an oil-price-driven inflation spike. Furthermore, revised OPEC demand forecasts have already begun to reflect the structural demand deterioration that sustained high prices tend to produce across both regions.
Emerging Markets: Currency and Subsidy Pressure
For emerging market economies that are net oil importers, a Hormuz-driven price spike creates a compounding set of challenges. Higher oil prices inflate import bills denominated in US dollars, placing downward pressure on local currencies. Weaker currencies then make the already-expensive oil even more costly in local currency terms, amplifying the inflationary effect. For governments that maintain fuel subsidies, the fiscal cost of those subsidies escalates sharply, constraining government budgets and potentially forcing politically difficult subsidy reductions.
The next major ASX story will hit our subscribers first
How Are Physical Oil Markets Responding Right Now?
US Commercial Crude Inventory Drawdowns
Physical market indicators provide the most reliable real-time signal of whether a supply shock is genuine or primarily sentiment-driven. The current data presents a consistent picture of tightening physical conditions across multiple metrics.
| Indicator | Current Reading | Significance |
|---|---|---|
| US commercial crude stocks | ~441.7 million barrels | ~2% below 5-year average |
| Weekly petroleum inventory decline | -8.3 million barrels | Accelerating drawdown |
| US refinery crude utilisation | ~94.5% | Near operational ceiling |
| Crude imports (US) | ~17 million barrels per day | Elevated amid tightening supply |
Source: U.S. Energy Information Administration. Figures represent recent readings and are subject to weekly revision.
The combination of declining inventories and near-peak refinery utilisation creates a particularly difficult supply-demand balance. Refiners running at 94.5% utilisation have very limited capacity to increase throughput even if crude became available, meaning that downstream product markets face constraints that cannot be quickly resolved simply by sourcing additional crude.
Why Stretched Refinery Capacity Amplifies Price Risk
Refinery utilisation rates approaching operational ceilings represent a distinct and often underappreciated dimension of the current oil market stress. When refineries are running near capacity, the ability to respond to demand surges or supply composition changes is severely limited. Unplanned outages at individual facilities carry outsized market impact because there is minimal system-wide slack to absorb the lost throughput.
This dynamic means that the refined product markets, where consumers actually purchase fuel, can tighten faster than upstream crude markets, generating pump prices that rise faster than benchmark crude indices would suggest. Consequently, the oil volatility trends emerging from this combination of factors are unlike anything seen in previous disruption cycles, with both upstream and downstream segments simultaneously under structural pressure.
What Would an Oil Price Spike to $150 Look Like for the Global Economy?
The Asymmetric Upside Scenario
The pathway to extreme oil price levels requires a specific confluence of conditions, none of which is individually improbable given the current market backdrop. ExxonMobil's senior vice president Neil Chapman has publicly highlighted the risk that extremely low inventory levels create conditions where price targets in the $150 to $160 range become a realistic upside scenario. This framing aligns with the structural view that once physical buffers are depleted below critical thresholds, price discovery shifts into a regime where demand destruction rather than supply response becomes the primary market-clearing mechanism.
As the Brookings Institution notes in its analysis of Iran conflict energy shocks, the full economic consequences of a sustained Hormuz disruption are rarely fully priced in during the early stages, with the deepest impacts typically materialising several months into the event when inventory buffers have been meaningfully depleted.
Scenario Modelling: Price Escalation Pathways
- Base Case: Strait partially constrained, inventories continue drawing, oil stabilises in the $95–$110 range.
- Elevated Case: Disruption extends beyond 120 days, China accelerates import purchasing, inventories breach critical lows, oil tests $130–$140.
- Extreme Case: Full closure sustained, strategic reserves depleted, refinery stress intensifies, $150–$160 becomes a realistic upside target under conditions of critically low inventory.
Important disclaimer: These are scenario projections, not forecasts. Price scenarios involve significant uncertainty and should not be treated as investment advice. Readers should consult qualified financial advisers before making any investment decisions based on commodity price projections.
Precautionary Buying and Hoarding: How Sentiment Amplifies Physical Shortages
One of the less-discussed dynamics of major oil supply shocks is the role of precautionary inventory building by end-users. When buyers anticipate ongoing tightness, they tend to purchase more than immediate needs require, building buffer stocks as insurance against future unavailability. This behaviour is rational at the individual level but collectively accelerates the depletion of available supply, creating a self-reinforcing tightening dynamic.
The same psychology that drives precautionary buying in consumer markets plays out at industrial scale among refiners, utilities, and petrochemical producers, all of whom have incentives to hold more inventory when supply security is uncertain.
China's Potential Return to Import Markets at Scale
China's import behaviour represents one of the most significant swing factors in the current supply shock scenario. If China, which periodically adjusts its crude purchasing pace based on price levels and geopolitical considerations, were to accelerate its import buying at a moment when physical supply is already constrained, the demand multiplier effect on global prices could be substantial. Even a relatively modest increase in Chinese import volumes would consume a significant portion of available non-Hormuz supply, tightening the market further and potentially catalysing the price escalation scenarios described above.
Can Strategic Petroleum Reserves Contain the Shock?
How SPR Releases Work and Why They Are a Finite Buffer
Strategic petroleum reserves serve as emergency buffers rather than structural supply alternatives. The United States Strategic Petroleum Reserve, one of the world's largest at roughly 370 million barrels in recent years following prior drawdowns, provides a finite quantity of crude that can be released at controlled rates to dampen short-term price spikes. Coordinated releases through the International Energy Agency, which can mobilise member country reserves simultaneously, have historically been deployed during acute supply disruptions.
However, the key limitation of SPR releases is mathematical. Against a disruption removing 10 to 14 million barrels per day from global supply, even aggressive coordinated SPR releases covering several million barrels per day represent a partial offset at best, providing weeks or months of bridging capacity rather than a structural resolution. Furthermore, the reserves themselves have been partially drawn down in recent years, reducing the available buffer compared to historical norms.
Why SPR Drawdowns Buy Time But Cannot Substitute for Physical Supply
The fundamental constraint is that SPR releases address the symptom — tight supply — without addressing the cause: disrupted transit. Once reserves are released, they must eventually be replenished, creating a future demand obligation that can itself contribute to price pressure during the recovery phase. The IEA has consistently framed SPR coordination as a tool to manage acute market stress rather than to replace lost supply indefinitely.
What Does Supply Chain Normalisation Actually Require?
The Hidden Bottleneck: Shipping Insurance Markets
Among the least-understood constraints on post-disruption recovery is the role of shipping insurance markets. Marine war risk insurance, which covers vessels transiting contested or dangerous waterways, is underwritten by a relatively small number of specialist insurers in the Lloyd's of London market and similar institutions. When a disruption occurs, underwriters withdraw coverage or reprice it dramatically, effectively preventing tanker operators from transiting the affected zone regardless of the political situation on the ground.
Even after a formal resolution, insurance markets require time to reassess risk, re-establish underwriting capacity, and begin offering coverage at commercially viable rates. This process is independent of the political timeline and is driven by actuarial assessments of residual risk, claims history, and underwriter appetite. It represents a genuine bottleneck that can delay physical supply restoration by weeks even after all other conditions for resumption are in place.
Recovery Timeline Framework
| Recovery Stage | Estimated Timeframe Post-Resolution | Key Dependencies |
|---|---|---|
| Shipping insurance market reopening | 2–4 weeks | Geopolitical risk assessment |
| Tanker traffic resumption | 3–6 weeks | Port clearances, fleet repositioning |
| Crude export volumes recovering | 6–10 weeks | Infrastructure integrity, producer ramp-up |
| Refinery supply normalisation | 8–12 weeks | Feedstock availability, product scheduling |
| Full market confidence restoration | 3–6 months | Sustained political stability |
Tanker Restart Logistics and Refinery Ramp-Up
Beyond insurance, the physical repositioning of tanker fleets adds another layer of logistical complexity. Vessels that diverted to alternative routes during the disruption must be recalled and repositioned. Port authorities on both ends of the supply chain must process clearances and berth allocations. Crew schedules, which may have been rearranged around alternative routing, must be reset. Each of these steps takes time and cannot be compressed below certain practical minimums.
At the downstream end, refineries that adjusted their crude slate during the disruption — switching to alternative grades or modifying processing configurations — cannot simply return to previous operations instantaneously. Refinery optimisation around a new crude diet takes time, and the reversal of those adjustments introduces its own operational risks and efficiency costs.
How Do Energy Markets Price Geopolitical Risk Differently From Fundamental Supply Shocks?
The Difference Between a Risk Premium and a Structural Deficit
One of the most critical distinctions in oil market analysis is the difference between a geopolitical risk premium — a sentiment-driven addition to prices based on perceived threat rather than actual disruption — and a structural supply deficit, a genuine physical shortage of barrels in the market. Risk premiums can be added and removed from oil prices within hours as news flow shifts. Physical supply deficits operate on entirely different timescales.
Geopolitical risk premiums can be priced in and out of markets within hours based on news flow. Physical supply deficits, by contrast, take months to resolve because barrels, tankers, and refinery flows operate on logistical timelines, not trading timelines. This structural lag is the core reason why oil markets can remain tight long after a political resolution appears imminent.
Why Inventory Levels, Not Headlines, Ultimately Determine Price Floors
The practical implication of this distinction is that traders who exit oil positions based on a perceived diplomatic breakthrough may be acting on headline risk resolution rather than physical market resolution. If inventories are genuinely depleted at the time of a political agreement, the fundamental supply-demand balance remains tight regardless of the political outcome. Prices may dip briefly on positive headline flow but can quickly recover as the physical reality of ongoing tightness reasserts itself.
This pattern has been observed in previous disruption cycles and represents one of the more consistent behavioural dynamics in oil market trading. The inverse is also true: when inventories are well-supplied, geopolitical risk premiums tend to fade relatively quickly because the physical buffer absorbs the perceived threat without prices needing to rise to ration supply.
Frequently Asked Questions: Oil Supply Shock in the Strait of Hormuz
What Is the Strait of Hormuz and Why Is It So Important to Global Oil Supply?
The Strait of Hormuz is a narrow maritime passage connecting the Persian Gulf to the Gulf of Oman and the broader Arabian Sea. It serves as the only sea route through which Gulf oil producers can export the majority of their crude and refined products. Its irreplaceability in the global energy architecture stems from both the volume of oil it handles and the lack of viable alternatives capable of absorbing comparable throughput.
How Many Barrels of Oil Pass Through the Strait of Hormuz Each Day?
Approximately 20 million barrels of oil and petroleum products transit the Strait of Hormuz daily, representing roughly one-fifth of global oil consumption. This figure encompasses crude oil destined for Asian refineries, refined products, and liquefied natural gas from Qatar, which also transits the Strait.
What Happens to Oil Prices When the Strait of Hormuz Is Disrupted?
Prices typically spike immediately as traders price in reduced future supply availability. The initial move is partially sentiment-driven, but as physical inventories begin drawing down and refinery feedstock becomes scarcer, the price elevation becomes grounded in genuine supply-demand imbalance. The sustained price level depends heavily on the duration of the disruption, the initial state of global inventories, and the availability of alternative supply sources.
How Long Does It Take for Oil Markets to Recover After a Hormuz Disruption?
Full market normalisation following a Hormuz disruption typically requires three to six months from the point of resolution, accounting for the sequential restart of shipping insurance, tanker logistics, export infrastructure, and refinery supply chains. Political agreements can be reached quickly, but physical supply restoration follows a fundamentally different timeline.
Which Countries Are Most Affected by a Strait of Hormuz Oil Supply Shock?
East Asian economies, particularly Japan, South Korea, China, and India, face the most direct structural exposure due to their heavy dependence on Gulf crude imports. Emerging market oil importers face significant secondary exposure through currency depreciation and rising import bills.
Can Strategic Petroleum Reserves Fully Offset a Hormuz Supply Disruption?
No. At the scale of disruption currently estimated at 10 to 14 million barrels per day of constrained supply, even coordinated SPR releases provide a partial, time-limited buffer. They are a crisis management tool, not a structural substitute for restored physical supply flows.
What Is the Difference Between a Temporary Closure and a Sustained Supply Shock?
A temporary closure lasting days to weeks primarily generates a risk premium without causing severe physical market damage. A sustained disruption extending weeks to months begins depleting inventories, stressing refinery feedstock availability, and creating structural tightness that persists beyond the disruption itself. The 100-day threshold represents the boundary at which a disruption transitions from manageable to structurally damaging for the global energy system.
Key Takeaways: Understanding the Strait of Hormuz Supply Shock in 2026
- The Strait of Hormuz handles approximately 20 million barrels per day, making it structurally irreplaceable in global oil trade with no viable alternative capable of absorbing comparable volumes
- The current disruption represents a historically severe supply impairment, with an estimated 10 to 14 million barrels per day constrained against global demand of approximately 103 million barrels per day
- Physical market recovery following any resolution is a multi-month logistical process spanning the sequential restart of insurance markets, tanker fleets, export infrastructure, and refinery supply chains
- Inventory drawdowns, near-peak refinery utilisation, and constrained shipping flows create compounding upside price pressure that extends well beyond the initial disruption event
- Regional exposure is deeply uneven, with East Asia facing the most direct structural vulnerability due to its concentrated dependence on Gulf crude supply
- Strategic petroleum reserves provide a finite buffer that buys time for political resolution but cannot substitute for the physical restoration of supply flows over a sustained disruption period
- The critical insight separating informed market participants from reactive traders is recognising that geopolitical headlines resolve faster than physical supply deficits, creating the conditions for persistent market tightness even after apparent political progress
Disclaimer: This article is intended for informational and educational purposes only. It does not constitute financial advice, investment recommendations, or an offer to buy or sell any financial instrument. All price scenarios, projections, and market outlooks presented are speculative in nature and involve significant uncertainty. Past market behaviour during previous disruptions does not guarantee similar outcomes in future events. Readers should conduct their own independent research and consult qualified financial advisers before making any investment decisions.
Want To Stay Ahead of the Market Moves Triggered by Major Commodity Disruptions?
When energy shocks reshape global supply chains overnight, waiting for the headlines means waiting too long — Discovery Alert's proprietary Discovery IQ model delivers real-time alerts on significant ASX mineral discoveries, translating complex commodity data into actionable investment opportunities the moment they emerge. Explore how historic discoveries have generated extraordinary returns and begin your 14-day free trial today to position yourself ahead of the broader market.