May 23, 2026
When Geography Becomes a Weapon: The Hidden Mechanics Behind the Oil Price Surge
Every major oil price shock in modern history shares a common thread: the sudden collision of physical geography with geopolitical ambition. The 1973 embargo, the 1979 Iranian Revolution, the 1990 Gulf War — each episode demonstrated that crude oil markets are not simply financial abstractions but are deeply anchored to the physical reality of pipes, ports, and shipping lanes. What is unfolding now in the Middle East follows this same structural logic, only with a compounding intensity that few historical precedents can match. The US blockade of Iranian ports oil prices relationship has created a dual-constraint supply shock that is rewriting benchmarks at a pace not seen in decades.
Understanding why prices have moved so dramatically — and why they may remain elevated far longer than markets initially assumed — requires looking beyond the daily headlines and into the physical and financial architecture of global oil logistics. For context on the broader geopolitical oil price drivers at play, it is worth examining how historical and structural forces compound one another during these events.
When big ASX news breaks, our subscribers know first
The Strait of Hormuz: Why 21 Miles Controls the World's Energy Supply
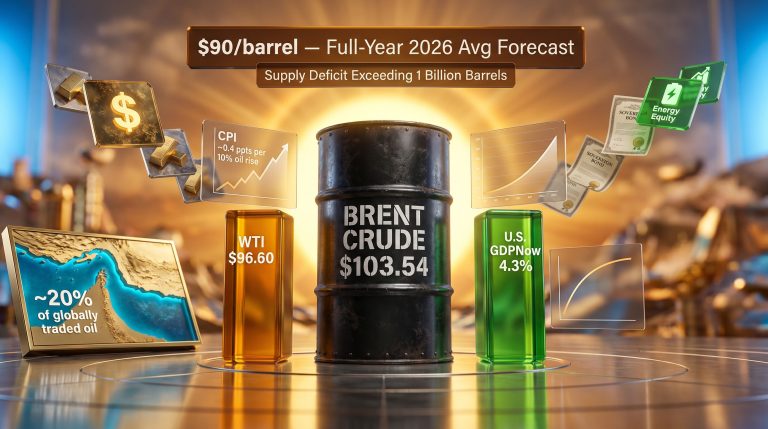
The Strait of Hormuz sits at the mouth of the Persian Gulf, connecting the hydrocarbon-rich basin to the Arabian Sea and the broader global market. At its narrowest navigable point, the Strait is approximately 21 nautical miles wide, with usable shipping channels in each direction measuring just two nautical miles across. Despite this geographic modesty, the waterway carries roughly 20% of all globally traded oil and liquefied natural gas supplies, making it the single most consequential maritime chokepoint in the world's energy system, according to the U.S. Energy Information Administration.
What makes the Strait uniquely vulnerable is the near-total absence of viable alternative routing. Unlike other chokepoints where costly but functional bypass infrastructure exists, the Persian Gulf's geography offers no practical land-based substitute at scale. Certain pipeline infrastructure exists across the Arabian Peninsula, but capacity constraints and political access limitations mean these alternatives can absorb only a fraction of normal Strait volume.
When the Strait is restricted, the global market cannot simply route around the problem — it absorbs the loss. Iran's geographic position on the eastern shore gives it direct regulatory and military leverage over vessel transit. Historically, Tehran has demonstrated both the willingness and capability to interfere with shipping through a combination of naval interdiction, regulatory delays, and — during the 1980s Tanker War — active mining operations. The 2026 Strait of Hormuz crisis therefore draws on a long-established strategic playbook, one that global markets have always treated as a tail risk but rarely priced as a base case.
How the Dual-Layer Blockade Creates a Compounding Supply Shock
The mechanism driving the current oil price surge is not a single disruption but two interlocking constraints operating simultaneously. Each layer amplifies the other's effect:
-
Layer One — US Port Blockade: Washington has moved to prevent commercial shipping from transiting to or from Iranian ports, cutting off Tehran's ability to monetise its crude production and limiting its access to imported goods. This enforcement action operates through a combination of direct maritime presence, shipping insurance restrictions via the London and international P&I markets, and secondary sanctions pressure on third-party shipping companies.
-
Layer Two — Iranian Strait Restriction: Tehran has responded by limiting commercial shipping flows through the Strait of Hormuz, weaponising its geographic control to impose costs on the broader global trading system. This is not merely a threat posture — the restriction is actively reducing the volume of crude transiting to Asian, European, and African markets. Reports confirm that Iranian tankers are piling up outside the Strait as the US blockade tightens.
-
Combined Effect: When both a major producer's export infrastructure and the surrounding transit corridor are constrained simultaneously, the resulting supply shock is disproportionately larger than either disruption in isolation. Supply cannot enter or exit from multiple directions, inventory drawdowns accelerate globally, and futures markets price in a scarcity premium.
A critical but underappreciated dimension of this dynamic is the role of war risk insurance. When geopolitical conflict extends to a major maritime corridor, underwriters in the Lloyd's of London market and international Protection and Indemnity clubs reassess vessel exposure. Premium spikes of several hundred percent on a voyage basis are common under these conditions, effectively pricing some shipping operators out of the corridor entirely even before any physical interdiction occurs.
Brent and WTI: Decoding the Futures Market's Price Signals
What Do the Numbers Actually Say?
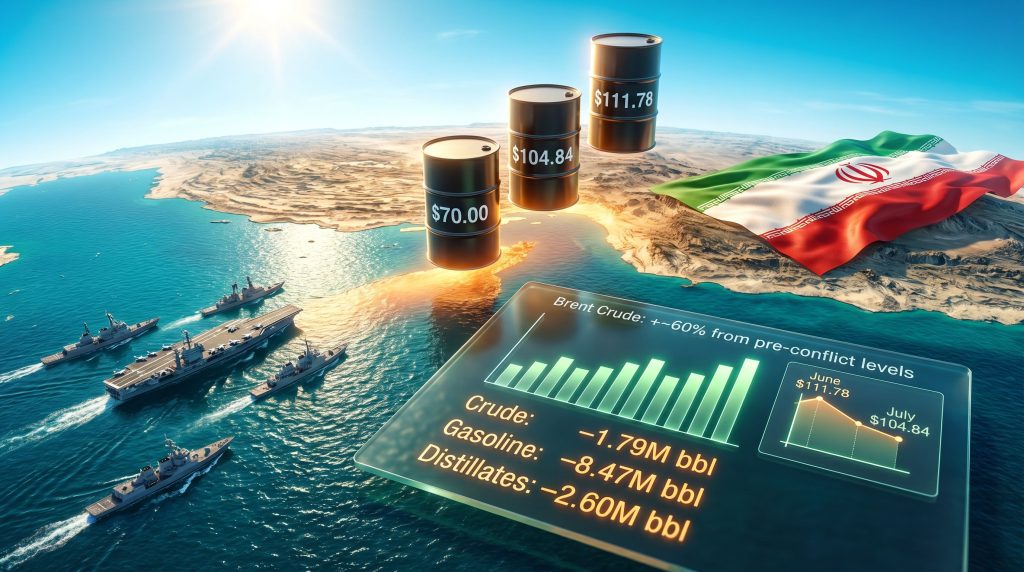
The raw price data from futures markets tells a striking story about the velocity and scale of the supply shock being absorbed. Before the onset of the current conflict, Brent crude traded near $70 per barrel — a level consistent with moderately balanced global supply and demand fundamentals. The trajectory since then has been steep. Reviewing current crude oil prices reveals just how significant the departure from baseline has been:
| Benchmark | Pre-Conflict Level | Current Level | Approximate Change |
|---|---|---|---|
| Brent Crude (June contract) | ~$70.00/bbl | $111.78/bbl | +~60% |
| Brent Crude (July contract) | ~$70.00/bbl | $104.84/bbl | +~50% |
| WTI Crude (June contract) | ~$70.00/bbl | $100.50/bbl | +~44% |
Brent has recorded eight consecutive daily gains, while WTI has risen in seven of the last eight trading sessions. WTI gained 3.7% in a single prior session, illustrating the velocity at which geopolitical risk premium is being loaded into forward prices.
What Does Backwardation Signal?
Beyond the headline levels, the structure of the futures curve carries its own analytical signal. The $6.94 spread between the expiring June Brent contract at $111.78 and the more actively traded July contract at $104.84 reflects a classic backwardation configuration. In backwardated markets, near-term prices exceed forward prices — a structure that communicates acute physical supply tightness in the present rather than a longer-term structural deficit.
This is a crucial distinction for investors: backwardation signals that the market is experiencing a real-time squeeze on available barrels, not merely a sentiment-driven rally built on future speculation. It is worth noting that June contract prices are mechanically amplified by proximity to expiry — with only days remaining on that contract, traders unwilling to take physical delivery exit aggressively, concentrating price pressure.
US Inventory Data: Confirming the Supply Shock Is Physical, Not Psychological
One of the most important distinctions in oil market analysis is between price moves driven by sentiment and those driven by actual physical supply changes. The American Petroleum Institute's (API) inventory data for the week ending April 24 confirms that the current rally has a tangible physical foundation:
US Crude Inventory Drawdowns — Week Ending April 24
- Crude oil stocks: down 1.79 million barrels (second consecutive weekly decline)
- Gasoline inventories: down 8.47 million barrels
- Distillate inventories: down 2.60 million barrels
The gasoline drawdown of 8.47 million barrels in a single week is the figure that most demands attention. To contextualise the scale: total US gasoline inventories typically sit in a range of 200–230 million barrels. A one-week drawdown of 8.47 million barrels represents roughly 4% of total national gasoline stock in seven days. This magnitude is consistent with the kind of accelerated drawdown seen during extreme demand or supply stress events, not normal seasonal variation.
The back-to-back crude drawdown confirms that the Hormuz closure is actively pulling from both strategic and commercial reserve buffers. National average gasoline prices have already exceeded $4 per gallon, and analysts estimate that if the current supply constraint persists, retail prices could climb by a further $0.10 to $0.15 per gallon at the national average level.
The Three-Way Deadlock: Why Resolution Is Not the Base Case
Despite a technical ceasefire between the US-Israeli coalition and Iran, no formal peace framework exists. The current impasse is defined by three structurally incompatible positions that make near-term resolution mathematically difficult:
-
Washington's Position: The US demands a verifiable, monitored end to Iran's alleged nuclear weapons development programme as a precondition for lifting the port blockade and normalising economic relations.
-
Tehran's Position: Iran is seeking financial reparations for conflict-related damages, substantive and durable easing of the existing economic sanctions architecture, and some form of recognised governance role over Strait of Hormuz transit — a demand that Washington regards as categorically unacceptable.
-
Structural Deadlock: Neither party has demonstrated readiness to offer the concessions required to unlock meaningful negotiations. The blockade continues, the Strait remains restricted, and global inventories keep declining.
Reports citing US officials indicate that the Trump administration has directed advisers to plan for a prolonged continuation of the Iranian port blockade, treating sustained economic pressure as a lower-cost alternative to renewed direct military engagement. This posture shifts the probability distribution of outcomes significantly toward the protracted stalemate scenario.
Furthermore, an important but underappreciated dimension of this standoff is the role of domestic political timing. The White House has publicly acknowledged that pump price relief is unlikely in the near term — a signal that policymakers themselves do not anticipate a rapid resolution and have chosen to absorb the political cost of elevated energy prices in exchange for the strategic objective of maximum economic pressure on Tehran.
The next major ASX story will hit our subscribers first
Three Scenarios for Where Oil Prices Go From Here
Translating geopolitical uncertainty into investable price frameworks requires scenario discipline. The current situation maps to three distinct trajectories:
| Scenario | Trigger Conditions | Brent Price Range | WTI Price Range |
|---|---|---|---|
| Rapid Diplomatic Resolution | Ceasefire converts to formal agreement; Strait reopens within 30 days | $75–$85/bbl | $70–$80/bbl |
| Protracted Stalemate (Base Case) | Blockade extended; Strait restricted for 3–6 months | $100–$115/bbl | $95–$110/bbl |
| Escalation Spiral | Renewed military engagement; additional regional actors drawn in | $125–$145/bbl | $120–$140/bbl |
The base-case scenario is now the most widely held institutional view, supported by the absence of credible diplomatic off-ramps and the US administration's publicly stated preference for extended economic pressure. Under this scenario, the transmission from crude futures to retail pump prices operates with a typical two-to-four week lag, meaning current benchmark levels will continue flowing through to consumer prices in the coming weeks. The trade war oil impact adds yet another layer of complexity to these projections, compounding the upward price pressure already generated by the Strait disruption.
Capital Market Contagion: Beyond the Pump Price
The effects of the US blockade of Iranian ports oil prices dynamic extend well beyond fuel costs for consumers and businesses. Financial markets across the broader MENA region and global commodity complex are registering measurable stress:
-
World Bank projections have flagged a 24% surge in energy prices across 2026 attributable to Middle East conflict dynamics. Given that Brent has already risen approximately 60% from pre-conflict levels, this forecast is tracking conservatively relative to actual market outcomes.
-
MENA debt markets have contracted materially, with geopolitical uncertainty contributing to a 12% decline in MENA debt issuance in Q1 2026 — a direct reflection of investor risk aversion toward the region.
-
GCC sukuk issuers have been placed on Rating Watch Negative by major credit agencies, as the downstream financial contagion from regional instability reaches Islamic finance markets that were previously operating with considerable insulation from direct conflict exposure.
-
Gold markets have shown a nuanced response. Rather than benefiting uniformly from safe-haven demand, gold as a safe haven has experienced periods of price softness as capital rotates into energy commodities — a pattern that reflects the unusual nature of an inflationary supply shock rather than a purely risk-off financial crisis.
OPEC+ Fragmentation as an Amplifying Variable
The UAE's decision to exit OPEC and OPEC+ introduces a significant structural complication at precisely the moment when coordinated production policy is most needed. Historically, OPEC's market influence during supply shock events has been its capacity to mobilise spare capacity among member states to moderate price spikes — a function that essentially served as a price ceiling buffer for the global economy.
A weakened OPEC+ framework reduces this buffering capacity. If the cartel cannot coordinate a compensatory output increase to offset Iranian supply losses, then the traditional stabilising mechanism that markets have relied upon for decades is less available in the current environment. Consequently, this structural shift means that the upside price scenarios carry more probability weight than they would have under a cohesive OPEC+ umbrella.
Frequently Asked Questions: US Blockade of Iranian Ports and Oil Prices
What is the US blockade of Iranian ports?
The US has implemented a maritime enforcement action that prevents commercial shipping from operating to or from Iranian ports, designed to cut off Iran's crude oil export revenues and restrict its access to imported goods. This action operates alongside existing sanctions architecture and has been reported as likely to be extended beyond its initial enforcement period.
Why has the US blockade of Iranian ports oil prices relationship caused such sharp moves?
Iran is a significant global crude producer. The simultaneous restriction of its port access and Iran's own closure of the Strait of Hormuz — through which approximately 20% of all global oil and LNG supplies transit — creates a compounding supply reduction. When physical supply falls faster than demand adjusts downward, futures markets price in a scarcity premium that drives benchmark prices higher across both near-term and forward contracts.
How high could oil prices go if the blockade continues?
Under the base-case protracted stalemate scenario, Brent crude could remain in the $100 to $115 per barrel range. A full escalation scenario involving renewed military engagement and additional regional actors could push prices toward $125 to $145 per barrel. From pre-conflict levels near $70 per barrel, prices have already risen approximately 60%.
What would need to happen for oil prices to return to pre-conflict levels?
A formal diplomatic resolution that reopens the Strait of Hormuz and results in the lifting of the US port blockade would be the primary price-normalising catalyst. However, given the current three-way deadlock between US demands, Iranian preconditions, and the absence of a functioning peace framework, market participants are not pricing in a near-term resolution.
What does backwardation in the oil futures market mean for investors?
Backwardation occurs when near-term futures contracts price above longer-dated contracts. The current spread between Brent's June and July contracts signals acute near-term physical supply tightness. For commodity investors, backwardation creates a positive roll yield for long futures positions — meaning investors who hold and roll expiring contracts forward collect the spread between near-term and forward prices, adding return beyond simple price appreciation.
This article is intended for informational purposes only and does not constitute financial, investment, or trading advice. Oil price forecasts and scenario projections involve significant uncertainty and may not reflect actual future market conditions. Readers should conduct independent research and consult qualified financial advisers before making investment decisions based on geopolitical or commodity market analysis.
Want to Stay Ahead of the Next Major Commodity Discovery Driven by Shifting Energy Markets?
Discovery Alert's proprietary Discovery IQ model delivers real-time alerts on significant ASX mineral discoveries — instantly translating complex commodity data into actionable investment insights for traders and long-term investors alike. Explore how historic discoveries have generated substantial returns on Discovery Alert's dedicated discoveries page, and begin your 14-day free trial today to position yourself ahead of the broader market.