
May 24, 2026
Strategic Energy Market Positioning and Global Trade Dynamics
The transformation of global energy markets represents one of the most significant economic shifts of the 21st century. Traditional supply chains that dominated international energy trade for decades now face unprecedented disruption as technological advances, geopolitical realignments, and changing consumer demands reshape how nations approach energy security. This transformation extends far beyond simple commodity trading patterns, influencing manufacturing competitiveness, international diplomatic relationships, and long-term economic development strategies across multiple continents.
Understanding these complex dynamics requires examining how emerging supply sources interact with established demand centers, creating new winners and losers across diverse economic sectors. Furthermore, the interplay between domestic energy costs and export opportunities creates strategic trade-offs that policymakers must navigate carefully, balancing immediate economic gains against long-term competitive positioning in an increasingly interconnected global marketplace.
When big ASX news breaks, our subscribers know first
How U.S. LNG Export Capacity Drives Global Market Transformation
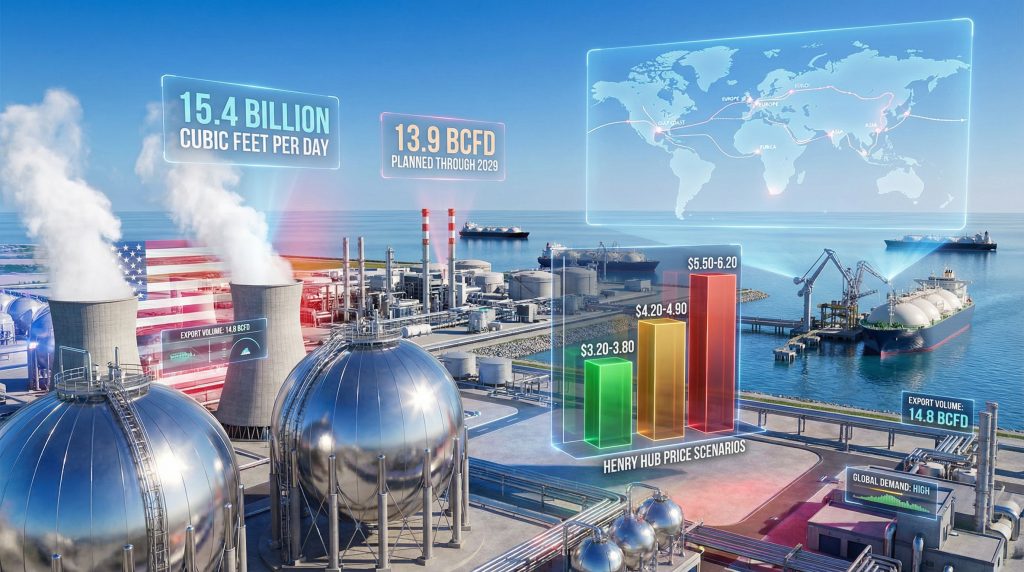
U.S. LNG exports have fundamentally altered global liquefied natural gas dynamics through unprecedented export capacity expansion. Current infrastructure supports 15.4 billion cubic feet per day (bcfd) of liquefaction capacity, with an additional 13.9 bcfd projected through 2029. This represents a strategic pivot from domestic energy security to global energy dominance, positioning America as the world's primary swing supplier.
Export Volume Growth Trajectory
U.S. LNG exports reached a record 111 million metric tons in 2025, surpassing 100 million metric tons for the first time. This milestone reflects both increased utilization rates at existing facilities and new capacity additions from major projects across the Gulf Coast region.
Key Operational Milestones:
- Plaquemines LNG Phase 1: Operational December 2024 with 0.72 bcfd nameplate capacity
- Corpus Christi Stage 3: Expected to add approximately 0.5 bcfd capacity
- Golden Pass LNG: Louisiana project with significant capacity additions planned
- CP2 LNG and Delta LNG: Additional projects in development pipeline
The production-to-export infrastructure sequence involves natural gas extraction from unconventional formations, interstate pipeline transportation, Gulf Coast terminal receipt facilities, liquefaction at -162°C, pressurised storage, marine tanker loading, and international ocean transport. This complex supply chain requires substantial coordination between upstream producers, midstream transporters, and downstream export terminals.
Market Share and Competitive Positioning
| Global LNG Supplier | Market Share | Key Advantages | Growth Trajectory |
|---|---|---|---|
| United States | 20-22% | Flexible production, geographic access | Rapidly expanding |
| Qatar | 18-20% | Low-cost reserves, established contracts | Moderate growth |
| Australia | 15-17% | Proximity to Asian markets | Limited expansion |
| Russia | 8-10% | Pipeline alternatives available | Constrained by sanctions |
The U.S. has leveraged unconventional shale gas production capabilities from the Permian Basin, Marcellus Shale, and Haynesville Shale formations to transition from historical energy import dependence to becoming a global energy exporter. This transformation positions America as a critical counterweight to traditional suppliers, particularly following geopolitical disruptions affecting conventional supply sources.
Economic Trade-Off Analysis Between Export Revenues and Domestic Costs
Domestic Price Projection Scenarios
According to the Industrial Energy Consumers of America analysis, U.S. natural gas price trajectories will depend significantly on export volume growth:
| Export Level (bcfd) | Domestic Price ($/MMBtu) | Consumer Cost Impact | Manufacturing Impact |
|---|---|---|---|
| 15.0 (Current baseline) | $3.20-3.80 | Baseline | Competitive advantage maintained |
| 18.1 (2027 target) | $4.20-4.90 | +$54B annually per $1 increase | Margin compression begins |
| 22.0 (Maximum scenario) | $5.50-6.20 | +$162B consumer costs | Significant competitiveness loss |
Cost Transmission Mechanisms
Henry Hub serves as the pricing benchmark for North American natural gas futures contracts traded on NYMEX. The index price reflects cost basis at the primary interconnection point where production, pipeline capacity, and demand interact. Export-driven demand increases upward pressure on this benchmark price throughout the domestic supply chain.
The price transmission mechanism operates as follows:
- Increased LNG export nominations reduce domestic supply availability
- Higher prices at Gulf Coast terminals create upward pressure on interstate pipeline prices
- Increased basis spreads develop between Henry Hub and regional delivery points
- Direct consumer impact through electricity generation and heating costs
European Market Impact Projections
Wood Mackenzie forecasts suggest European traded gas prices could decline by nearly 50% through 2030, driven by oversupply from American and Qatari projects. This price reversal creates a $46 billion annual cost reduction for European industry by 2032, fundamentally altering manufacturing competitiveness equations.
European demand for industrial natural gas has declined by 21% since 2021 while industrial power demand has decreased by 4%, driven by soaring gas prices after Russia's invasion of Ukraine.
Lower European energy costs are expected to benefit energy-intensive sectors such as petrochemicals, metals, and chemicals, which have been under severe cost pressure since the global energy crisis. Consequently, the continent's pharmaceuticals, food processing, and data centre sectors are likely to capture larger shares of international markets.
Industrial Sector Vulnerability Assessment
High-Risk Domestic Manufacturing Sectors
Chemical and Petrochemical Manufacturing: These industries face particularly acute pressure as natural gas represents both an energy input (typically 30-40% of production costs) and a feedstock input for product synthesis. Price increases compound across both categories, creating disproportionate margin impacts for commoditised products operating at 5-10% net margins.
Fertiliser and Ammonia Production: Natural gas comprises 30-50% of total production costs in fertiliser manufacturing. A $1/MMBtu increase in natural gas costs approximately $75-150 per ton of ammonia output, depending on technology efficiency. For a 500,000 ton-per-year facility, this translates to $37.5-75 million in incremental annual costs.
Primary Metals Processing: Steel production using direct reduction iron (DRI) technology relies on natural gas as both fuel and reducing agent. European mills considering relocation to U.S. markets benefit from lower energy costs, but this advantage diminishes as domestic prices rise.
Power Generation Economics Shift
Natural gas-fired combined cycle gas turbine (CCGT) generation currently provides the lowest-cost electricity in most U.S. markets at $35-55/MWh operating cost. However, at elevated natural gas prices, operating economics change dramatically:
- At $5.50/MMBtu: Operating costs rise to $60-80/MWh
- At $6.50/MMBtu: Operating costs approach $70-95/MWh
At these price points, coal-fired generation becomes cost-competitive, potentially reversing recent coal plant retirements and delaying natural gas-to-renewable transitions in regions with substantial coal capacity. Moreover, these renewable energy transitions face additional challenges as economic incentives shift.
European Industrial Renaissance Potential
Energy-intensive European manufacturing sectors stand to benefit significantly from reduced input costs. The EU's dependence on U.S. LNG exports has grown from 45% in 2024 to more than 57% by early 2026, creating substantial price sensitivity to American supply availability.
Sector-Specific Benefits:
- Metals processing: Reduced energy costs improve competitiveness against Asian producers
- Pharmaceuticals: Lower operational expenses support expanded research and development
- Data centres: Cheaper electricity enables capacity expansion and technological advancement
Infrastructure Constraints and Capacity Development Challenges
Pipeline Bottlenecks and Solutions
Existing interstate pipeline networks require substantial upgrades to support projected export volumes. The Permian Basin alone needs additional takeaway capacity to reach Gulf Coast terminals effectively.
Current Infrastructure Gaps:
- Permian Basin takeaway capacity: Current interstate pipeline capacity to Gulf Coast terminals approximately 6-7 bcfd
- Required expansion: Additional projects planned to reach 8-9 bcfd by 2027-2028
- Major pipeline projects: Expansion of Texas Eastern, Columbia Gulf, and Tennessee Gas Pipeline systems
Terminal Development Timeline
Major liquefaction facilities represent critical capacity additions, but construction delays pose supply chain risks:
| Project | Location | Capacity (bcfd) | Status | Expected Online |
|---|---|---|---|---|
| Plaquemines LNG Phase 1 | Louisiana | 0.72 | Operational | December 2024 |
| Corpus Christi Stage 3 | Texas | 0.50 | Under construction | 2026-2027 |
| Golden Pass LNG | Louisiana | 0.75 | Under construction | 2027-2028 |
| Venture Global CP2 | Louisiana | 1.45 | Approved | 2029-2030 |
Regulatory Framework Evolution
The Trump administration's 2025 policy reversals, including approval of Venture Global's 1.446 bcf/year Louisiana project, signal accelerated permitting timelines. However, future administrations might reimpose stricter environmental reviews, potentially slowing project approvals and increasing compliance costs.
Department of Energy export authorisations could face renewed scrutiny if domestic price impacts become politically problematic. In addition, federal support for pipeline and port infrastructure could accelerate capacity additions.
Geopolitical Risk Scenarios and Supply Security Considerations
Middle East and Maritime Security
Shipping route disruptions through key chokepoints could redirect global LNG flows, benefiting U.S. suppliers while increasing transportation costs. The Strait of Hormuz and Suez Canal represent critical vulnerability points for global energy trade.
Recent incidents involving Iranian gunboats confronting U.S.-flagged oil tankers in the Strait of Hormuz highlight ongoing security risks that could affect global energy pricing and supply chain reliability. These tensions demonstrate how geopolitical factors interact with the oil price rally and broader energy market dynamics.
European Energy Independence Strategy
The EU's increased reliance on U.S. LNG exports creates strategic dependency that influences foreign policy alignment. This relationship provides America with significant geopolitical leverage but also creates obligations to maintain reliable supply during crisis periods.
The US-China trade war impacts further complicate these relationships, as energy security becomes intertwined with broader economic and security considerations.
Asian Market Competition Dynamics
Qatar's capacity expansions and potential Russian pipeline diversions could challenge U.S. market share in premium Asian markets. Japan's Mitsui recently moved to secure stakes in Qatar's massive North Field expansion project, highlighting ongoing competition for long-term supply contracts.
The next major ASX story will hit our subscribers first
Data Centre Growth and Artificial Intelligence Energy Demands
Computational Load Expansion Impact
Artificial intelligence infrastructure creates unprecedented electricity demand patterns, with data centres requiring reliable baseload power. Natural gas-fired generation provides the flexibility needed to support renewable intermittency, creating additional domestic consumption pressure beyond traditional industrial uses.
Projected Demand Growth:
- Each major AI facility consumes 100-500 MW of continuous power
- Equivalent to small cities in electricity consumption
- Natural gas demand for electricity generation could grow 15-25% beyond current projections
- Tech companies expanding computational capacity drives sustained demand growth
The concentration of data centres in regions with abundant natural gas resources creates localised demand pressures that affect regional pricing dynamics. This geographic clustering amplifies the competition between export terminals and domestic electricity generation for available gas supplies.
Investment Strategy Framework for LNG Export Growth
Infrastructure Investment Opportunities
Midstream Assets: Pipeline companies connecting production regions to export terminals offer stable, fee-based revenue streams with inflation protection. These assets typically operate under long-term contracts that provide predictable cash flows despite commodity price volatility.
Terminal Expansion Projects: Liquefaction facility operators benefit from long-term contracts with international buyers, typically spanning 15-20 years with built-in escalation clauses. The LNG industry is expected to contribute up to $1.3 trillion to U.S. GDP by 2040 and generate $166 billion in federal and state tax revenues.
Supporting Industries: Marine transportation, specialised construction, and maintenance services experience sustained demand growth throughout the build-out phase. Nearly 500,000 jobs are expected to be created, encompassing direct, indirect, and induced employment opportunities.
Risk Management Considerations
Currency and Price Hedging: International LNG contracts typically denominate in U.S. dollars with escalation clauses, providing natural currency protection for American operators while creating exchange rate risks for foreign buyers. Export revenues fluctuate with global gas prices, requiring sophisticated hedging strategies.
Regulatory and Environmental Compliance: Future policy changes could affect project economics through environmental standards, export licensing requirements, and infrastructure investment support levels. Furthermore, these considerations must account for US tariff dynamics affecting international competitiveness.
Clean Energy Transition Implications
Bridge Fuel Dynamics
Natural gas serves as a transitional fuel supporting renewable energy integration, but increased exports could extend fossil fuel dependence globally while supporting emission reduction efforts through coal displacement. The Canada energy transition provides insights into how neighbouring countries balance these competing priorities.
Carbon Accounting Complexities: U.S. LNG exports transfer emissions from American consumption to international markets, complicating national climate commitments. However, displacing coal-fired generation in importing countries may yield net global emission reductions.
Technology Development Funding
Export revenues could fund advanced technologies like carbon capture and blue hydrogen production, accelerating clean energy innovation. The challenge lies in balancing short-term economic benefits with long-term environmental commitments.
Competitive Advantages and Market Position Assessment
Structural Market Benefits
Production Flexibility: Unconventional shale gas production can scale rapidly in response to price signals, providing supply elasticity unavailable from conventional sources. This responsiveness allows American producers to capture price premiums during supply disruption periods.
Geographic Positioning: Gulf Coast terminals offer efficient access to both Atlantic and Pacific markets, reducing transportation costs compared to Middle Eastern or Australian competitors.
Financial Market Access: Deep capital markets and established energy infrastructure financing provide competitive advantages in project development and expansion. Over $50 billion is projected to flow into new infrastructure projects through 2030.
Long-Term Strategic Positioning
American LNG exports represent a fundamental shift in global energy architecture, creating complex trade-offs between export revenue maximisation and domestic economic competitiveness. Success requires careful balance while managing geopolitical relationships and environmental commitments.
The strategic implications extend beyond commodity trading to encompass manufacturing competitiveness, energy security, and international influence. As export capacity doubles through 2029, policymakers must navigate increasingly complex relationships between domestic energy costs and global market opportunities.
Disclaimer: This analysis contains forward-looking projections and estimates that involve inherent uncertainties. Actual market conditions, regulatory changes, and technological developments may differ significantly from current expectations. Energy market investments carry substantial risks, including commodity price volatility, regulatory changes, and geopolitical disruptions. Readers should conduct independent research and consult qualified professionals before making investment decisions.
Ready to Capitalise on the Next Energy Discovery?
Discovery Alert's proprietary Discovery IQ model delivers real-time alerts on significant ASX energy and mineral discoveries, instantly empowering subscribers to identify actionable opportunities ahead of the broader market. Begin your 14-day free trial today and secure your market-leading advantage in the rapidly evolving energy sector.