June 5, 2026
The Geology That Makes Conventional Cost Curves Irrelevant
Most uranium projects are evaluated on a single dimension: how cheaply can they produce a pound of U₃O₈? That framing, while intuitive, misses an entirely different category of mineral asset, one where the uranium is essentially free because everything else extracted alongside it covers the cost of getting it out of the ground. Understanding why the Viken Deposit PEA results have attracted serious attention from critical minerals analysts requires starting not with a financial model, but with a geological anomaly buried beneath Jämtland County in central Sweden.
The Cambrian-age Alum Shale formation is one of the world's most unusual sedimentary sequences. Unlike typical black shale units that carry one or two economically interesting metals, the Alum Shale is a polymetallic host rock that simultaneously concentrates vanadium, uranium, potassium, molybdenum, nickel, copper, and zinc within a single, laterally continuous stratigraphic package. What makes the Viken occurrence particularly extraordinary is a structural event that occurred during the Silurian period.
Compressional tectonics thrust and folded the Alum Shale sequence so dramatically that the original host rock thickness of just 20 to 30 metres was amplified to approximately 180 metres. That six-fold increase in thickness is the geological foundation for everything that follows in the economic analysis.
At the mineralogical level, the metal hosting mechanisms within the Viken Alum Shale are highly specific. Vanadium is locked within the crystal lattice of roscoelite, a chromium-vanadium mica mineral. Uranium occurs predominantly as sub-micrometric uraninite crystals, meaning individual grains are extraordinarily fine, which has historically made processing design challenging but has been addressed through the modified pug roast flowsheet.
Nickel, molybdenum, copper, and zinc are all hosted as sulphide phases, which respond well to flotation. This multi-phase metal distribution is not a complication; it is, furthermore, the source of the by-product credit economics that defines the project's cost structure.
When big ASX news breaks, our subscribers know first
Viken Deposit PEA Results: What the Numbers Actually Say
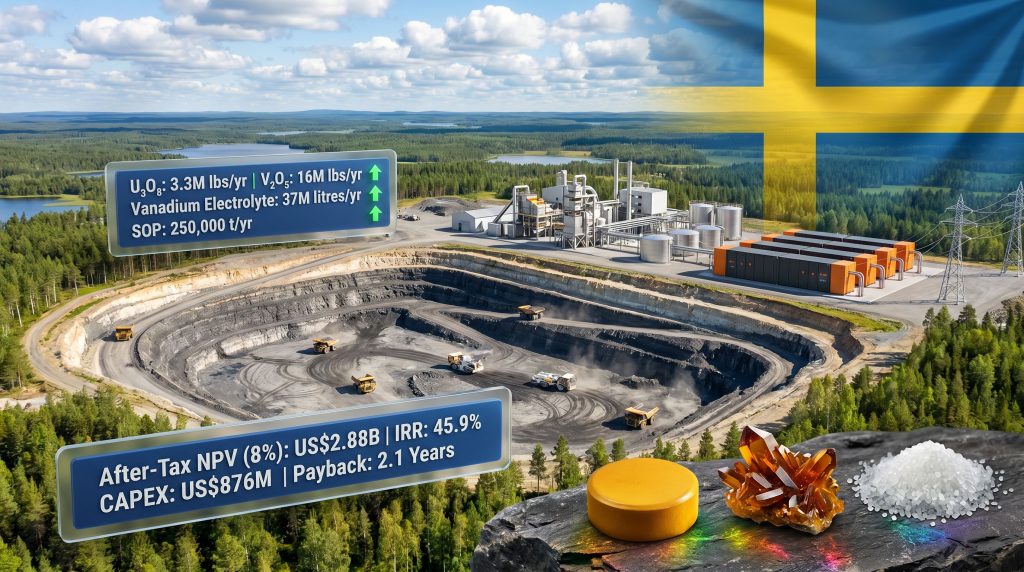
The Viken Deposit PEA results, announced by District Metals Corp. (TSX-V: DMX) on June 2, 2026, represent a step-change in how analysts should think about European critical minerals energy security development. The study was prepared by P&E Mining Consultants Inc. and METS Engineering Group Pty Ltd, both of whom have direct experience with Alum Shale economic assessments in Sweden, which matters considerably given the geological and processing specificities of this deposit type.
The headline financial metrics are as follows:
| Financial Metric | Value |
|---|---|
| After-Tax NPV (8% Discount Rate) | US$2.88 billion |
| Internal Rate of Return (IRR) | 45.9% |
| Initial Capital Expenditure (CAPEX) | US$876 million |
| Average Annual After-Tax Free Cash Flow | US$531 million |
| Payback Period | 2.1 years |
| Life of Mine (LOM) | 13 years |
| Total LOM Mill Feed | 127.4 million tonnes |
To contextualise the payback period: a 2.1-year capital recovery window on an initial investment of US$876 million is exceptionally short for a mining project of this scale. Many tier-one mining developments at similar capital intensity carry payback periods of five to eight years. The IRR of 45.9% further reinforces that the project, at base case commodity prices, generates returns that would be competitive across most capital-intensive industrial sectors, not just mining.
It is important to note that PEA-level studies carry a higher degree of technical uncertainty than Pre-Feasibility Studies or Feasibility Studies. The results are preliminary, and actual outcomes may differ materially depending on permitting, metallurgical validation, capital market conditions, and commodity prices. Investors should not treat PEA outputs as confirmed project economics. You can review the full PEA announcement directly from District Metals Corp. for complete technical details.
Why the Indicated-Only Approach Matters for Credibility
One detail that deserves more attention than it typically receives in early-stage resource coverage is the conservative scoping of the mine plan. The PEA's 127.4 million tonne life-of-mine production schedule draws exclusively from the Indicated Mineral Resource of 456 million tonnes. The additional 4.3 billion tonne Inferred Mineral Resource base, classified under NI 43-101 standards with an effective date of April 25, 2025, is entirely excluded from the economic model.
To put that in perspective: the planned mine consumes approximately 2.8% of the total known resource footprint. The 4.3 billion tonne Inferred base represents a scale of mineralisation that, even at lower confidence, suggests extraordinary long-term optionality for future project phases, should the deposit advance through prefeasibility and beyond.
The full resource classification breakdown is shown below:
| Classification | Tonnes (Mt) | U₃O₈ Grade (ppm) | V₂O₅ Grade (ppm) | Contained U₃O₈ (Mlb) | Contained V₂O₅ (Mlb) |
|---|---|---|---|---|---|
| Indicated | 456 | 175 | 2,836 | 176 | 2,851 |
| Inferred | 4,333 | 161 | 2,543 | 1,538 | 24,295 |
The resource was estimated using 122 drill holes completed by previous operators between 2006 and 2012, with drill hole spacing ranging from 30 to 380 metres and averaging approximately 300 metres. Additional exploration targets adjacent to the current MRE boundaries carry a conceptual potential range of 980 to 1,040 million tonnes at grades of 140 to 180 ppm U₃O₈ and 2,170 to 2,740 ppm V₂O₅. These targets are conceptual in nature and have not been classified as Mineral Resources; readers should not place undue reliance on these estimates. Consequently, interpreting drill results at this stage requires careful consideration of confidence levels and classification thresholds.
Negative-Cost Uranium: How the By-Product Credit Model Works
The single most counterintuitive aspect of the Viken Deposit PEA results is the average cash cost of negative US$121 per pound of U₃O₈, net of by-product credits, with an all-in sustaining cost of negative US$118 per pound over the life of mine. For an industry where most conventional uranium producers operate at all-in costs between roughly US$25 and US$65 per pound, a negative cost figure demands explanation rather than simply assertion.
The mechanism is straightforward once the revenue structure is understood. Vanadium, sulphate of potash, ferrovanadium, vanadium electrolyte, and a mixed sulphide product collectively generate revenue that, when applied against the total operating cost, more than offsets the cost attributable to uranium production. Uranium effectively becomes a co-product that rides at zero marginal cost once by-product revenues are netted.
The operating cost structure is detailed below:
| Cost Category | US$/tonne Processed | US$/lb U₃O₈ |
|---|---|---|
| Open Pit Mining | $3.50 | – |
| Processing | $37.43 | – |
| Dry Stack Tailings | $1.81 | – |
| General & Administrative | $1.33 | – |
| SOP Freight | $2.51 | – |
| Total Operating Cost | $46.58 | $34.57 |
| Average Cash Cost (net of by-product credits) | – | -$121/lb U₃O₈ |
| AISC (net of by-product credits) | – | -$118/lb U₃O₈ |
The operating margin of 145% reflects the substantial revenue contribution from the non-uranium commodity streams. This is a structural cost position, not a temporary market condition, because it is based on physical recovery rates and processing yields rather than spot price spikes.
Comparing This to the Global Uranium Cost Curve
For context, the World Nuclear Association and various independent commodity research sources have consistently placed global uranium production costs in a range where new mine development typically requires sustained uranium prices above US$60 per pound to be economically viable. The current uranium market dynamics make this threshold particularly relevant for evaluating new project economics.
The Viken Deposit, by contrast, is economically robust at the base case uranium price of US$85 per pound whilst simultaneously achieving negative net production costs for uranium because vanadium and potash revenues carry the economic weight.
The annual uranium output of 3.3 million pounds of U₃O₈ is also strategically significant at a national level. According to data referenced in the PEA announcement, this volume is sufficient to meet the full uranium fuel requirements of Sweden's currently operating nuclear reactor fleet, representing a genuine domestic energy security proposition rather than simply an export opportunity.
The Production Profile Across Five Commodity Streams
The 13-year production schedule at 10 million tonnes per annum generates outputs across multiple commodity markets simultaneously, which is both the source of the project's economic strength and a complexity that investors need to understand clearly.
| Commodity | Annual Production | Life of Mine Total |
|---|---|---|
| Uranium (U₃O₈) | 3.3 million lbs | 41.8 million lbs |
| Vanadium Pentoxide (V₂O₅) | 16 million lbs | 203.9 million lbs |
| Vanadium Electrolyte | 37 million litres | 474.4 million litres |
| Ferrovanadium (FeV) | 6 million kg | 76.2 million kg |
| Sulphate of Potash (SOP) | 250,000 tonnes | 3.2 million tonnes |
The Vanadium Dimension: Strategic Supply Diversification
Russia and China currently dominate global vanadium pentoxide flake supply, accounting for a substantial majority of annual production capacity. The Viken Deposit's potential annual output of 16 million pounds of V₂O₅ represents a material Western alternative at a time when supply chain diversification for this metal has become a priority across European industrial policy discussions. In addition, the uranium supply challenges facing Western nations reinforce why projects with multi-commodity revenue streams carry particular strategic value.
Vanadium serves two distinct end markets addressed by this project:
- Vanadium electrolyte (37 million litres per year): Used in vanadium redox flow batteries (VRFBs), which are increasingly deployed for grid-scale energy storage. The base case price assumption is US$9 per litre.
- Ferrovanadium (6 million kg per year): Used as a steel-strengthening alloying agent, with a base case price of US$38 per kilogram. The blended vanadium price assumption across both products equates to US$15.7 per pound of V₂O₅.
Approximately 35% of total V₂O₅ production is directed to electrolyte, with the remaining 65% allocated to ferrovanadium. This split reflects current market depth and pricing, but it also positions the project within the emerging energy storage supply chain, which has long-term demand tailwinds independent of the steel cycle.
Sulphate of Potash: An Underappreciated Revenue Driver
The SOP output of 250,000 tonnes per year deserves particular attention because it addresses a genuine European supply vulnerability. Europe currently relies on imports for sulphate of potash, a premium agricultural fertiliser that cannot be substituted at scale by muriate of potash (standard potassium chloride) for chloride-sensitive crops including fruits, vegetables, and certain grains.
At the base case price of US$650 per tonne, annual SOP revenue alone contributes materially to the by-product credit pool. The SOP market is forecast to grow at a compound annual growth rate of 3.9% through 2034, according to industry research cited in the announcement. The Viken project's prospective annual output would represent approximately 16% of Europe's total annual SOP demand, making it a structurally significant domestic supply source if developed.
Mining Method and Processing Architecture
Surface Mining Without Explosives: A Structural Advantage
One of the less-discussed technical elements of the Viken Deposit PEA results is the mining method. Rather than conventional drill-and-blast open pit techniques, the operation is designed around surface miners, continuous cutting machines capable of cutting 0.3 metres into the Alum Shale per pass. This approach eliminates explosive materials entirely from the operation, which has implications for:
- Environmental compliance and community relations in Jämtland County
- Operating cost predictability (no drill consumables, no blast crew requirements)
- Continuous mining efficiency versus batch-cycle conventional blasting
Haulage is planned using 91-tonne class trucks comparable to the CAT 777, loaded by wheel loaders. The operation will be owner-operated, meaning the company will manage all cutting, loading, hauling, and maintenance activities directly rather than relying on mining contractors.
The LOM strip ratio of 0.2:1 (waste to mill feed) is extraordinarily low. For reference, many open pit operations manage strip ratios of 3:1 to 6:1 or higher, meaning they move three to six tonnes of waste for every tonne of ore processed. At 0.2:1, the Viken mine moves only 0.2 tonnes of waste per tonne of feed, substantially reducing haulage costs and simplifying logistics. Total waste across the 13-year mine life amounts to just 23.4 million tonnes, primarily limestone, versus 127.4 million tonnes of mill feed.
The Pug Roast Flowsheet: Step-by-Step
The processing approach is built around a modified pug roast configuration, which is a thermal-chemical process that converts multiple metal species into water-soluble sulphate forms simultaneously. This is the critical technical innovation that makes multi-commodity recovery from a single ore stream economically viable.
The full processing sequence is:
- Crushing
- Grinding
- Flotation
- Pug Roasting (concentrated sulphuric acid combined with thermal activation)
- SOP Crystallisation
- Ion Exchange
- Solvent Extraction
- Uranium and Vanadium Precipitation
- Mixed Metals Precipitation
- Residue Handling (dry stack tailings)
The metallurgical recovery rates achieved through this flowsheet are as follows:
| Commodity | Recovery Rate |
|---|---|
| Uranium (U₃O₈) | 90% |
| Vanadium (V₂O₅) | 70% |
| Sulphate of Potash (SOP) | 70% |
| Molybdenum | 50% |
| Zinc | 50% |
| Nickel | 30% |
The 90% uranium recovery rate is notably high for a refractory host rock and reflects the advantage of the pug roast thermal activation step, which breaks down the fine-grained uraninite crystal structure that would resist conventional leaching approaches.
Capital Structure and Sensitivity Analysis
CAPEX Breakdown Across Initial and Sustaining Phases
| Capital Category | Initial (US$M) | Sustaining (US$M) | Total (US$M) |
|---|---|---|---|
| Mine | 60 | 44 | 105 |
| Process Plant, Infrastructure & Indirect | 657 | 79 | 736 |
| Rehabilitation | – | 8 | 8 |
| Contingency | 159 | 26 | 185 |
| Total | 876 | 158 | 1,034 |
The contingency allocation of approximately 22% embedded within the initial capital estimate is consistent with standard practice at PEA study level, where cost uncertainty ranges typically fall between 25% and 35%. A 22% contingency is therefore at the tighter end of the acceptable range, suggesting the cost estimation team applied detailed vendor input and regional cost benchmarking rather than relying solely on factored estimates.
Economic Resilience Across Commodity Price Scenarios
The sensitivity analysis below demonstrates how the Viken Deposit PEA results perform across a wide range of commodity price scenarios:
| Scenario | After-Tax NPV (US$M) | After-Tax IRR (%) | Payback (Years) |
|---|---|---|---|
| -30% commodity prices | $1,023M | 24.3% | 3.7 years |
| -20% commodity prices | $1,642M | 32.2% | 2.9 years |
| -10% commodity prices | $2,262M | 39.3% | 2.5 years |
| Base Case | $2,881M | 45.9% | 2.1 years |
| +10% commodity prices | $3,498M | 52.0% | 1.9 years |
| +20% commodity prices | $4,115M | 57.8% | 1.8 years |
| +30% commodity prices | $4,732M | 63.3% | 1.6 years |
Even at a 30% reduction across all commodity prices simultaneously, the project still delivers an after-tax NPV above US$1 billion and an IRR of 24.3%. That level of downside resilience is rarely seen in early-stage mining economics, and it derives directly from the multi-commodity revenue base rather than dependence on any single metal price.
The base case commodity price assumptions used in the study are:
| Commodity | Price Assumption |
|---|---|
| Uranium (U₃O₈) | US$85/lb |
| Vanadium Electrolyte | US$9/litre |
| Ferrovanadium (FeV) | US$38/kg |
| Sulphate of Potash (SOP) | US$650/tonne |
| Molybdenum | US$27.22/lb |
| Nickel | US$7.71/lb |
| Zinc | US$1.45/lb |
The next major ASX story will hit our subscribers first
Fiscal Contributions and Environmental Commitments
What Sweden Receives From the Viken Deposit
The project's fiscal contribution to Sweden over the 13-year mine life is substantial:
| Fiscal Item | LOM Total |
|---|---|
| State Mineral Fee to Landowners (0.15%) | US$22 million |
| State Mineral Fee to Sweden (0.05%) | US$7 million |
| Corporate Tax (20.6% rate) | US$1.6 billion |
A corporate tax contribution of US$1.6 billion over the life of mine represents a meaningful revenue stream for the Swedish state, which is relevant context for evaluating the project's broader stakeholder value proposition.
Environmental Design Beyond Minimum Standards
The PEA proposes a dry stack tailings system in which waste slurry is de-watered and thickened before placement, allowing for progressive land rehabilitation back to pre-mining condition. This approach is significantly preferable to conventional wet tailings storage from a long-term environmental liability perspective and eliminates the dam failure risk associated with conventional tailings ponds.
Additional environmental design elements include dust suppression technologies appropriate for Jämtland County's ecological context, water management systems designed to exceed current Swedish regulatory thresholds, and a comprehensive environmental baseline study covering air, water, and soil across the Viken Property and surrounding areas.
It is worth noting that Swedish mining legislation includes municipal veto provisions that can apply to certain project types, including Alum Shale development. This represents a genuine regulatory risk factor that investors should evaluate independently as the project advances toward permitting stages.
What Comes Next: The Path From PEA to Prefeasibility
The Viken Deposit PEA results establish technical and financial merit at the preliminary assessment level. Advancing through a definitive feasibility study will require execution across several parallel workstreams. However, the project must first complete its Pre-Feasibility Study, which demands progress across the following areas:
- Infill drilling programs designed to convert Inferred Mineral Resources to the Indicated classification, reducing geological uncertainty across the broader resource base
- Confirmatory, variability, and optimisation metallurgical testwork to validate the pug roast recovery assumptions under a range of feed conditions
- Geotechnical and hydrogeological drilling to support detailed mine design and pit slope stability analysis
- Environmental baseline studies characterising existing conditions across air, water, and soil parameters
- Filing of the full NI 43-101 technical report on SEDAR+ within 45 days of the June 2, 2026 announcement
The scale optionality embedded in this project cannot be overstated from a long-term investor perspective. The 127.4 million tonne PEA mine plan represents approximately 2.8% of the total 4.3 billion tonne Inferred Resource base. Future mining phases would, by design, leverage the existing processing plant and infrastructure already built during Phase 1, materially reducing the incremental capital intensity of any expansion scenario. For a deeper technical breakdown, the Viken property overview on the District Metals website provides additional geological context and exploration history.
Disclaimer: This article is intended for informational purposes only and does not constitute financial advice. The Viken Deposit PEA results are preliminary in nature and subject to significant technical and economic uncertainty. Mineral resource estimates are not mineral reserves and do not have demonstrated economic viability. Forward-looking statements involve known and unknown risks, and actual outcomes may differ materially from those projected. Readers should conduct their own independent due diligence before making any investment decisions.
Want to Spot the Next Major Multi-Commodity Discovery Before the Market Does?
Discovery Alert's proprietary Discovery IQ model delivers real-time alerts on significant ASX mineral discoveries — instantly translating complex geological and resource data into actionable insights for investors at every experience level. Explore how historic discoveries have generated exceptional returns on Discovery Alert's dedicated discoveries page, and start your 14-day free trial today to position yourself ahead of the broader market.