How Have Precious Metals Performed in 2025?
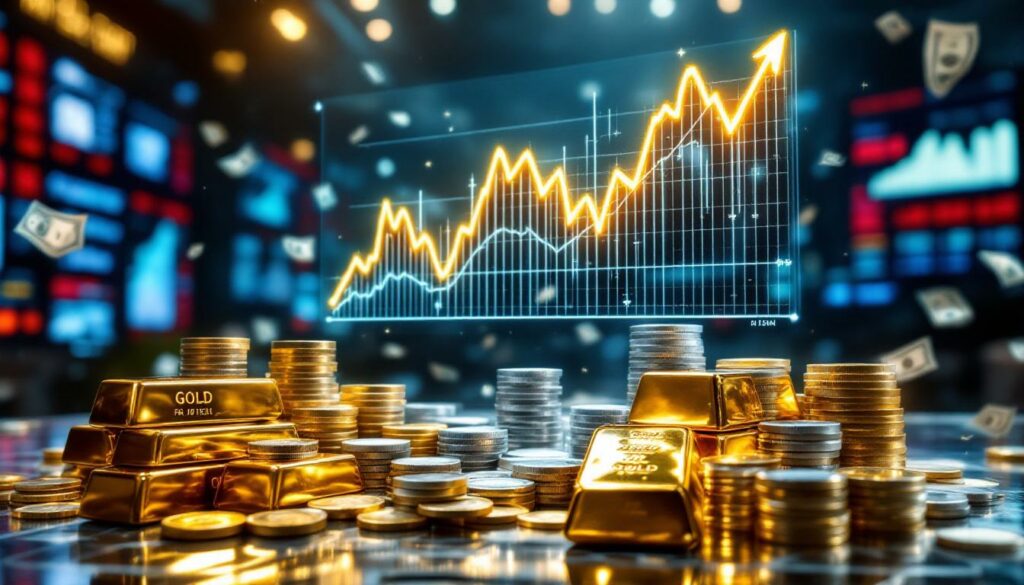
The precious metals market has delivered exceptional returns in 2025, confounding analyst expectations and outpacing traditional investment vehicles by a significant margin. Gold, silver, and platinum have all posted remarkable gains through the first half of the year, establishing themselves as premier safe-haven assets during a period of economic uncertainty and geopolitical tensions.
Unexpected Price Surges Across the Board
Gold has surged an impressive 26% year-to-date, reaching $3,330 per ounce by mid-2025. The yellow metal has repeatedly broken records, establishing a new all-time high of $3,500 during a particularly volatile trading session in May. This performance builds upon gold's strong 2024 showing, when it climbed from $2,076 to $2,666 per ounce.
Silver has demonstrated similar strength, climbing 25% since January to trade around $36.89 per ounce. This performance continues silver's multi-year bull run, benefiting from both investment demand and industrial applications in green technologies.
Perhaps most surprising has been platinum's performance, which has skyrocketed nearly 50% to trade above $1,400 per ounce. This dramatic price movement represents the most significant percentage gain among the major precious metals, defying virtually all analyst forecasts.
"What we're witnessing in 2025 is the culmination of years of supply deficits finally manifesting in dramatic price discovery. The physical markets are speaking louder than paper markets for the first time in decades." – Industry analyst
These gains stand in stark contrast to the performance of other asset classes:
- Stocks: Struggling with gains in the low single digits
- Bonds: Showing modest performance despite rate adjustments
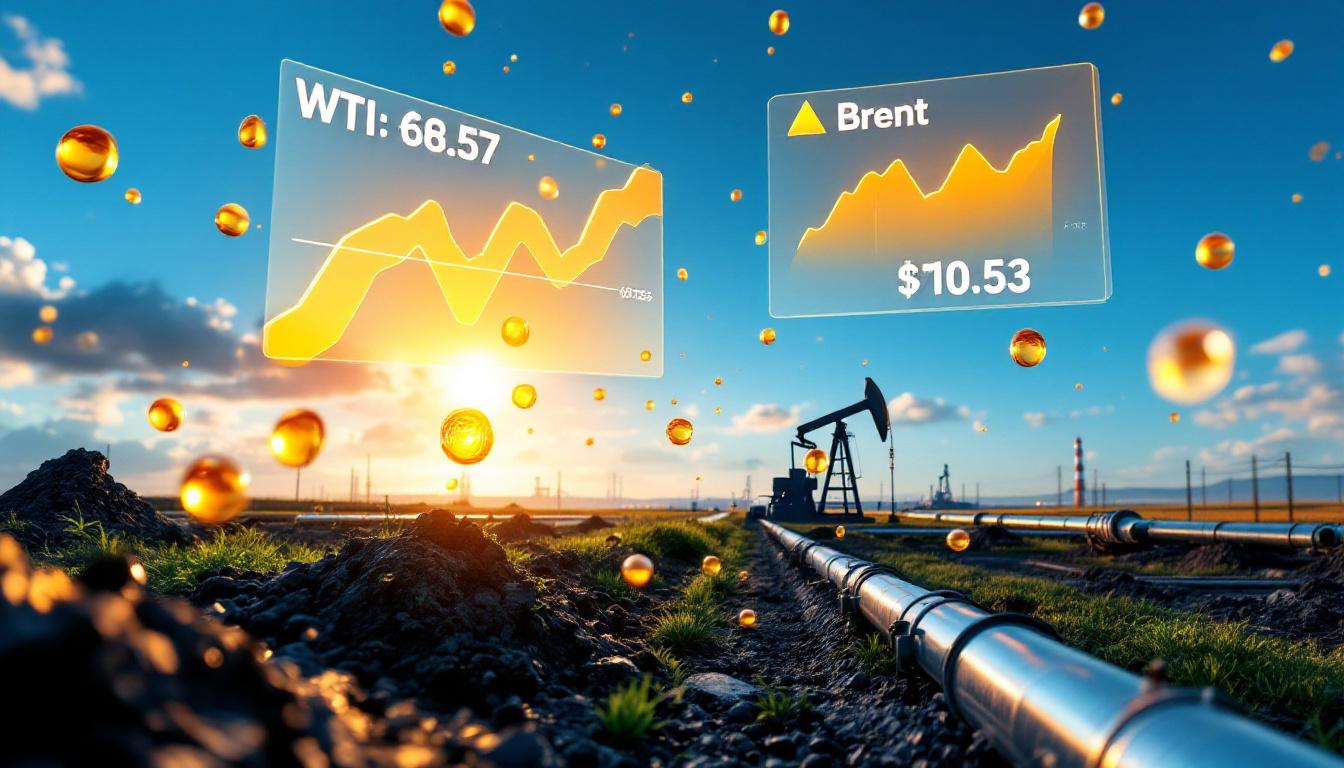
- Crude oil: Down approximately 9% amid demand concerns
Comparing to Traditional Investments
The performance gap between precious metals and conventional financial markets reveals the defensive nature of gold, silver, and platinum during periods of economic uncertainty. The US dollar index has exhibited significant volatility with each policy shift from the White House, driving investors toward hard assets as a hedge against currency fluctuations.
This outperformance becomes even more remarkable when considering the broader economic context. While equity markets have struggled to maintain momentum despite generally positive corporate earnings, precious metals have attracted substantial capital flows from institutional investors seeking portfolio diversification.
Key factors driving the metals surge include:
- Persistent global inflation concerns
- Tariff impacts on metals
- Supply chain restructuring affecting physical delivery
- Central bank purchasing (particularly from emerging economies)
- Mining production constraints
- Growing industrial demand for silver and platinum
For investors who positioned their portfolios with significant precious metals exposure entering 2025, the rewards have been substantial, with many metals-focused funds posting their best first-half performance in over a decade.
Why Did Analysts Get Their 2025 Gold Forecasts So Wrong?
The dramatic divergence between gold price forecast and market reality represents one of the most significant analytical failures in recent memory. Leading financial institutions and industry experts consistently underestimated gold's potential, raising questions about the methodologies behind precious metals forecasting.
Major Bank Projections vs. Reality
JP Morgan projected gold would reach $3,000 per ounce by late 2025, a forecast that seemed bullish at the time but has already been surpassed midway through the year. UBS similarly undershot with their $2,850 per ounce year-end 2025 forecast, which gold exceeded in February.
The London Bullion Market Association (LBMA) conducts one of the industry's most comprehensive annual surveys, compiling projections from 30 professional analysts. Remarkably, not a single LBMA analyst expected gold to exceed $3,300 per ounce in 2025. Even the most optimistic analyst in the group targeted an average price of $3,755 for the year—not as a peak value.
The reality has proven dramatically different, with gold already reaching $3,500 in the first half of 2025, setting a new all-time high and maintaining elevated levels despite occasional profit-taking.
Comparison of leading forecasts vs. actual performance:
| Institution/Analyst | 2025 Gold Forecast | Actual Mid-Year Price | Variance |
|---|---|---|---|
| JP Morgan | $3,000 | $3,330 | +$330 |
| UBS | $2,850 | $3,330 | +$480 |
| LBMA Survey (Avg) | ~$2,900 | $3,330 | +$430 |
| Most Bullish LBMA | $3,755 (yearly avg) | $3,330 (mid-year) | N/A |
Gold's Historical Context
Understanding gold's dramatic 2025 performance requires examining its recent trajectory. Gold started 2024 at $2,076 per ounce and ended the year at $2,666, representing a robust 28% annual gain. This strong performance led many analysts to anticipate a consolidation phase or "pause" in 2025, expecting the market to digest these gains before potentially resuming its upward trend.
Instead, gold has continued its upward trajectory without the predicted consolidation period, building on 2024's momentum and accelerating in response to new market catalysts. This demonstrates the limitations of forecasting models that often assume mean reversion or cooling periods following strong performance years.
The analytical failure highlights several critical insights:
- Consensus bias – When most analysts cluster around similar forecasts, it creates an echo chamber effect that can miss emerging catalysts
- Excessive reliance on historical patterns – Assuming markets will follow historical consolidation patterns ignores unique contemporary factors
- Underestimating structural shifts – Many models failed to account for fundamental changes in global trade flows and physical metal movement
- Psychological anchoring – Previous price levels created mental anchors that limited upside projections
This forecasting disconnect serves as a reminder that even professional analysts with sophisticated models can significantly misjudge markets when faced with unprecedented conditions or structural changes to global trade flows.
How Accurate Were Silver Price Predictions?
While gold prices analysis significantly underestimated actual performance, silver price predictions have proven substantially more accurate, with current prices aligning closely with many analyst projections. This disparity in forecasting accuracy between gold and silver offers valuable insights into the different market dynamics affecting each metal.
Silver Forecast Analysis
Major financial institutions provided relatively consistent silver forecasts for 2025. JP Morgan predicted silver would reach $38 per ounce by late 2025, while UBS offered a similar range of $36-$38 per troy ounce. The LBMA survey revealed greater diversity of opinion, with 14 out of 30 analysts predicting silver would exceed $38 per ounce, and several forecasting prices above $40.
The current reality shows silver trading around $36.89, which falls within the lower end of most institutional forecasts. Remarkably, Nikki Shields with MKS PAMP demonstrated exceptional accuracy with her $36.50 average forecast—just 39 cents away from the current mid-year price.
Why were silver forecasts more accurate than gold?
- Silver's industrial component makes demand more predictable
- Silver's traditional correlation with gold allowed analysts to extrapolate from gold's 2024 performance
- The silver market has experienced six consecutive years of supply deficits, creating a well-understood fundamental backdrop
- Physical silver's greater availability compared to platinum prevented the extreme supply shortages seen in the platinum market
Silver's Market Dynamics
Silver traditionally follows gold with a lag effect, often described as "gold on steroids" during bull markets due to its smaller market size and greater volatility. Analysts correctly anticipated this relationship would continue, with silver benefiting from gold's strong 2024 performance and extending into 2025.
"Silver's dual personality as both a precious and industrial metal gives forecasters more data points to work with. The industrial demand side provides a more stable baseline, while investment demand follows gold's lead with amplification." – Precious metals analyst
The accuracy of silver predictions compared to gold and platinum highlights an important market reality: silver occupies a middle ground between purely monetary metals (gold) and metals with significant industrial applications and severe supply constraints (platinum). This balanced profile made silver's behavior more predictable despite the unusual market conditions of 2025.
Silver's performance has been supported by multiple factors:
- Physical investment demand growing alongside gold's rise
- Industrial consumption increasing for solar panels, electronics, and medical applications
- Supply deficits persisting for the sixth consecutive year
- ETF inflows accelerating as investors seek inflation protection
- Declining mine grades limiting production increases despite higher prices
This balanced demand profile has created a more predictable price trajectory, allowing analysts like Shields to make remarkably accurate forecasts despite the market's overall volatility.
What Caused Platinum's Unexpected Rally?
Platinum has delivered the most dramatic price movement among precious metals in 2025, with a nearly 50% gain that has left virtually every market forecaster scrambling to explain its unexpected strength. This remarkable performance demands closer examination of the unique factors driving platinum's sudden price discovery.
Platinum Forecast Failures
The analytical consensus for platinum in 2025 was decidedly bearish to neutral, with not a single LBMA analyst anticipating platinum's dramatic price surge. JP Morgan predicted $1,200 per ounce by year-end, citing tightening mine supply and potential ETF inflows as supportive factors. UBS projected a modest $1,100 per ounce ceiling, while more bearish analysts clustered around $920.
The reality has proven starkly different, with platinum trading several times above $1,400 per ounce—representing a forecasting error of nearly 30% compared to even the most optimistic projections.
Platinum price forecast errors:
| Source | 2025 Forecast | Current Price | Error (%) |
|---|---|---|---|
| JP Morgan | $1,200 | $1,400+ | +16.7% |
| UBS | $1,100 | $1,400+ | +27.3% |
| Bearish Consensus | $920 | $1,400+ | +52.2% |
Supply Constraints Driving Prices
The platinum market is experiencing an unprecedented silver market squeeze that has fundamentally altered its price dynamics. Physical supply has become extremely tight due to a combination of factors that forecasters failed to fully appreciate:
-
ETF holder behavior: A significant portion of platinum ETF holders bought near $1,450 in the previous market cycle and remain underwater on their investments. Unlike typical market behavior where higher prices trigger selling, these holders are unwilling to liquidate positions until reaching break-even points, effectively removing a crucial source of metal that would normally cool price rallies.
-
Mine production challenges: South Africa, which accounts for approximately 75% of global platinum production, continues to face significant operational challenges including:
- Persistent power supply issues
- Labor disputes
- Declining ore grades
- Water shortages
- Infrastructure limitations
-
Chronic deficits materializing: The platinum market has experienced structural deficits that were previously masked by above-ground inventories. These inventories have been steadily depleted, creating a situation where even minor demand increases trigger outsized price responses.
"The physical platinum market has become so tight that normal market safety valves have jammed shut. When ETF holders refuse to sell until break-even and mines can't increase production quickly, the price discovery mechanism becomes explosive." – Industry analyst
This combination of factors has created a perfect storm for platinum prices, with physical reality finally asserting itself in markets that had previously been dominated by paper trading. The result has been price discovery that exceeds virtually all professional forecasts, highlighting the limitations of models that fail to properly account for physical market dynamics.
Why Are Precious Metals Forecasting Models Failing?
The significant divergence between analyst projections and actual precious metals performance in 2025 reveals fundamental flaws in traditional forecasting methodologies. These failures extend beyond simple calculation errors to expose structural limitations in how market models handle unprecedented conditions.
The Unpredictability Factor
Conventional forecasting models rely on predictable variables and relationships, typically incorporating factors such as interest rates, inflation expectations, currency movements, and historical correlations. However, precious metals thrive precisely on unpredictable events and uncertainty—elements that models struggle to quantify.
This fundamental contradiction became particularly evident in 2025, as metals markets responded to a cascade of unprecedented events that traditional models couldn't effectively process:
- Policy uncertainty: The Trump administration's approach to trade and monetary policy introduced variables that defied conventional modeling
- Supply chain restructuring: Global metal flows underwent significant reorganization in response to tariffs
- Physical market anomalies: Backwardation, lease rate spikes, and delivery premiums occurred more frequently than models predicted
- Investor psychology shifts: Risk perception changed dramatically, altering traditional correlations
"Models rely on predictability, and precious metals thrive on the unpredictable. This fundamental tension means forecasting models are inherently disadvantaged during periods of heightened uncertainty." – Market analyst
Key Disruption Factors
The implementation of sweeping tariff policies exceeded analyst expectations in both scope and impact. While most models incorporated some tariff effects, they significantly underestimated:
- Policy persistence: Uncertainty has persisted longer than anticipated
- Circulation disruptions: Tariffs have jolted the entire precious metals ecosystem
- Market mechanics: Lease rates for gold, silver, and platinum shot higher and remained elevated
- Arbitrage opportunities: Significant spreads opened between London and US inventories
These disruptions created feedback loops that amplified price movements beyond what linear models predicted. For example, higher lease rates incentivized holders to lend metal rather than sell, reducing available supply precisely when demand was increasing—a dynamic that accelerated price increases beyond model projections.
Traditional model limitations:
| Model Component | Limitation Exposed |
|---|---|
| Historical correlations | Break down during structural shifts |
| Mean reversion assumptions | Invalid during supply deficits |
| Geopolitical risk premiums | Difficult to quantify tariff impacts |
| Technical indicators | Less reliable with physical market dominance |
| Sentiment analysis | Unable to capture institutional positioning |
The failure of forecasting models in 2025 demonstrates that precious metals markets are undergoing a fundamental shift where physical market realities are reasserting themselves after decades of paper market dominance. This transition exposes the limitations of models built primarily on financial market assumptions rather than physical supply-demand fundamentals.
What Market Signals Indicate Structural Changes?
Beyond the price movements themselves, several key market indicators suggest the gold and precious metals market analysis is undergoing profound structural changes rather than experiencing temporary aberrations. These signals provide valuable insights into the fundamental shifts reshaping the market landscape.
Supply-Demand Imbalances
Silver has entered its sixth consecutive year of deficit, with global consumption exceeding production by approximately 200-250 million ounces annually. This persistent imbalance has gradually depleted above-ground inventories, creating conditions where even modest demand increases can trigger significant price responses.
A particularly telling signal has been the multiple instances of backwardation observed in silver markets during 2025. Backwardation—when spot prices exceed futures prices—indicates immediate physical demand outstripping available supply, a condition that contradicts the normal contango structure of commodity markets where storage and financing costs typically make future delivery more expensive.
Platinum's physical supply constraints have similarly prevented the price corrections that typically follow rapid appreciation. With ETF holders maintaining positions until reaching break-even points from previous market cycles, a critical source of metal that would normally cool rallies remains unavailable.
"When markets enter backwardation repeatedly within a short timeframe, it signals that physical demand is stripping away inventory buffers. This is precisely what we're seeing in silver and platinum." – Market analyst
The persistence of these imbalances suggests fundamental rather than transitory factors are driving price action:
- Mine supply constraints cannot be quickly resolved, even at higher prices
- Physical inventory depletion has reached critical levels after years of deficits
- Industrial demand growth continues despite higher prices
- Investment demand increasing as inflation concerns persist
Trade Flow Disruptions
The implementation of tariff policies has forced significant adjustments throughout the precious metals supply chain. Traders and refiners are actively rewiring supply chains to minimize tariff impacts, implementing additional hedging strategies, and exploiting persistent arbitrage opportunities between global markets.
These adjustments have created friction in previously efficient global metal movements, resulting in:
- Regional price disparities: Premiums in tariff-affected markets
- Delivery delays: Extended wait times for physical settlement
- Inventory redistribution: Strategic repositioning to avoid tariffs
- Financing cost increases: Higher costs to move metal between markets
Examples of trade flow disruptions:
| Market Segment | Disruption Observed |
|---|---|
| Refining | Rerouting of dore and concentrates |
| Storage | Strategic vault location shifts |
| Delivery | Premium spikes for specific bar brands |
| Transport | Insurance cost increases for cross-border movement |
| Financing | Extended lease durations to secure metal |
These trade flow disruptions represent more than temporary inefficiencies—they signal a
Ready to Capitalise on the Next Major Mineral Discovery?
Don't miss out on potential investment opportunities in the precious metals market! Visit Discovery Alert's dedicated discoveries page to understand how real-time alerts on significant ASX mineral discoveries, powered by our proprietary Discovery IQ model, can give you a market-leading edge for both short-term trading and long-term investment decisions.