Why Was Platinum the Top Performing Commodity in H1 2025?
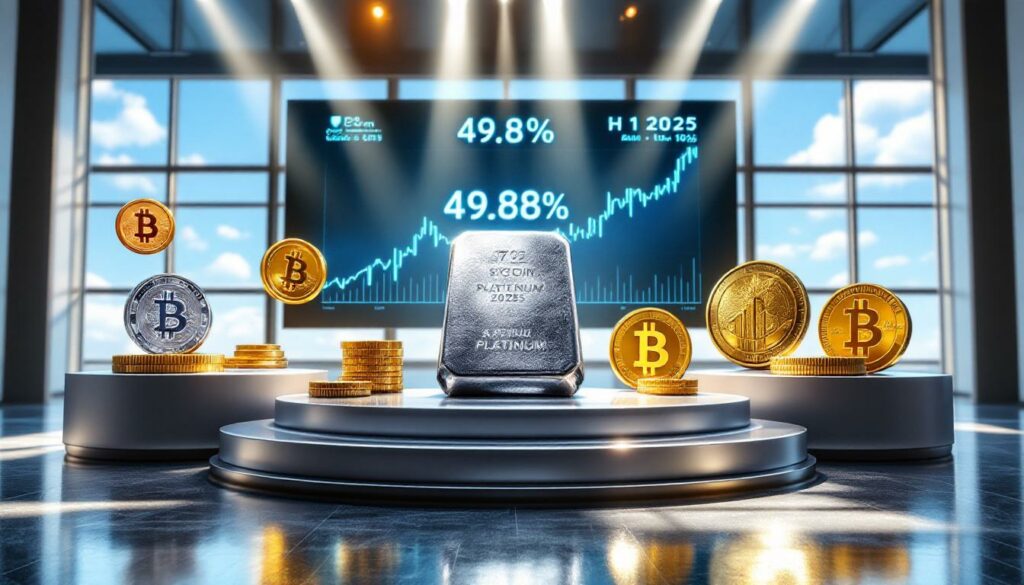
Platinum emerged as the standout performer in commodity markets during the first half of 2025, outpacing all other raw materials with an impressive 49.8% gain. This remarkable performance marks a significant shift in the precious metals landscape and offers important insights for investors navigating commodity markets.
The metal's exceptional run was driven by a perfect storm of supply constraints, diversified demand sources, and increasing industrial applications, particularly in green hydrogen technologies. Unlike many commodities that quickly respond to price signals, platinum's supply demonstrates remarkable inelasticity in the short term.
According to the World Platinum Investment Council (WPIC), "Even as prices surged throughout H1 2025, production remained sluggish, leading to persistent market imbalances that continue to support higher prices." This supply-demand dynamic has been the primary catalyst behind platinum's meteoric rise.
The Platinum Surge: Understanding the 49.8% Rally
Breaking Down Platinum's Record-Breaking Performance
Platinum prices skyrocketed from approximately $900 per ounce in January to around $1,360 by the end of June 2025, representing nearly a 50% increase. The second quarter alone saw a 35.8% jump, pushing platinum to price levels not witnessed since 2014. This dramatic rise has caught the attention of investors worldwide, particularly those seeking alternatives to traditional safe-haven assets.
During this period, platinum convincingly outperformed other precious metals, with gold gaining 25.9% and silver rising 24.9%. This outperformance reverses a multi-year trend where platinum traded at a significant discount to gold, suggesting a potential revaluation of the metal's worth in both investment and industrial contexts.
Supply Constraints Driving Price Action
The primary catalyst behind platinum's exceptional performance has been persistent supply limitations. Despite the significant price appreciation, mining output remained constrained throughout the first half of 2025, creating sustained market imbalances that supported higher prices.
South Africa, which accounts for over 70% of global platinum production, experienced multiple South Africa mining challenges including electricity shortages, labor disputes, and declining ore grades at aging mines. According to the Minerals Council South Africa, production declined by 5.8% in Q1 2025 compared to the same period in 2024, with minimal recovery expected before year-end.
"The platinum mining sector faces structural challenges that cannot be quickly resolved even with higher prices. New mines take 5-7 years to develop, and existing operations are dealing with deeper, more complex ore bodies that increase extraction costs." — Minerals Council South Africa, June 2025 Quarterly Report
This supply inelasticity is particularly pronounced compared to other commodities, where higher prices typically stimulate production increases within months rather than years.
Diversified Demand Supporting Long-Term Outlook
Platinum benefits from a uniquely diversified demand profile compared to other precious metals. Its applications span multiple sectors:
- Industrial catalysts and manufacturing (28% of demand)
- Automotive catalytic converters particularly in diesel vehicles (33% of demand)
- Jewelry fabrication (25% of demand)
- Emerging green hydrogen technologies (8% of demand and growing rapidly)
- Investment demand through ETFs and physical holdings (6% of demand)
This broad-based demand provides platinum with greater resilience against sector-specific downturns compared to palladium, which remains heavily dependent on gasoline vehicle manufacturing.
The most significant growth driver has been platinum's critical role in hydrogen fuel cells and electrolyzers. The U.S. Department of Energy's Hydrogen Hub initiatives, which received $7 billion in funding in 2024, have accelerated deployment timelines for green hydrogen projects. Each gigawatt of electrolyzer capacity requires approximately 400,000 ounces of platinum, creating substantial new demand in a relatively tight market.
How Did Other Precious Metals Perform in H1 2025?
Gold's Continued Strength: 25.9% Gain
Gold maintained its position as a premier safe-haven asset, delivering a 25.9% return in the first half of 2025. The yellow metal reached multiple all-time highs, eventually surpassing $3,300 per ounce by June. Several factors contributed to gold's impressive performance:
- Intensifying geopolitical tensions, particularly in the Middle East
- Record central bank purchasing, especially from emerging markets
- Unprecedented ETF inflows totaling $38 billion (the strongest since H1 2020)
- Global trading volumes reaching a record $329 billion daily
- Ongoing de-dollarization trends following the 2022 freezing of Russian central bank assets
According to the World Gold Council's Q2 2025 Trends Report, central banks purchased more gold in the last four years than in the previous two decades combined. This extraordinary buying pace reflects growing concerns about currency stability and geopolitical risks. Emerging market central banks have been particularly active, with their gold reserves increasing by an average of 15% since 2023.
Silver's Dual-Role Advantage: 24.9% Increase
Silver closely tracked gold's performance with a nearly 25% gain in H1 2025, briefly surpassing $37 per ounce in mid-June before settling around $36. The metal's performance reflects its unique position as both:
- A precious metal benefiting from safe-haven demand
- An industrial metal with growing applications in green technology
The Solar Energy Industries Association (SEIA) reports that photovoltaic installations increased 32% year-over-year in H1 2025, driving substantial silver demand. Each gigawatt of solar capacity requires approximately 80 tons of silver, and global installations are projected to exceed 300 GW in 2025, consuming nearly 24,000 tons of silver.
Silver's relative undervaluation compared to gold (based on historical ratios) suggests potential for further appreciation if the gold rally continues. The gold–silver ratio insights ended H1 2025 at 92:1, still above the long-term average of 65:1.
Palladium's Surprising Comeback: 21.3% Rise
After several challenging quarters, palladium staged an impressive recovery with a 21.3% gain in the first half of 2025. While still underperforming platinum, palladium's rebound indicates stabilizing demand in the automotive sector and potential supply concerns from major producing regions.
S&P Global Mobility data shows global auto production stabilized in Q2 2025 after five consecutive quarterly declines, growing 3.2% compared to Q1. This production recovery, combined with stricter emissions standards in key markets, has supported palladium demand despite the ongoing transition to electric vehicles.
Russia, which accounts for approximately 40% of global palladium production, experienced logistics challenges in Q1 2025 that temporarily reduced exports. These disruptions, though largely resolved by June, created enough uncertainty to support higher prices throughout the period.
What Other Commodities Showed Strength in H1 2025?
Copper: The Industrial Standout at 16.2%
Though not a precious metal, copper deserves special attention after posting a 16.2% gain in H1 2025, making it the best-performing base metal. Copper's rally was driven by:
- Supply constraints from major producing regions
- Surging demand from AI infrastructure and data centers
- Political developments, including a surprise 50% tariff announcement on imported copper
- Long-term electrification trends supporting fundamental demand
According to LPL Research's Midyear Outlook 2025, data centers alone are projected to require 127,000 megawatts of power by 2029 (up from 82,000 in 2025), with each megawatt requiring approximately 27 metric tons of copper. This growing demand from technology infrastructure supplements traditional uses in construction, transportation, and manufacturing.
The International Copper Association (ICA) estimates that AI-related infrastructure will consume an additional 1.5 million tons of copper annually by 2030, representing about 6% of current global production. This new demand source has emerged rapidly, catching many market participants by surprise.
"The copper intensity of AI data centers is approximately three times that of traditional data centers due to higher power requirements, more complex cooling systems, and advanced connectivity needs." — International Copper Association, May 2025 Special Report
Other industrial metals showing strength included tin (+12.4%) and nickel (+8.7%), both benefiting from technology applications and battery production growth. These metals provide interesting alternatives for investors seeking exposure to the technology transition with less volatility than some precious metals.
Which Commodities Underperformed in H1 2025?
Energy Sector Struggles
While precious metals soared, energy commodities faced headwinds in the first half of 2025. Several factors contributed to this underperformance:
- OPEC+ production increases totaling 2.2 million barrels per day
- Shifting global energy consumption patterns toward renewables
- Mild winter weather reducing natural gas demand
- Regulatory changes affecting traditional energy markets
Crude oil declined 6.3% during H1 2025, while natural gas fell 9.1%. These declines occurred despite ongoing geopolitical tensions, suggesting structural changes in energy markets rather than cyclical factors. The International Energy Agency (IEA) reported that global oil demand growth slowed to 1.2% in H1 2025, down from 2.3% in 2024, primarily due to accelerating EV adoption and efficiency improvements.
Agricultural Commodities Face Challenges
Agricultural commodities also lagged behind precious metals in H1 2025, with several key crops posting negative returns. Weather patterns, trade policies, and changing consumer preferences all influenced performance in this sector.
The UN Food and Agriculture Organization (FAO) reported that global wheat prices declined 7.2% during H1 2025 due to favorable growing conditions in major producing regions and continued high exports from Russia. Corn (-5.8%) and soybeans (-3.4%) also underperformed as favorable growing conditions in Brazil and the United States suggested ample supplies.
Lithium's Continued Correction: -18.7%
Despite its critical role in the energy transition, lithium extended its correction with an 18.7% decline in H1 2025. This performance reflects:
- Softening electric vehicle demand in key markets (China EV sales grew 12% YoY in H1 2025 vs. 35% in 2024)
- Supply increases from expanded production in China and South America
- Technological developments potentially reducing lithium intensity in batteries
The International Energy Agency's Critical Minerals Market Review (May 2025) projected a lithium surplus of 200,000 tons for 2025, representing approximately 15% of global demand. This oversupply situation is expected to persist through 2026 as new production continues to come online in Chile, Argentina, and Australia.
For contrarian investors, these underperforming sectors may present opportunities in the second half of 2025, particularly if supply-demand fundamentals shift. The energy sector, in particular, remains significantly undervalued relative to historical metrics, potentially offering value if demand patterns stabilize.
What's Driving the Precious Metals Outperformance?
Central Bank Purchasing Trends
Central banks have dramatically increased their gold acquisitions in recent years, purchasing more in the last four years than in the previous two decades combined. This trend reflects growing concerns about:
- Currency debasement
- Geopolitical instability
- The need for politically neutral reserve assets
- Diversification away from traditional currency reserves
According to DSP Investment Managers' July 2025 report, emerging market central banks increased their gold reserves by an average of 15% since 2023. This accumulation accelerated following the freezing of Russian central bank assets in 2022, which created significant concerns about the security of traditional foreign exchange reserves.
"The weaponization of the dollar and euro following the Russia-Ukraine conflict has fundamentally changed how central banks view reserve asset security. Gold's appeal lies in its immunity to sanctions or digital freezing." — DSP Investment Managers, July 2025
This trend has extended beyond gold to include increased interest in platinum and silver, particularly from central banks in Asia and the Middle East seeking to diversify their precious metals holdings.
Industrial Applications in Green Technology
Both platinum and silver benefit from increasing industrial applications in renewable energy and green technologies:
- Platinum's role in hydrogen fuel cells and electrolyzers: Each gigawatt of electrolyzer capacity requires approximately 400,000 ounces of platinum
- Silver's critical function in solar panels: Global installations projected to exceed 300 GW in 2025, consuming nearly 24,000 tons of silver
- Both metals' importance in various electronic applications and industrial processes
The U.S. Department of Energy's Hydrogen Earthshot initiative aims to reduce clean hydrogen costs by 80% to $1 per kilogram by 2030, driving rapid expansion in electrolyzer deployment. This growth creates substantial new demand for platinum that was the top performing commodity in H1 2025 and was largely absent from market projections just five years ago.
Similarly, the International Renewable Energy Agency (IRENA) projects that annual solar installations will need to triple by 2030 to meet climate goals, suggesting continued strong demand growth for silver in this application.
Investment Demand Amid Global Uncertainty
Precious metals have reaffirmed their role as reliable hedges against:
- Inflation concerns
- Geopolitical tensions
- Currency fluctuations
- Financial system instability
This function has driven significant investment demand through both physical holdings and ETF inflows. Gold ETFs recorded $38 billion in inflows during H1 2025, the strongest since H1 2020, while platinum ETFs saw their holdings increase by 18.2%.
The growing appeal of precious metals as portfolio diversifiers has attracted interest from both retail and institutional investors. Several major pension funds increased their precious metals allocations during H1 2025, citing concerns about traditional fixed income and equity valuations amid economic uncertainty.
What Does This Mean for Investors?
Portfolio Diversification Considerations
The strong performance of precious metals in H1 2025 highlights their value as portfolio diversifiers. Their low correlation with traditional financial assets can help reduce overall portfolio volatility during periods of market stress.
Historical analysis shows that a 5-10% allocation to precious metals has typically improved risk-adjusted returns for balanced portfolios over full market cycles. The outperformance of platinum and other precious metals in H1 2025 reinforces this diversification benefit, particularly during periods of heightened economic uncertainty.
Investors should consider:
- Allocation percentages: Typically 5-10% of a diversified portfolio
- Exposure methods: Physical holdings, ETFs, mining stocks, or a combination
- Rebalancing discipline: Taking profits after significant price increases to maintain target allocations
Watching for Rotation Opportunities
The significant performance gap between precious metals and other commodity sectors suggests potential rotation opportunities in the second half of 2025. Underperforming sectors like energy and agriculture may present value if fundamental catalysts emerge.
Contrarian investors might consider:
- Energy equities: Trading at historically low valuations despite cash flow strength
- Agricultural commodities: Potential beneficiaries if weather patterns shift
- Lithium producers: Selective opportunities as the market begins to anticipate demand recovery
Timing such rotations can be challenging, but the extreme performance divergence suggests mean reversion potential, particularly if precious metals experience profit-taking after their strong rally.
Long-Term Structural Trends
Several long-term trends support continued interest in the commodities space:
- The ongoing energy transition requiring significant raw materials
- Infrastructure development in emerging markets
- Technology advancement driving demand for specialized metals
- Geopolitical realignments affecting global supply chains
The minerals intensity of green technologies is substantially higher than conventional alternatives. According to the International Energy Agency, a typical electric vehicle requires six times the mineral inputs of a conventional car, while an onshore wind plant requires nine times more mineral resources than a gas-fired power plant.
This materials intensity creates structural support for commodities demand that may persist regardless of short-term economic fluctuations, though with significant variations across different commodities.
How Can Investors Track Commodity Performance?
Using Commodity Performance Tables
Interactive commodity performance tables provide valuable tools for investors to visualize relative performance across different time periods. These resources help identify:
- Long-term trends and cyclical patterns
- Relative strength between commodity groups
- Historical volatility and risk characteristics
- Seasonal patterns that may influence trading strategies
U.S. Global Investors' Periodic Table of Commodities Returns offers a comprehensive visual representation of annual performance rankings, allowing investors to observe how commodities rotate through performance rankings over time. This visualization helps identify potential mean reversion opportunities and long-term trends that might not be apparent from short-term price movements alone.
Monitoring Supply-Demand Fundamentals
Beyond price performance, investors should closely monitor fundamental supply-demand dynamics:
- Production disruptions or expansions
- Inventory levels at major exchanges
- Regulatory developments affecting production or consumption
- Technological changes that may alter demand patterns
Industry-specific reports from organizations like the World Platinum Investment Council, World Gold Council, International Copper Association, and International Energy Agency provide detailed insights into these fundamental factors. These reports often include forward-looking projections that can help investors anticipate potential price movements before they manifest in market prices.
For platinum specifically, the WPIC's quarterly reports provide detailed analysis of supply, demand, and inventory changes that have proven valuable in anticipating market movements throughout the first half of 2025.
FAQ: Platinum and Precious Metals
Ready to Identify the Next Major Resource Discovery?
Discover how you can capitalise on major mineral discoveries as soon as they're announced by exploring Discovery Alert's powerful Discovery IQ model at https://discoveryalert.com.au/discoveries/, where you'll find real examples of exceptional returns from historic mineral discoveries.


