June 8, 2026
When Extreme Weather Meets Global Conflict: Australia's Gold Sector Under Pressure
Few industries expose the tension between geological abundance and operational fragility quite like gold mining. A nation can sit atop world-class ore bodies, operate some of the most technically sophisticated processing facilities on Earth, and still find its quarterly output derailed by forces entirely outside its control. Australia's gold sector demonstrated this dynamic with precision in the first quarter of 2026, when the simultaneous arrival of severe rainfall and destructive bushfires across Western Australia tested the resilience of the country's largest producing operations at exactly the same moment global gold markets were navigating one of their most volatile periods in recent memory.
Understanding what actually happened during the March 2026 quarter, and why it matters for investors tracking Australian first quarter gold output bushfires and rains as recurring risk variables, requires looking beyond the headline production figure to the mechanics of disruption, the geography of vulnerability, and the structural forces shaping gold's long-term trajectory.
When big ASX news breaks, our subscribers know first
Australia's Gold Sector: Scale, Structure, and Seasonal Vulnerability
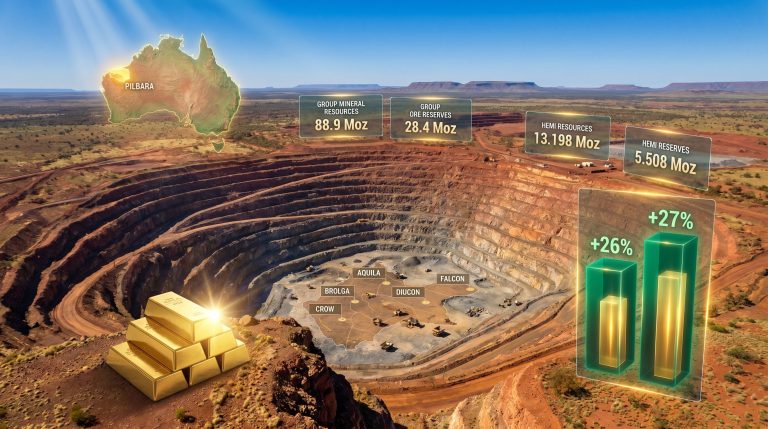
Australia consistently ranks among the world's top two or three gold-producing nations, a position built on a diversified portfolio of large-scale, low-to-medium grade open-pit operations and high-grade underground mines concentrated primarily across Western Australia, New South Wales, and the Northern Territory.
Full-year 2025 output reached 303 tonnes, confirming the country's enduring capacity to deliver substantial volumes to global markets year after year. Yet this aggregate strength can obscure a structural vulnerability that repeats with clockwork regularity: the January to March quarter is, by historical pattern, the most operationally exposed period in the Australian mining calendar.
Several converging factors explain this seasonal fragility:
- The Southern Hemisphere summer coincides directly with the peak of the tropical monsoon season, bringing sustained rainfall to the Pilbara, Kimberley, and goldfields regions of Western Australia.
- Cyclone season intensifies between January and March, with the potential for extreme precipitation events affecting access roads, pit wall stability, and ore processing throughput.
- Summer heat simultaneously elevates bushfire risk across southern and eastern regions, creating a geographic split where the north faces flooding and the south faces fire.
- Remote mine sites in Western Australia are particularly exposed because their infrastructure dependencies, including water supply pipelines, power transmission lines, and communications networks, traverse large distances through fire and flood-prone landscapes.
This combination makes Q1 a recurring vulnerability window that mine operators, production planners, and investors in Australian gold equities must treat as a built-in planning variable rather than an exceptional scenario.
Historical Q1 Disruption Patterns: A Comparative View
| Quarter | Output (Tonnes) | Primary Disruption Factor | YoY Change |
|---|---|---|---|
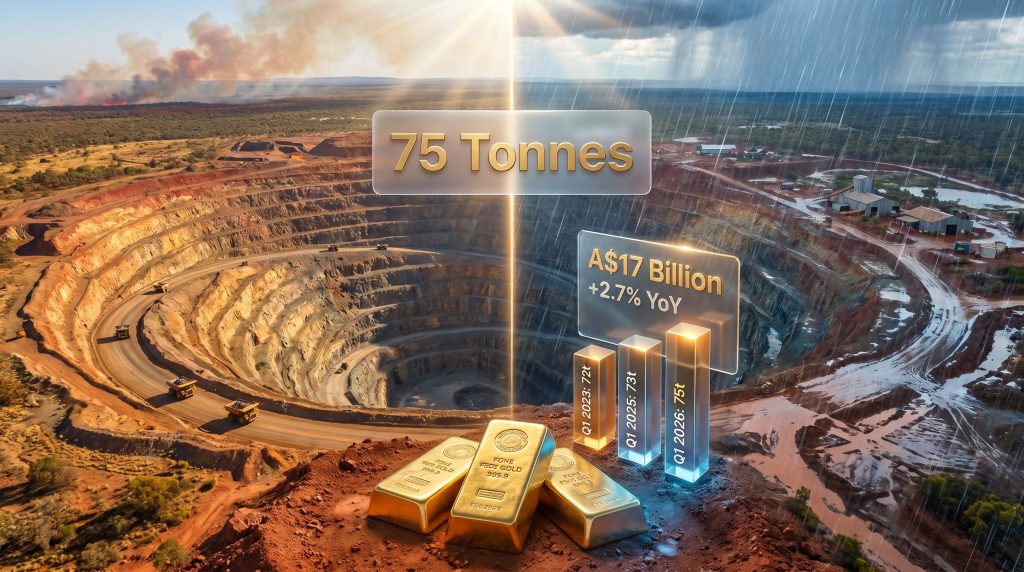
| Q1 2023 | 72 t | Cyclonic rain across WA, QLD, NSW, NT | -8% |
| Q1 2025 | 73 t | Wet season impacts | Baseline |
| Q1 2026 | 75 t | Heavy rain combined with bushfires (WA) | +2.7% |
The pattern is consistent: Q1 reliably underperforms relative to Q3 and Q4 in most years, with the degree of shortfall determined by the severity of seasonal conditions rather than any structural weakness in the underlying resource base. Indeed, rain hampers Australian gold production in a manner well documented across multiple reporting periods, reinforcing this as a systemic rather than isolated challenge.
The Dual Disruption Mechanism: How Rain and Fire Operate Differently
What made Q1 2026 operationally distinctive was not simply the presence of adverse weather, but the layering of two fundamentally different disruption types that carry very different recovery timelines and infrastructure implications.
Rainfall Disruption: Temporary but Operationally Costly
Heavy rainfall disrupts open-pit gold mining operations primarily through three mechanisms:
- Pit accessibility, where sustained rain saturates haul roads and pit ramps, rendering heavy equipment movement unsafe or impossible.
- Ore processing interruptions, where dilution of ore stockpiles and water management challenges reduce throughput at processing plants.
- Ground stability concerns, where wet conditions in open-cut environments can destabilise pit walls, requiring temporary work stoppages for geotechnical assessment.
The Gruyere production forecast had anticipated challenges, and indeed Gold Fields' wholly-owned Gruyere mine, located in the remote northeastern goldfields of Western Australia, recorded output 20,200 oz lower than the December 2025 quarter as a direct consequence of these conditions. Newmont's Tanami operation in the Northern Territory experienced an even steeper decline, with output falling by approximately 41,000 oz, making it the hardest-hit single asset during the reporting period.
Critically, rainfall disruptions are largely self-resolving. Once weather conditions normalise, mine access is restored, stockpiles dry out, and production typically rebounds within one to two quarters. This time-limited nature means rainfall impacts, while materially significant in-quarter, rarely create lasting structural production deficits.
Bushfire Infrastructure Damage: A Multi-Quarter Recovery Challenge
Bushfire damage operates on an entirely different timeline. It is worth emphasising that Australian bushfires in mining regions are large-scale forest fires, not minor brush events. They are capable of incinerating substantial infrastructure over vast geographic areas, with flame fronts that can travel many kilometres in hours under extreme conditions.
At Newmont's Boddington mine, fires that struck in December 2025 severed water supply infrastructure, damaged electricity supply systems, and disabled communications networks essential for safe mine operation. By early 2026, Boddington was still operating at reduced capacity, recording output approximately 35,000 oz lower than the December 2025 quarter. The Telfer extension plans at nearby operations further highlight how infrastructure vulnerability across the Western Australian goldfields is a recurring consideration for producers in the region.
The distinction between rainfall and bushfire disruption is critical for production forecasting: rainfall pauses output, while bushfire damage impairs capacity. One is a pause; the other is a reduction that persists until physical infrastructure is physically rebuilt.
The repair of water pipelines, electrical infrastructure, and communications systems across remote Western Australian terrain involves significant logistical complexity and extended lead times for materials, labour mobilisation, and regulatory clearances before full operational restoration can occur.
Mine-by-Mine Production Results: Winners and Losers in Q1 2026
Despite the disruptions at three of Australia's largest operations, the sector's aggregate output of 75 tonnes exceeded the prior year's Q1 figure of 73 tonnes, pointing to genuine underlying production strength at operations that were less directly exposed to the weather and fire impacts.
Top Five Producing Operations: March Quarter 2026
| Rank | Mine | Operator | Q1 2026 Output |
|---|---|---|---|
| 1 | KCGM Super Pit | Northern Star Resources | 120,000 oz |
| 2 | Boddington | Newmont Corporation | 111,000 oz |
| 3 | Tropicana | AngloGold Ashanti / Regis Resources | 109,000 oz |
| 4 | Cadia | Newmont Corporation | 94,000 oz |
| 5 | St Ives | Gold Fields | 83,700 oz |
Northern Star's Kalgoorlie Super Pit retained its position as Australia's single largest gold-producing operation, adding 12,500 oz quarter-on-quarter to further consolidate that ranking. The Super Pit's combination of large open-pit scale, established infrastructure redundancy, and location in the relatively drier southern goldfields contributed to its resilience during the quarter.
Operations that recorded meaningful production gains included:
- Gold Fields' Granny Smith mine, which added 19,600 oz of incremental output quarter-on-quarter.
- Newmont's Cadia mine in New South Wales, which contributed an additional 13,000 oz relative to the prior period.
- Northern Star's KCGM Super Pit, with a quarter-on-quarter increase of 12,500 oz.
The divergence between mines that gained and those that lost production reflects the highly localised geography of both rainfall and bushfire events. Infrastructure redundancy, site design, and geographic positioning within Western Australia can determine whether an operation is materially affected or largely insulated from the same broad weather system. This localisation effect is a frequently underappreciated aspect of Australian gold sector risk analysis.
The Resilience Calculation
A useful way to contextualise the Q1 2026 result is to estimate what total output might have been without the disruptions. The three most affected operations, Boddington, Tanami, and Gruyere, collectively recorded losses of approximately 96,200 oz relative to their prior-quarter performance.
Had these mines operated at their December 2025 rates, total Q1 output could plausibly have reached 78 to 79 tonnes, placing the actual result around 3 to 4 tonnes below undisrupted potential. The fact that the sector still delivered 75 tonnes despite this concentrated disruption is, by the assessment of industry specialists, a result that came in better than many had anticipated given the severity of conditions encountered.
Gold Price Volatility in Q1 2026: A Compounding Layer of Uncertainty
The production story in Q1 2026 unfolded against a gold price backdrop that was simultaneously historically elevated and extraordinarily volatile, creating a complex revenue environment for Australian producers. Indeed, the broader context of gold price records set in preceding periods made this volatility even more striking for market participants.
The Record High and Its Rapid Reversal
Gold reached an all-time record high of $5,595/oz in late January 2026, a level that would have generated extraordinary revenue outcomes had it been sustained. Within just four trading days, however, prices had retreated sharply to $4,392/oz, a decline of more than $1,200/oz representing one of the fastest large corrections in recent gold market history.
This kind of intra-quarter price swing creates significant operational complexity for producers managing forward sales programmes, hedging positions, and quarterly revenue guidance, particularly when the price movement coincides with a period of already-disrupted physical production.
The US-Iran War and Its Market Transmission Mechanism
The second major price shock of the quarter originated from a geopolitical event rather than commodity-specific fundamentals. On 28 February 2026, the outbreak of the US-Iran war triggered the closure of the Strait of Hormuz, the critical maritime chokepoint through which a substantial portion of global oil trade flows. The immediate consequence was a sharp oil supply shock and a rapid escalation in energy prices.
The transmission mechanism from this event to gold prices followed a well-documented but often counterintuitive pathway:
- World equity markets declined sharply in response to the geopolitical escalation and oil price surge.
- Financial institutions facing portfolio losses sold gold alongside other liquid assets to raise cash and offset drawdowns.
- This institutional selling pressure drove gold prices lower, triggering a cascade of margin calls and stop-loss orders that amplified the downward move well beyond what fundamental gold demand would have warranted.
- Sovereign-level selling added further pressure, with Türkiye executing substantial gold sales or swap arrangements from its national reserves as part of currency defence operations, and Russia liquidating portions of its gold holdings to generate foreign exchange.
By 23 March 2026, gold had fallen to $4,098/oz, representing a decline of nearly $1,500/oz from the January peak in under two months.
Gold Price Snapshot: Q1 2026 in Context
| Reference Point | Gold Price (USD/oz) |
|---|---|
| Late January 2026 peak (all-time high) | $5,595 |
| January low (4 trading days later) | $4,392 |
| March 23, 2026 trough | $4,098 |
| Early June 2026 | ~$4,440 |
| One year prior (early June 2025) | ~$3,340 |
Despite the dramatic intra-quarter volatility, the average gold price across the March 2026 quarter remained sufficiently elevated to place the total value of Australia's 75-tonne output at approximately A$17 billion, according to estimates from Surbiton Associates, a specialist gold consultancy. On a year-on-year basis, gold was still trading approximately 32.9% higher in early June 2026 than at the equivalent point one year earlier.
The critical insight for investors is that short-term price volatility driven by institutional liquidation and sovereign selling does not necessarily invalidate the structural bull case for gold. The same uncertainty that triggers selling in the short term, encompassing geopolitical risk, currency instability, and sovereign debt concerns, continues to underpin the long-term demand thesis.
Structural Risk Implications for Australian Gold Producers
Climate Risk as a Permanent Planning Variable
The Q1 2026 result reinforces a pattern that has become increasingly difficult to dismiss as coincidental. Australian first quarter gold output bushfires and rains represent a structurally exposed recurring disruption window each January to March period, and the risk profile of that window is evolving. The traditional wet-season disruption model is now layered with elevated bushfire frequency and intensity, particularly across southwestern and southern Western Australia, creating a compound risk scenario that demands more sophisticated operational planning than was required even five years ago.
The specific infrastructure vulnerabilities exposed at Boddington, including water supply pipelines, electrical networks, and communications systems, point toward a clear capital allocation priority for operations in fire-prone regions: infrastructure hardening and redundancy investment. Mines that have invested in alternative water sourcing, distributed power supply, and satellite-based communications are demonstrably better positioned to maintain production continuity through fire events than those relying on single-point infrastructure.
What the Production Divergence Tells Investors
The performance gap between operations that gained output and those that lost it during Q1 2026 carries an important message for equity investors in Australian gold producers. Geographic diversification across an operator's asset portfolio matters enormously during seasonal disruption events. Furthermore, operators with mines spread across different climate zones and infrastructure configurations are better insulated against correlated Q1 production shortfalls than those concentrated in a single region.
The total estimated combined output shortfall of approximately 96,200 oz across the three most affected operations also illustrates the scale of revenue impact that bushfire and rain disruptions can generate even within a single quarter. At an average quarterly gold price of around $4,400/oz, that volume shortfall translates to a revenue impact in the order of $420 million across the affected operators, a figure material enough to influence quarterly earnings outcomes.
Long-Term Production Fundamentals Remain Intact
Despite the near-term disruptions, Australia's structural position in global gold markets remains robust. Annual production capacity above 300 tonnes per year, combined with ongoing capital investment at flagship operations including the KCGM Super Pit expansion, Cadia's underground development, and Tropicana's ongoing optimisation programme, suggests that medium-term production growth remains achievable.
The gold price outlook for Australian producers continues to attract significant investor attention, particularly given the macroeconomic environment characterised by persistent geopolitical tension, elevated sovereign debt levels across major economies, and ongoing currency instability in emerging markets. In addition, gold safe-haven demand continues to provide a constructive backdrop for prices despite the short-term volatility witnessed in early 2026. The long-term fundamentals underpinning gold's multi-year appreciation cycle remain broadly intact, even as individual quarters are shaped by forces as unpredictable as fire, flood, and armed conflict.
The next major ASX story will hit our subscribers first
Frequently Asked Questions: Australian Gold Output and Seasonal Disruptions
What Was Australia's Total Gold Output in Q1 2026?
Australia produced 75 tonnes of gold in the quarter ended March 31, 2026. This result was shaped by heavy rainfall disruptions at Gruyere and Tanami, and by ongoing bushfire-related infrastructure damage at Boddington, yet still exceeded the 73 tonnes recorded in the same quarter of 2025.
How Much Was Australia's Q1 2026 Gold Output Worth?
Based on the average gold price during the quarter, Australia's 75-tonne output was valued at approximately A$17 billion, according to Surbiton Associates estimates.
Which Mine Suffered the Largest Output Decline in Q1 2026?
Newmont's Tanami operation recorded the steepest single-mine decline, with output falling approximately 41,000 oz due to weather-related disruptions during the quarter.
Why Did Bushfires Cause Longer-Lasting Disruption Than Rainfall?
Bushfires caused direct physical damage to mine infrastructure at Newmont's Boddington operation, affecting water supply systems, electrical networks, and communications. Unlike rainfall disruptions, which resolve once conditions improve, infrastructure damage requires active physical repair and restoration, extending the production impact well beyond the quarter in which the fire occurred.
What Is Australia's Annual Gold Production Capacity?
Australia produced 303 tonnes of gold across the full calendar year 2025, maintaining its position among the world's largest gold-producing nations.
How Did the US-Iran War Affect Gold Prices in Early 2026?
The outbreak of conflict on 28 February 2026 triggered an oil supply shock through the closure of the Strait of Hormuz, causing sharp equity market declines. Financial institutions sold gold to offset portfolio losses, driving prices from above $4,400/oz to a quarterly low of $4,098/oz by late March 2026, with the decline further amplified by margin calls, stop-loss order execution, and sovereign gold selling by Türkiye and Russia.
How Do Australian First Quarter Gold Output Bushfires and Rains Compare Historically?
The Q1 disruption pattern is consistent across multiple years. For instance, Q1 2023 recorded 72 tonnes following cyclonic rainfall across multiple states, while Q1 2026's 75-tonne result, achieved despite compound fire and flood disruption, demonstrates a degree of sectoral resilience that many analysts regard as genuinely encouraging.
Disclaimer: This article contains forward-looking statements, production estimates, and gold price forecasts that involve inherent uncertainty. Past production performance and price trajectories are not reliable indicators of future outcomes. Readers should conduct independent research before making any investment decisions related to gold producers or commodity markets.
Want to Capitalise on the Next Major ASX Gold Discovery Before the Market Moves?
Discovery Alert's proprietary Discovery IQ model delivers real-time alerts the moment significant mineral discoveries hit the ASX, cutting through complex data to surface actionable opportunities in gold and beyond — explore historic discovery returns on the Discovery Alert discoveries page to see what early positioning can mean, then start your 14-day free trial at Discovery Alert to ensure you're ahead of the next major find.