
June 25, 2026
Reading China's Gold Appetite Through a Flawed Window
Physical gold markets operate on a logic that defies simple headline interpretation. When monthly import figures dip sharply, the instinct is to read weakness into the data. But in the world of sovereign bullion flows, a drop in one channel frequently masks acceleration in another. Understanding why China gold imports via Hong Kong fell 38% in May 2026 requires looking beyond the Hong Kong Census and Statistics Department numbers and into the architecture of how the world's largest gold consumer actually sources its metal.
When big ASX news breaks, our subscribers know first
China's Multi-Channel Gold Import Framework
Most commodity markets operate through a single, dominant clearing point. Gold flowing into China does not. The country operates a layered import system that spans multiple entry points, each governed by different regulatory licences, quota allocations, and institutional participants.
Hong Kong has historically served as the most visible of these channels, largely because its trade statistics are published regularly and are accessible to international analysts. However, gold also enters China's gold market directly through Shanghai, where the Shanghai Gold Exchange operates as the country's primary domestic bullion trading venue, and through Beijing, where certain state-owned financial institutions hold direct import authorisation from the People's Bank of China (PBoC).
Gross vs. Net Imports: A Critical Distinction
When analysts reference Hong Kong gold import data, two figures are typically cited:
- Gross imports represent the total physical gold shipped from Hong Kong into mainland China.
- Net imports subtract re-exports, meaning gold that transited through Hong Kong but was shipped back out to other destinations.
A decline in net import figures does not necessarily indicate weakening demand. It may reflect a rebalancing of sourcing channels, a drawdown of previously accumulated inventory, or a shift toward direct import routes that bypass Hong Kong entirely.
This distinction is critical for investors and analysts attempting to gauge China's true appetite for bullion at any given moment.
What the May 2026 Hong Kong Data Actually Shows
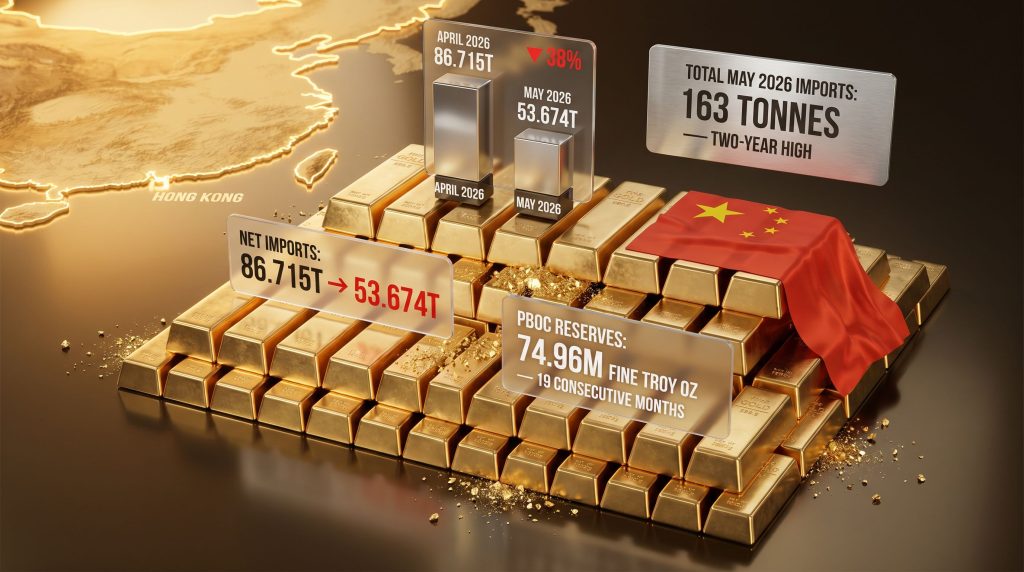
The headline figure published by the Hong Kong Census and Statistics Department on June 25, 2026 confirmed that China's net gold imports via Hong Kong reached 53.674 metric tonnes in May, down from 86.715 tonnes in April. That represents a month-on-month contraction of approximately 38%. Gross import volumes registered a similarly sharp decline, falling from 99.327 tonnes to 65.562 tonnes, a drop of roughly 34%.
| Metric | April 2026 | May 2026 | Monthly Change |
|---|---|---|---|
| Gross Gold Imports via Hong Kong | 99.327 tonnes | 65.562 tonnes | ▼ ~34% |
| Net Gold Imports via Hong Kong | 86.715 tonnes | 53.674 tonnes | ▼ ~38% |
| PBoC Gold Reserves | 74.64M fine troy oz | 74.96M fine troy oz | ▲ +0.32M oz |
Viewed in isolation, a 38% single-month decline sounds alarming. Viewed within the historical pattern of Hong Kong-routed gold flows, however, it is far less unusual.
| Period | Net Import Decline (MoM) | Context |
|---|---|---|
| August 2025 | ▼ 39% | Post-summer demand softening |
| October 2025 | ▼ 64% | Seasonal and policy-driven pullback |
| December 2025 | ▼ 24% | Year-end inventory adjustments |
| May 2026 | ▼ 38% | Channel diversification and prior-month saturation |
The October 2025 decline of 64% dwarfs May 2026's contraction, yet global gold markets did not interpret that as a structural retreat from Chinese demand. The same interpretive caution applies here.
Why a Dip in One Channel Can Coincide With a Two-Year High in Total Imports
The most counterintuitive element of the May 2026 data is that while Hong Kong-routed imports fell sharply, China's total gold imports across all channels reportedly reached approximately 163 tonnes in May, which would represent one of the highest monthly totals in more than two years.
This apparent contradiction resolves when the mechanics of Chinese import sourcing are understood. UBS analysts observed that when direct import volumes into mainland China run particularly hot in preceding months, the pipeline through Hong Kong naturally compresses. Importers with sufficient inventory accumulated through direct channels simply have less need to activate the Hong Kong route simultaneously.
This dynamic, sometimes described in commodity market circles as prior-month saturation, is a recognised feature of how large physical gold consumers manage procurement. It is inventory management, not demand destruction.
Why This Matters for Market Participants
For institutional investors and physical gold market participants, the distinction between channel-level data and total demand is material. Misreading a Hong Kong-specific decline as a China-wide demand pullback has historically created short-lived pricing dislocations that informed buyers have used to advantage. Furthermore, in physical gold markets, price dips triggered by misread import data have frequently attracted accelerated retail and institutional buying from Chinese consumers, a pattern well-documented across multiple demand cycles.
The PBoC's Uninterrupted Reserve Accumulation
Separate from commercial import channels, the People's Bank of China continued its sustained programme of official gold reserve additions in May 2026. The central bank's holdings rose from 74.64 million fine troy ounces to 74.96 million fine troy ounces by the end of the month, marking the 19th consecutive monthly increase in official reserves.
The PBoC's sustained reserve accumulation reflects a long-term reserve diversification mandate that operates on an entirely different logic from short-term commercial import volumes. These are parallel systems, not competing signals.
This streak of uninterrupted additions spans more than a year and a half. Consequently, it positions China among the most active sovereign gold accumulators globally alongside Poland, India, and several other central banks. The broader pattern of central bank gold demand has meaningfully increased gold's share of foreign reserve portfolios worldwide.
Why Central Bank and Commercial Gold Flows Operate Differently
Central bank gold purchases are not executed through the same commercial import channels tracked by Hong Kong trade statistics. The PBoC sources gold through a combination of domestic mine production purchase agreements, international over-the-counter transactions with bullion banks, and direct purchases from state-owned entities. These flows do not necessarily register in Hong Kong Census data, meaning the 38% decline in Hong Kong-routed imports carries zero direct implication for PBoC acquisition pace.
The two data series should therefore be read as complementary, not as a unified demand signal. For a broader perspective on gold and central banks, the institutional motivations extend well beyond any single monthly data point.
Hong Kong's Infrastructure Play: Positioning for a Larger Role
Against the backdrop of shifting physical flow patterns, Hong Kong's financial infrastructure is actively repositioning. The Hong Kong Futures Exchange (HKFE) announced in late May 2026 that it would introduce a market-wide trading fee discount and liquidity incentive programme specifically targeting gold futures contracts. The initiative is designed to deepen liquidity in Hong Kong's gold derivatives market and attract greater participation from international and regional traders.
A new gold futures clearing system is scheduled to launch in July 2026, which analysts expect to improve settlement efficiency and reduce counterparty friction for participants seeking to manage gold price exposure through Hong Kong rather than Singapore or Shanghai.
How Hong Kong Compares to Regional Gold Hubs
| Market | Primary Gold Venue | Clearing Mechanism | Key Advantage |
|---|---|---|---|
| Shanghai | Shanghai Gold Exchange | CNY-denominated settlement | Mainland access, deepest physical liquidity |
| Hong Kong | HKFE Gold Futures | USD and HKD clearing | International accessibility, regulatory familiarity |
| Singapore | Singapore Exchange | USD settlement | Neutral jurisdiction, growing vault infrastructure |
Hong Kong's July 2026 clearing upgrade is intended to narrow the gap with Shanghai's operational depth while preserving the international accessibility that makes it attractive to non-mainland participants. Whether this translates into meaningfully higher gold futures volumes remains a question that the second half of 2026 will begin to answer.
The next major ASX story will hit our subscribers first
Gold Prices and the $4,000 Psychological Threshold
Macro forces compounded the import data narrative in late June 2026. Gold spot prices fell below $4,000 per troy ounce for the first time since November 2025, pressured by a strengthening US dollar and revised expectations around the trajectory of Federal Reserve interest rate policy.
The relationship between dollar strength and gold prices follows a well-established inverse dynamic. As the dollar appreciates, gold becomes more expensive in other currencies, reducing purchasing power for non-US buyers. Simultaneously, expectations of higher US interest rates elevate the opportunity cost of holding a non-yielding asset, incentivising a rotation away from gold into yield-bearing instruments.
Gold's retreat below $4,000 per ounce reflects compounding macro pressures, not a fundamental reassessment of its role in reserve diversification or portfolio protection. For Chinese physical buyers, historical patterns suggest price corrections of this nature accelerate retail demand rather than suppress it.
Bank of America analysts noted in late June 2026 that the gold price selloff had created an entry opportunity for investors, with the bank maintaining a constructive long-term gold price outlook. This perspective underscores a broader institutional view that the macro drivers underpinning gold's multi-year appreciation cycle remain structurally intact.
ETF Flows vs. Physical Demand: Reading the Divergence
An important nuance within China's gold market in 2026 has been the divergence between financial and physical demand signals. Reports from earlier in the year indicated outflows from Chinese gold ETF products, which superficially suggested cooling investor sentiment. In contrast, gold ETF flows at the global level have told a markedly different story, with international inflows remaining robust.
ETF redemptions in China's domestic market have historically coincided with rotation into physical bullion holdings, particularly during periods of price consolidation. This divergence between paper and physical gold demand is a pattern experienced investors in the Chinese market have navigated across multiple cycles, reflecting a structural preference among Chinese retail and institutional investors for tangible metal over financial proxies during periods of macro uncertainty.
Frequently Asked Questions
Why do China's gold imports flow through Hong Kong?
Hong Kong functions as a regulated, transparent transit point with established bullion banking infrastructure and proximity to mainland China. Historically, many international gold suppliers and bullion banks used Hong Kong as an efficient gateway before direct import licences became more broadly available to mainland institutions.
Does a decline in Hong Kong gold imports mean China is buying less gold overall?
Not necessarily. China imports gold through multiple channels including direct routes via Shanghai and Beijing. A contraction in Hong Kong-routed volumes may reflect activity shifting to direct import channels rather than any reduction in overall Chinese gold demand.
How does the PBoC's reserve buying relate to commercial import data?
These are distinct processes. PBoC reserve additions are conducted through official channels and do not necessarily appear in Hong Kong or commercial trade statistics. The two data series measure different aspects of China's relationship with gold.
What is driving gold prices below $4,000 per ounce?
The primary pressures in late June 2026 were a stronger US dollar and revised expectations around US interest rate policy. Both factors increase the opportunity cost of holding gold and reduce its appeal relative to yield-bearing dollar assets.
Key Takeaways
- China gold imports via Hong Kong fell 38%, with net volumes declining from 86.715 tonnes in April 2026 to 53.674 tonnes in May 2026
- Gross imports via Hong Kong contracted by roughly 34%, from 99.327 tonnes to 65.562 tonnes over the same period
- The decline reflects channel diversification and prior-month inventory saturation, not a structural weakening of Chinese gold demand
- China's total gold imports across all channels reached approximately 163 tonnes in May 2026, near a two-year high
- The PBoC extended its gold reserve accumulation streak to 19 consecutive months, reaching 74.96 million fine troy ounces by end-May 2026
- Gold spot prices fell below $4,000 per troy ounce for the first time since November 2025, driven by dollar strength and interest rate expectations
- The Hong Kong Futures Exchange is launching a new clearing system in July 2026 alongside trading fee incentive programmes designed to deepen gold futures liquidity
This article is for informational purposes only and does not constitute financial advice. Commodity price forecasts, import volume projections, and central bank reserve estimates involve inherent uncertainty. Readers should conduct independent research before making any investment decisions.
Want To Stay Ahead of the Next Major Mineral Discovery on the ASX?
Discovery Alert's proprietary Discovery IQ model delivers real-time alerts on significant ASX mineral discoveries, transforming complex commodity data across more than 30 resources into a single, actionable gold-equivalent metric — giving investors a decisive edge the moment opportunities emerge. Explore historic discoveries and their exceptional returns, then start your 14-day free trial at Discovery Alert to position yourself ahead of the broader market.