
July 25, 2026
The Architecture of China's Gold Accumulation Strategy
Physical gold markets operate on a fundamental tension between visible data and hidden flows. For decades, analysts tracking Chinese bullion demand have relied on a single, imperfect transparency window: the monthly trade statistics published by the Hong Kong Census and Statistics Department. While incomplete by design, this dataset reveals something far more significant than raw tonnage figures. It exposes the structural intent behind one of the world's most consequential commodity accumulation programmes.
Understanding why China gold imports via Hong Kong rise with such consistency requires moving beyond headline numbers and into the mechanics of how gold actually moves from global refineries into Chinese vaults, central bank reserves, and retail investment channels.
When big ASX news breaks, our subscribers know first
The Hong Kong Gold Corridor: Function, Flow, and Limitations
Why Hong Kong Remains the Primary Analytical Lens
Hong Kong's role as a gold transit hub predates mainland China's current import infrastructure by several decades. As one of Asia's most liquid financial centres with deep relationships with Swiss refineries, London bullion dealers, and Australian producers, Hong Kong developed the logistics, bonded storage, and customs clearance systems that mainland importers came to rely upon.
Commercial banks holding import licences issued by the People's Bank of China (PBOC) typically route purchases through Hong Kong's well-established clearing systems before physical metal crosses into Shenzhen or other border points. This routing creates a measurable, if partial, paper trail.
Gross vs. Net: The Distinction That Changes Everything
A critical and frequently misunderstood aspect of Hong Kong import data is the difference between gross and net figures:
- Gross imports represent all gold physically shipped from Hong Kong into mainland China during a given month.
- Net imports subtract any gold re-exported from the mainland back through Hong Kong, providing a cleaner estimate of actual Chinese absorption.
Net figures are generally preferred by analysts precisely because they filter out transit volumes that do not represent new Chinese demand. When these two figures diverge significantly, it can signal changes in how Chinese entities are managing their bullion inventories or re-exporting refined material to other markets.
The Shanghai and Beijing Blind Spot
Hong Kong trade statistics represent only a partial view of China's total gold absorption. Mainland imports also flow through Shanghai and Beijing customs channels, meaning aggregate Chinese demand consistently exceeds what Hong Kong data alone captures.
This structural gap means analysts routinely undercount China's true gold intake when relying solely on Hong Kong figures. The World Gold Council and other industry bodies attempt to reconcile this through supplementary data, but no single, comprehensive monthly import figure exists for mainland China as a whole.
April's Import Surge in Context: Numbers That Demand Attention
A Snapshot of the April Data
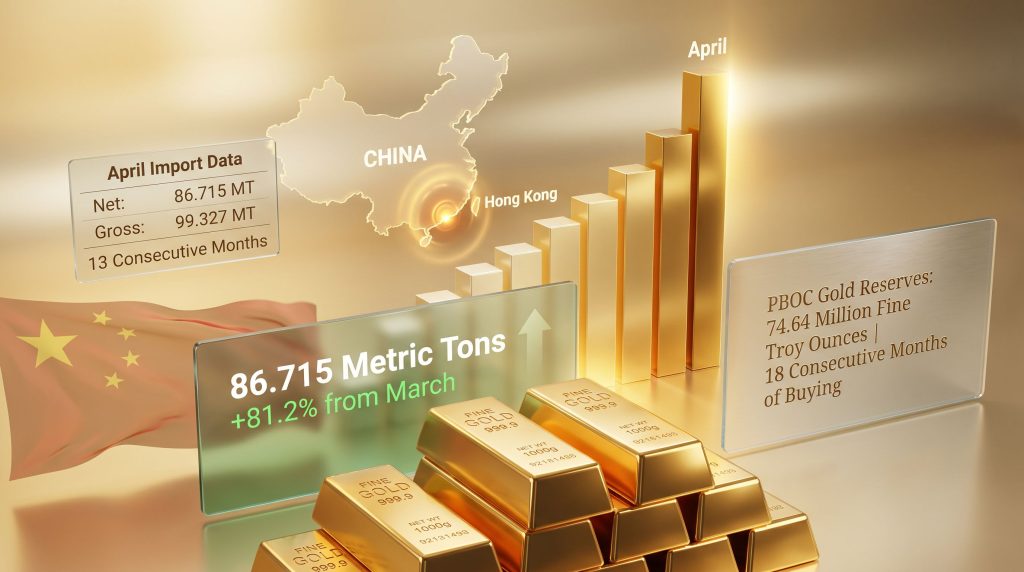
April's Hong Kong-to-mainland gold flow figures were among the most striking of recent years. Net imports reached 86.715 metric tons, an 81.2% increase over March's 47.866 tons. Gross imports also climbed materially, rising 24.8% to 99.327 tons from March's 79.576 tons.
Crucially, this marked the 13th consecutive month of net import growth, a streak that removes any possibility of interpreting the trend as a short-term anomaly. Furthermore, according to Reuters, November 2025 figures showed net imports more than doubled compared to October, reinforcing the broader structural momentum behind this trend.
Key Metrics: March vs. April Comparison
| Metric | March Figure | April Figure | Month-on-Month Change |
|---|---|---|---|
| Net Gold Imports (metric tons) | 47.866 | 86.715 | +81.2% |
| Gross Gold Imports (metric tons) | 79.576 | 99.327 | +24.8% |
| Consecutive Monthly Net Import Increases | 12 | 13 | Ongoing |
What 13 Consecutive Monthly Increases Actually Signals
A single-month spike in gold imports can be explained by quota timing, seasonal demand, or a temporary arbitrage opportunity between domestic and international gold prices. Thirteen consecutive monthly increases, however, cannot. This sustained trajectory points toward something more deliberate: a systemic reallocation of national and institutional wealth toward physical gold as a strategic asset class.
This distinction between cyclical and structural demand is critical for market participants. Cyclical surges tend to self-correct as inventories normalise. Structural demand shifts, by contrast, establish new floor levels for ongoing absorption.
Mapping the Historical Surge Pattern
Major Monthly Acceleration Points: 2024 to 2026
China's gold appetite through the Hong Kong corridor has not been uniformly smooth. It has instead been characterised by periodic acceleration events punctuated by quieter consolidation months. In addition, Kitco reported that Chinese gold imports via Hong Kong nearly tripled to 435 tonnes in April, with premiums rising — a further indicator of intensifying domestic demand pressure.
Historical Monthly Surge Timeline
| Reporting Period | Net Imports (metric tons) | Month-on-Month Change | Primary Demand Context |
|---|---|---|---|
| July 2024 | ~25.66 to 43.92* | +17% to +126.8%* | Banking sector demand, quota renewals |
| April 2025 | 86.715 | +81.2% | Physical investment demand, hedging |
| November 2025 | Not disclosed | +101.5% | Physical accumulation, year-end restocking |
| January 2026 | 20.585 | +68.7% | Chinese New Year seasonal demand |
Variance reflects differing gross vs. net methodologies across data sources.
Why Data Discrepancies Appear Across Sources
Discrepancies in reported figures for the same reporting period, such as the July 2024 variance shown above, are not errors. They reflect fundamentally different measurement approaches:
- Some sources use gross import figures while others use net.
- Preliminary data is frequently revised as customs declarations are reconciled.
- Re-export volumes can fluctuate significantly month to month, altering net calculations retroactively.
- Different organisations apply different gold purity conversion standards when expressing tonnage.
Analysts and investors should always verify whether a cited import figure is gross or net before drawing any market conclusions.
The Four Demand Drivers Behind China's Sustained Gold Appetite
Central Bank Accumulation: The Institutional Floor
The PBOC extended its gold buying programme to 18 consecutive months as of April, with official reserves reaching 74.64 million fine troy ounces, up from 74.38 million the prior month. This institutional buying programme functions as a de facto demand floor, ensuring that a baseline level of gold absorption occurs regardless of price levels or retail market sentiment. Central bank gold demand of this scale has proven to be a dominant structural force in shaping the broader market.
Central bank buying of this consistency and scale signals a deliberate portfolio diversification strategy away from US dollar-denominated reserve assets. This is particularly significant in a period when geopolitical fragmentation is accelerating and the weaponisation of financial infrastructure has become a credible policy risk. Consequently, understanding central banks influencing gold prices has become essential for any serious market participant.
Currency Hedging and Domestic Investment Demand
Persistent depreciation pressure on the Chinese yuan has elevated gold's attractiveness as a domestic wealth preservation tool. Physical gold ETFs listed on Chinese exchanges have recorded sustained inflows, while demand for small-denomination gold bars and coins has grown among retail investors who view bullion as both an inflation hedge and a portable store of value outside the formal financial system.
This retail layer of demand is often underappreciated by Western analysts focused primarily on institutional and central bank flows. Furthermore, the gold safe-haven dynamics at play in 2025 have only amplified this consumer-level appetite for physical metal.
Banking Sector Import Quotas and Timing Effects
Commercial banks holding PBOC-issued import licences have historically front-loaded purchases ahead of anticipated quota renewal periods. This institutional timing behaviour can create artificial monthly spikes that overstate underlying demand in peak months while understating it in trough months. Stripping out this quota-driven volatility from the 13-month trend, however, leaves a still-substantial upward trajectory intact.
Seasonal Demand Cycles
Gold demand in China follows well-established seasonal patterns:
- January to February: Chinese New Year gift-giving and jewellery purchases drive elevated retail demand.
- Q3 restocking: Manufacturers and wholesalers rebuild inventory ahead of the Q4 festive and wedding season.
- Q4 accumulation: Year-end institutional portfolio rebalancing and consumer gifting sustain elevated import volumes.
April does not fall within the traditional peak season, making the 81.2% surge in net imports particularly noteworthy. Non-seasonal acceleration suggests demand drivers beyond cultural cycles are at work.
China's Gold Buying Power and Its Effect on Global Bullion Markets
Scale That Cannot Be Ignored
China consistently ranks as the world's largest gold consumer by volume, competing closely with India in annual totals. Together, these two nations represent a dominant share of global physical gold absorption. When China gold imports via Hong Kong rise as sharply as they did in April, the ripple effects on available above-ground supply and refinery order books are immediate.
Swiss refineries, which process a large share of gold destined for Asian markets by recasting large London Good Delivery bars into the smaller kilogram and tael formats preferred by Chinese buyers, have at various points reported extended delivery lead times during periods of elevated Chinese demand.
The Price Paradox: Strong Demand Meeting Macro Headwinds
One of the more complex dynamics in the current gold market is the coexistence of robust Chinese physical demand with spot price pressure from macro forces. Spot gold has faced headwinds stemming from elevated inflation expectations and upward revisions to interest rate projections — conditions linked in part to energy market disruptions following the effective closure of the Strait of Hormuz, which has pushed Brent crude prices sharply higher.
In conventional market logic, surging Chinese imports should translate directly into higher spot prices. The reality, however, is more nuanced:
- Physical demand supports gold's floor but does not override the directional influence of real interest rate expectations.
- A rising rate environment increases the opportunity cost of holding non-yielding assets like gold.
- USD strength, often correlated with rate hike cycles, creates additional price suppression by making dollar-denominated gold more expensive for non-USD buyers.
This creates a market environment where Chinese institutions are effectively acquiring gold at prices suppressed by Western macro forces — a dynamic that represents either a transfer of value at favourable entry points or a convergence trade that resolves when rate expectations normalise.
The next major ASX story will hit our subscribers first
The Evolving Relevance of the Hong Kong Channel
Direct Import Infrastructure Is Expanding
Over the past decade, mainland China has invested significantly in building out its own direct import infrastructure, including the Shanghai Gold Exchange's international board, which allows foreign institutions to deliver gold directly into the Chinese market. As this infrastructure matures, a growing share of Chinese gold imports bypasses Hong Kong entirely.
This gradual decentralisation means that Hong Kong's share of total Chinese gold import volumes is likely declining as a percentage over time, even as absolute volumes through the corridor remain large. These broader gold market central bank trends point toward a continued reshaping of how gold flows into the world's largest consuming nation.
Why Hong Kong Data Remains Indispensable
Despite its limitations, Hong Kong trade data retains its status as the most widely cited and consistently available proxy for tracking Chinese gold demand because:
- It is published monthly by an independent statistical authority with no commercial interest in the data.
- It has a long, uninterrupted historical record enabling trend analysis across multiple market cycles.
- The gross and net distinction provides a built-in analytical filter unavailable in many other datasets.
- It captures activity from commercial banks and institutional importers whose behaviour is a leading indicator of anticipated demand conditions.
In addition, monitoring central bank gold reserves alongside this Hong Kong trade data provides analysts with a more complete picture of China's overall strategic accumulation posture.
Frequently Asked Questions: China Gold Imports via Hong Kong
What does net gold imports via Hong Kong actually measure?
Net imports represent total gold shipped from Hong Kong to mainland China, minus any gold re-exported from the mainland back through Hong Kong. This figure is generally considered a more reliable measure of true Chinese gold consumption and accumulation than gross import totals.
Why do different sources report different volumes for the same period?
Discrepancies arise from the gross versus net distinction, data revision cycles, differing purity conversion standards, and the timing of customs declaration reconciliation. Analysts should always confirm which metric a reported figure represents before drawing conclusions.
Does the PBOC publish its own import data?
The PBOC publishes official monthly gold reserve figures but does not release granular import volume breakdowns. The Hong Kong Census and Statistics Department provides the most widely used proxy dataset for tracking mainland-bound gold flows.
How does China's gold demand compare internationally?
China ranks as the world's largest gold consumer by volume, alongside India. Combined demand from both nations represents a substantial portion of total annual global physical gold absorption, making shifts in Chinese import patterns globally significant.
Do Chinese import surges directly push gold prices higher?
Sustained surges in Chinese physical demand tend to support price floors by tightening available above-ground supply. However, price direction remains heavily influenced by concurrent macro variables including USD strength, real interest rate expectations, and global central bank policy signals. Notably, when China gold imports via Hong Kong rise over an extended run of consecutive months, the cumulative supply draw becomes increasingly difficult for markets to absorb without price response.
Key Takeaways: What the April Surge Tells Us
- April's net import figure of 86.715 metric tons represents the 13th consecutive monthly increase, confirming a structural rather than cyclical demand pattern.
- The 81.2% month-on-month acceleration outside of peak seasonal periods points to investment and institutional demand as primary drivers, not calendar effects.
- 18 consecutive months of PBOC gold buying establishes a persistent institutional demand floor beneath retail and commercial flows.
- Hong Kong data remains an incomplete but analytically indispensable tool, capturing meaningful signal even as direct import channels expand.
- The simultaneous presence of strong Chinese physical demand and macro-driven spot price headwinds creates a dynamic that sophisticated investors are watching closely as a potential value accumulation window.
This article is intended for informational purposes only and does not constitute financial or investment advice. Gold markets involve significant price risk and past import trends do not guarantee future price outcomes. Readers should conduct independent research before making any investment decisions.
Want to Track the Next Major Mineral Discovery Before the Market Moves?
Discovery Alert's proprietary Discovery IQ model delivers real-time alerts on significant ASX mineral discoveries, transforming complex data into actionable investment insights for both short-term traders and long-term investors — explore historic discoveries and their exceptional returns, then begin your 14-day free trial at Discovery Alert to position yourself ahead of the market.