
July 7, 2026
The Counter-Intuitive Logic of Buying More When Prices Fall
Most participants in financial markets treat falling prices as a warning signal. When an asset drops sharply, the instinct is to reduce exposure, wait for clarity, or rotate into something more stable. Central banks, particularly those managing strategic reserve portfolios across multi-decade time horizons, operate under an entirely different set of priorities. For these institutions, a steep price decline in a core reserve asset can represent an opportunity rather than a threat, and June 2026 offered a textbook illustration of exactly this dynamic around China gold reserves rise even as bullion tumbles.
With spot gold recording its worst monthly performance since October 2008, the People's Bank of China did not pause its accumulation programme. It accelerated it. Understanding why requires stepping outside conventional investment logic and examining the structural forces that make sovereign gold accumulation one of the most disciplined and least price-sensitive buying behaviours in global commodity markets.
When big ASX news breaks, our subscribers know first
What the June 2026 PBoC Data Actually Reveals
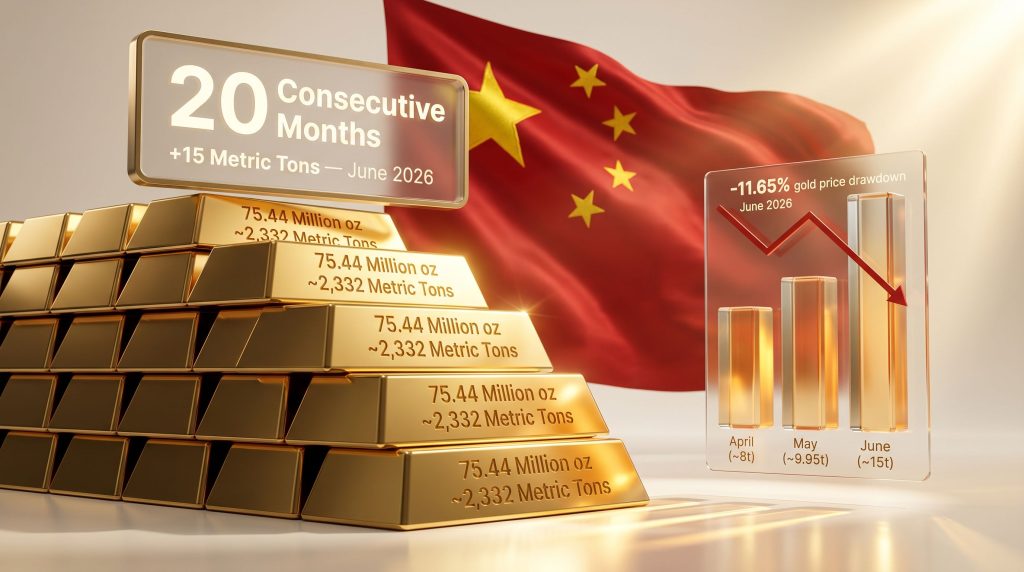
Official figures released by the People's Bank of China confirm that the country's gold reserves reached 75.44 million fine troy ounces by the end of June 2026, up from 74.96 million fine troy ounces at the end of May. The monthly addition of approximately 480,000 ounces, equivalent to roughly 15 metric tons, marked the largest single-month increase since October 2023. Furthermore, China's gold reserves rise have attracted considerable international attention given the backdrop of sharp price declines.
The following table summarises the key figures:
| Metric | June 2026 | May 2026 | Change |
|---|---|---|---|
| Total Reserves | 75.44 million oz (~2,332 tons) | 74.96 million oz (~2,313 tons) | +480,000 oz |
| Monthly Addition | ~15 metric tons | ~9.95 metric tons | Largest since Oct 2023 |
| Reserve Value (USD) | $303.72 billion | $340.75 billion | -$37.03 billion |
| Consecutive Months Buying | 20 | 19 | Streak extended |
At first glance, the most striking figure appears to be the decline in dollar-denominated reserve value, which fell by more than $37 billion over a single month. However, this is precisely where mainstream interpretation tends to mislead. The dollar value contracted not because China sold gold or reduced its position, but because spot gold itself dropped 11.65% during June — the steepest monthly decline since the financial crisis of 2008 — briefly breaching the psychologically significant $4,000 per ounce threshold.
The PBoC measures its reserve strategy in ounces accumulated, not dollar valuations achieved. A falling price environment reduces the cost of each additional ounce, making the June acceleration entirely consistent with institutional accumulation logic.
The October 2023 Benchmark and What Changed Since Then
For context, October 2023 remains the high-water mark for single-month Chinese gold additions, when the PBoC added approximately 740,000 ounces (~23 metric tons) in a single reporting period. June 2026's addition of ~15 metric tons falls short of that record but meaningfully surpasses the additions recorded in the preceding months of 2026. This suggests a deliberate response to the price environment rather than a passive continuation of existing targets.
| Period | Monthly Addition | Streak Status |
|---|---|---|
| April 2026 | ~8 metric tons | 18th consecutive month |
| May 2026 | ~9.95 metric tons | 19th consecutive month |
| June 2026 | ~15 metric tons | 20th consecutive month |
| October 2023 | ~23 metric tons | Previous record benchmark |
The pattern shows a clear step-up in volume precisely when prices fell hardest, reinforcing the interpretation that the PBoC treats price weakness as a cost-reduction mechanism for a pre-determined accumulation mandate.
Why China's Gold Reserves Rise Even as Bullion Tumbles: The Strategic Architecture
The phrase China gold reserves rise even as bullion tumbles is not a paradox once the institutional framework is properly understood. Three distinct but reinforcing strategic motivations explain the behaviour.
De-Dollarisation and the Neutral Reserve Asset Thesis
Over the past decade, China has systematically reduced its reliance on U.S. dollar-denominated instruments as a proportion of total foreign reserves. Gold occupies a unique position in this reallocation process: it carries no counterparty risk, it is not subject to the jurisdiction of any foreign government, and it cannot be frozen or sanctioned by a third party.
The freezing of Russian central bank assets in 2022 — a landmark moment in the history of reserve management — sent a clear signal to sovereign wealth managers globally that dollar-denominated reserves held in Western custodial systems carry political risk that had previously been considered negligible. China and gold's monetary role has consequently become one of the most closely analysed dynamics in global finance.
For China, which maintains a politically distinct relationship with Western financial infrastructure, this risk premium is not theoretical. Gold offers a credible hedge against scenarios where access to foreign currency reserves might be constrained by geopolitical developments.
The Sanctions-Resistance Premium
One of the less widely appreciated dimensions of China's gold strategy relates to the settlement infrastructure being developed alongside reserve accumulation. The Shanghai Gold Exchange plays a significant role in absorbing domestic gold supply outside the channels captured by international reporting frameworks.
Because China is the world's largest domestic gold producer by mine output, a portion of that production is believed to flow directly into state reserves without appearing in conventional import/export trade statistics. This creates what researchers describe as a structural reporting gap between official PBoC figures and estimated actual holdings. In addition, China's gold market dominance continues to reshape how analysts interpret global supply and demand dynamics.
Independent analysts have proposed that China's true gold holdings could range anywhere from 5,500 to 30,000 metric tons, compared to the officially reported ~2,332 metric tons. If the upper end of those estimates has any validity, China could already rank second globally in gold reserve holdings, behind only the United States.
| Country | Official Reserves (Approx.) | Global Rank (Official) |
|---|---|---|
| United States | ~8,133 metric tons | 1st |
| Germany | ~3,352 metric tons | 2nd |
| Italy | ~2,452 metric tons | 3rd |
| France | ~2,437 metric tons | 4th |
| Russia | ~2,333 metric tons | 5th |
| China (Official) | ~2,332 metric tons | 6th |
| China (Estimated) | 5,500-30,000 metric tons | Potentially 2nd |
The transparency gap carries significant implications for global gold price discovery. If China were ever to disclose holdings substantially above official figures, the revaluation effect on the gold market would be immediate and profound.
Domestic Monetary Signalling
Beyond geopolitics, the PBoC's continued accumulation also functions as a domestic confidence signal. During periods of yuan depreciation pressure, visible central bank gold demand provides a credibility anchor for the currency. Gold holdings underpin the perceived soundness of the monetary base in the eyes of both institutional and retail participants within China — a consideration that becomes more important during periods of macroeconomic uncertainty.
Notably, this dynamic has increasingly influenced retail behaviour. According to market tracking data, China's top-performing ETF by assets under management has shifted from equity-focused vehicles to gold-focused products, reflecting a structural reorientation in how Chinese savers approach wealth preservation.
Unpacking the June 2026 Gold Price Collapse
The 11.65% decline in spot gold during June 2026 was not a random market event. Several converging macro forces produced the selloff:
- Federal Reserve policy signals: Market participants increasingly priced in the probability that the Fed would maintain elevated interest rates for longer, strengthening the U.S. dollar and raising the opportunity cost of holding non-yielding gold.
- Dollar strength feedback loop: A stronger dollar makes dollar-priced commodities more expensive in foreign currency terms, mechanically suppressing gold demand from international buyers.
- Iran conflict dynamics: While geopolitical tension generally supports gold safe-haven demand, evolving peace talk developments in June introduced uncertainty around the duration of the embedded risk premium, causing some speculative positions to unwind.
- Technical and algorithmic selling: The breach below $4,000 per ounce is believed to have triggered pre-set stop-loss orders and algorithmic selling cascades, accelerating the decline beyond what fundamental drivers alone would have produced.
Comparing this to the October 2008 drawdown reveals an important structural distinction. In 2008, gold fell due to forced liquidation as investors needed cash during a credit crisis — a liquidity-driven collapse where sellers had no choice. The June 2026 decline appears more analytically grounded in rate expectations and currency dynamics, meaning the selling was more deliberate and the asset itself retained its fundamental characteristics as a store of value.
Crucially, in 2008, central banks were net sellers of gold. In 2026, they remain net buyers. That behavioural reversal reflects two decades of accumulated learning about reserve risk.
How Different Market Participants Respond to Price Declines
One of the most instructive aspects of the June 2026 data is how it illustrates the profound differences between demand types in the gold market:
| Demand Type | Primary Driver | Price Sensitivity | Time Horizon |
|---|---|---|---|
| Central Bank Accumulation | Reserve diversification, geopolitical hedging | Very low — counter-cyclical | Decades |
| Institutional/ETF Demand | Inflation hedging, portfolio allocation | Moderate | 1-5 years |
| Retail Investor Demand | Safe-haven sentiment, price momentum | High — pro-cyclical | Months |
| Industrial/Technology Demand | Electronics, medical, green technology | Low — stable | Structural |
Central banks occupy the far left of this price-sensitivity spectrum. Their buying is structurally non-discretionary in the sense that reserve composition targets do not flex with monthly price movements. This makes them uniquely effective at absorbing supply during periods when price-sensitive investors are exiting — a dynamic that establishes a floor under gold prices that becomes more durable as more central banks adopt similar frameworks.
Three Scenarios for Gold Through 2027
The interplay between Federal Reserve policy, dollar dynamics, and continued PBoC accumulation creates a range of plausible trajectories for gold pricing over the medium term. These scenarios are speculative and should not be interpreted as investment advice.
Scenario 1: Fed Pivot and Dollar Weakness
If the Federal Reserve begins reducing rates in late 2026 or early 2027, the dollar would likely weaken, removing the primary headwind that drove the June selloff. Gold could recover sharply above $4,000 per ounce, and the PBoC's counter-cyclical accumulation at lower prices would represent significant unrealised gains on the central bank's balance sheet.
Scenario 2: Prolonged High-Rate Environment
Persistent dollar strength would continue to cap gold in the near term. However, China would likely respond by deepening its volume accumulation at discounted prices, further tightening available physical supply globally. The long-term structural floor for gold strengthens as physical inventory concentrates in sovereign hands.
Scenario 3: Geopolitical Escalation
A re-escalation of conflict dynamics or an expansion of sanctions activity could trigger a rapid flight-to-safety premium. In this scenario, central bank buyers become price-insensitive accumulators, and the de-dollarisation narrative intensifies across emerging market economies simultaneously.
In each of these scenarios, China's counter-cyclical buying strategy positions the PBoC advantageously. The reserve base deepens regardless of short-term price outcomes, and any eventual price recovery generates balance sheet benefit proportional to the volume accumulated during the drawdown period.
The next major ASX story will hit our subscribers first
The Global Central Bank Context
China's behaviour does not occur in isolation. Global central banks collectively recorded their second-largest monthly gold purchase on record in recent periods, according to World Gold Council data, with emerging market institutions driving the bulk of net buying since 2022. Furthermore, central bank gold reserves have become a focal point for analysts tracking structural shifts in the international monetary system.
Citi's entry into bullion clearing also signals growing institutional infrastructure around physical gold settlement — a development that further validates the asset's role in the formal financial architecture rather than as a peripheral commodity. According to recent market analysis, this trend of China gold reserves rise even as bullion tumbles reflects a broader reassessment of what constitutes a resilient reserve portfolio in an era of weaponised financial infrastructure and elevated geopolitical fragmentation.
Frequently Asked Questions
Why is China buying gold when prices are falling?
The PBoC's accumulation mandate is driven by long-term reserve diversification objectives and geopolitical risk hedging, not short-term price signals. Falling prices reduce the cost per ounce and make counter-cyclical buying strategically rational for an institution measuring success in volume terms.
How much gold does China officially hold as of June 2026?
China's official reserves stood at 75.44 million fine troy ounces, approximately 2,332 metric tons, valued at $303.72 billion at June month-end prices.
Are China's official gold reserve figures reliable?
Official PBoC monthly disclosures are considered credible for reported holdings. However, independent researchers estimate actual holdings may substantially exceed official figures, potentially by a factor of two to ten times, due to domestic mine production absorbed directly into state reserves and opaque import channels that fall outside standard trade reporting.
What caused the 11.65% gold price decline in June 2026?
The primary drivers were Federal Reserve rate-hold signals that strengthened the U.S. dollar, shifting geopolitical dynamics around the Iran conflict, and technical selling triggered once gold breached the $4,000 per ounce threshold.
How long has China been buying gold consecutively?
As of the end of June 2026, China has added gold to its reserves for 20 consecutive months, representing one of the longest uninterrupted central bank accumulation streaks on record for any single nation.
Where does China rank in global gold reserves?
China ranks sixth globally by official figures. Estimated undisclosed holdings, if accurate, could place China as high as second, behind only the United States.
This article is intended for informational purposes only and does not constitute financial or investment advice. Scenario analysis and forward-looking statements involve inherent uncertainty. Readers should conduct independent research before making any investment decisions. For ongoing gold market data and central bank reserve tracking, visit mining.com.
Want to Track the Next Major Mineral Discovery Before the Market Moves?
Discovery Alert's proprietary Discovery IQ model delivers real-time alerts on significant ASX mineral discoveries, transforming complex data across more than 30 commodities into a single, actionable gold-equivalent metric — giving investors a decisive edge the moment opportunities emerge. Explore how historic discoveries have generated substantial returns for early movers, and begin your 14-day free trial at Discovery Alert to position yourself ahead of the market.