The global rare earth supply chain operates within intricate webs of industrial dependency, where technological advancement and geopolitical strategy converge around materials that remain invisible to most consumers yet essential to modern civilization. Within this complex ecosystem, neodymium and praseodymium compounds have emerged as the cornerstone elements driving everything from electric vehicle motors to wind turbine generators, creating market dynamics that ripple across continents with unprecedented speed and intensity. The China NdPr price surge witnessed in recent months exemplifies how energy transition minerals can experience dramatic volatility within compressed timeframes.
Understanding these materials requires examining their unique position within the periodic table and industrial applications. Unlike commodity metals traded on transparent exchanges with deep liquidity, rare earth elements operate within opaque markets where price discovery occurs through specialized reporting mechanisms and bilateral negotiations between vertically integrated producers and downstream manufacturers.
Understanding the Neodymium-Praseodymium Market Foundation
What Makes NdPr Essential to Modern Manufacturing?
Neodymium and praseodymium possess magnetic properties that remain unmatched by alternative materials in high-performance applications requiring compact form factors. These elements combine to create the most powerful permanent magnets commercially available, with magnetic energy products exceeding 50 MGOe (mega-gauss-oersteds), significantly surpassing ferrite or samarium-cobalt alternatives.
The technical irreplaceability of NdPr stems from its crystalline structure when alloyed with iron and boron. This combination produces magnets that maintain their magnetic field strength across temperature ranges from -40°C to 180°C, making them suitable for automotive applications where engine compartment temperatures fluctuate dramatically.
Electric vehicle manufacturers depend on these materials for permanent magnet synchronous motors, which offer several advantages:
• Higher power density: 2-3x more torque per kilogram compared to induction motors
• Improved efficiency: 92-95% energy conversion versus 85-90% for alternatives
• Reduced size and weight: Critical for vehicle range optimisation
• Lower maintenance requirements: No brushes or slip rings to replace
Wind turbine applications present even more demanding requirements. Direct-drive generators in modern offshore wind installations require 600-1,000 kg of NdFeB magnets per MW of capacity. A typical 15 MW offshore turbine therefore contains approximately 9-15 tonnes of permanent magnets, representing substantial rare earth feedstock demand.
Consumer electronics applications, while smaller by individual unit weight, aggregate to significant demand volumes. Smartphone speakers, laptop hard drives, and headphone drivers each contain 1-5 grams of NdFeB magnets. With 1.4 billion smartphones manufactured annually, this sector alone consumes hundreds of tonnes of rare earth feedstock.
Market Structure and Key Performance Indicators
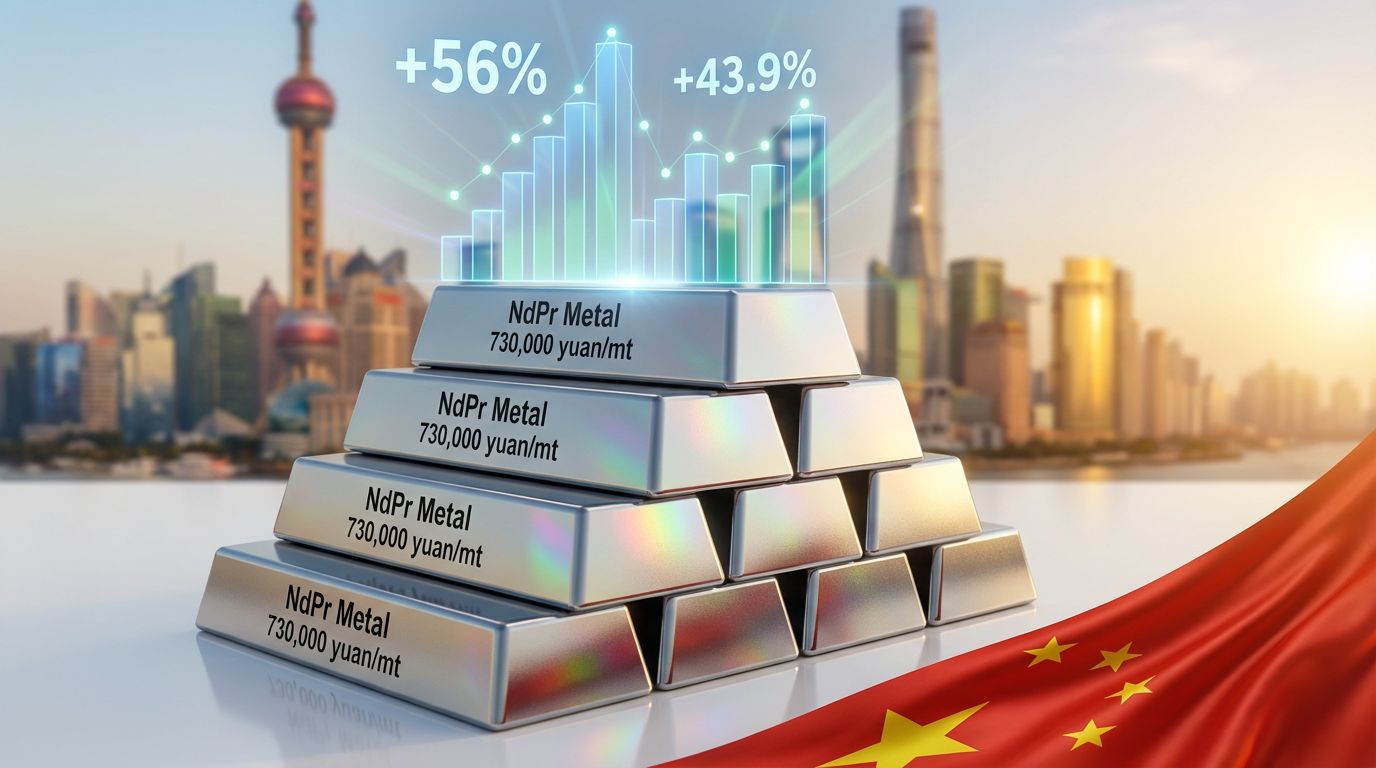
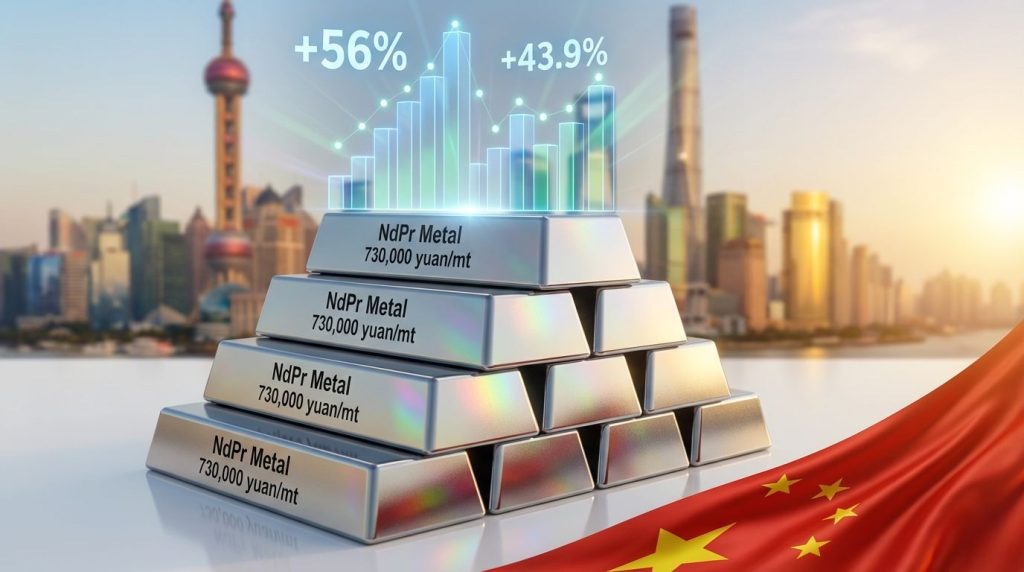
The Shanghai Metals Market serves as the primary price discovery mechanism for light rare earths globally, publishing daily benchmarks that influence transaction prices across international markets. Current pricing benchmarks as of December 2025 reflect significant market tension:
| Product Form | Current Price | YoY Change | Q4 2025 Range |
|---|---|---|---|
| NdPr Oxide | 596,500 yuan/mt | +43.9% | 550,000-620,000 |
| NdPr Metal | 730,000 yuan/mt | +56% | 680,000-750,000 |
The 22.4% differential between oxide (596,500 yuan/mt) and metal (730,000 yuan/mt) forms reflects processing complexity and conversion costs. Transforming oxide concentrate into alloy-ready metal requires:
• Electrowinning processes consuming 12-15 kWh per kilogram
• Purification to 99.5%+ purity for magnet-grade applications
• Controlled atmosphere handling to prevent oxidation
• Specialised metallurgical equipment with high capital intensity
Trading volume patterns reveal market structure characteristics often invisible in daily price reports. Typical lot sizes range from 5-50 tonnes, reflecting the specialised nature of rare earth transactions compared to base metals where 25-tonne lots are standard. Bid-ask spreads frequently exceed 2-3%, indicating limited liquidity compared to mature commodity markets where spreads remain below 0.5%.
Global consumption patterns demonstrate the concentration of demand within specific industrial sectors:
• Permanent magnets: 95% of total NdPr consumption
• Automotive applications: 35% of magnet demand
• Wind energy: 25% of magnet demand
• Consumer electronics: 20% of magnet demand
• Industrial motors and pumps: 15% of magnet demand
• Other applications: 5% of magnet demand
Why Are Chinese NdPr Prices Experiencing Unprecedented Volatility?
Supply-Side Constraints Driving Price Momentum
The China NdPr price surge documented on December 1, 2025, represents more than typical market fluctuation. NdPr oxide jumped 30,000 yuan per tonne in a single trading session, while metal prices increased by 36,500 yuan per tonne, representing approximately 5.3% intraday gains for both product forms. Such movements are characterised as rare even within the historically volatile light rare earth segment.
Multiple structural factors contribute to supply-side pressure:
Seasonal Mining Disruptions: Chinese rare earth mining operations face intensified regulatory scrutiny during Q4 environmental remediation cycles. Mining permits require renewal during winter months, creating predictable but acute supply disruptions. Northern China rare earth operations, including those in Inner Mongolia's Bayan Obo district, typically reduce output by 15-25% during November through February due to weather and regulatory factors.
Processing Capacity Bottlenecks: China's rare earth separation industry operates through approximately 300,000 tonnes of annual processing capacity, concentrated among six major groups following government consolidation initiatives. Furthermore, when utilisation rates exceed 85%, bottlenecks emerge at specific separation stages, particularly for light rare earth elements requiring complex solvent extraction processes.
Inventory Management Strategies: The December price movement occurred against a backdrop of conservative inventory management throughout the autumn period. Market participants report that magnet manufacturers maintained lower-than-normal stockpiles during September and October, anticipating potential price weakness. This strategic inventory reduction amplified the impact of any supply tightening signals.
Critical Market Intelligence: Shanghai Metals Market cited multiple factors behind the December surge but provided no specific attribution, leaving market participants to interpret causality from limited information. This information vacuum often amplifies price volatility as traders position based on incomplete data.
Demand-Side Pressures Amplifying Market Tensions
Forward Contracting Intensity: Japanese and European magnet manufacturers reported firmer Q1 2026 pricing in the week preceding the December 1 price spike, indicating supply tightness extended beyond Chinese domestic markets. This cross-regional confirmation suggests underlying demand strength rather than isolated speculation, particularly as European CRM facilities prepare for expanded operations.
Strategic Stockpiling Behaviour: Multiple industrial categories demonstrate seasonal stockpiling patterns that intensify during Q4:
• Electric vehicle manufacturers building inventory ahead of Q1 2026 production ramp-ups
• Wind turbine producers securing feedstock for spring installation seasons
• Electronics manufacturers preparing for post-holiday production cycles
• Industrial motor producers anticipating 2026 capital equipment demand
Export Demand Acceleration: International magnet manufacturers, particularly those establishing operations outside China, require predictable feedstock supply to maintain production schedules. Any perceived supply risk triggers accelerated purchasing, contributing to demand spikes that exceed underlying consumption growth.
The combination of conservative inventory positions and accelerated forward buying creates demand amplification effects. When multiple buyer categories simultaneously attempt to increase stocks, available supply becomes insufficient to meet aggregate demand without price adjustment.
China's Big Six consolidation has altered market dynamics by concentrating production decision-making among fewer entities. This structural change potentially increases price volatility by reducing the number of independent supply sources capable of responding to demand fluctuations.
How Do Price Shocks Cascade Through the Magnet Manufacturing Ecosystem?
Immediate Industry Response Patterns
The December 1 price shock triggered immediate responses throughout the magnet manufacturing supply chain. Multiple NdFeB magnet producers raised quotes and slowed order intake within hours of the Shanghai Metals Market price publication. This reaction pattern reflects the structural reality that magnet manufacturers operate on razor-thin margins, typically 5-15% gross margins, making feedstock cost absorption impossible without severe profitability impact.
Instant Price Transmission Mechanisms:
• Real-time cost monitoring systems alert production managers to feedstock price changes
• Automated quote adjustment protocols modify customer pricing within 2-4 hours
• Order intake modulation reduces forward price exposure during volatility periods
• Inventory draw-down strategies delay feedstock purchases during price spikes
The speed of this transmission underscores the integrated nature of China's rare earth supply chain. Separation facilities, alloy producers, and magnet manufacturers often operate within the same industrial parks or maintain direct ownership relationships, enabling near-instantaneous information and price transmission.
Margin Compression Thresholds: Industry analysis indicates that magnet producers typically absorb feedstock cost increases up to 2-3% before adjusting quotes. Beyond this threshold, immediate price pass-through becomes necessary to maintain operational viability. The December 1 movement of 5.3% therefore necessitated immediate customer price adjustments.
Downstream Impact Assessment
Electric Vehicle Component Costs: A typical electric vehicle permanent magnet motor contains 0.5-1.0 kg of NdFeB magnets. At current magnet costs, this represents $150-300 per vehicle in magnetic material content. A 5-7% magnet price increase therefore adds $10-20 per vehicle in direct material costs, excluding processing and assembly margins.
Wind Turbine Generator Pricing: Direct-drive wind turbine generators represent the most significant single application for rare earth permanent magnets. However, a 15 MW offshore turbine requires approximately 12-15 tonnes of NdFeB magnets, representing $2-3 million in magnetic material costs. Feedstock price increases therefore translate directly to hundred-thousand-dollar impacts per turbine.
Consumer Electronics Manufacturing Pressures: While individual consumer devices contain minimal rare earth content, aggregate demand creates substantial exposure. Smartphone manufacturers producing 100+ million units annually face multi-million-dollar cost increases from even modest rare earth price escalation.
The cascading effect follows predictable patterns:
- Immediate: Magnet producers adjust quotes (same day)
- Short-term: Component manufacturers revise pricing (1-2 weeks)
- Medium-term: OEM cost models updated (1-3 months)
- Long-term: End product pricing adjustments (3-12 months)
Western Supply Chain Vulnerability: Emerging Western magnet manufacturing facilities face disproportionate impact from feedstock volatility. Unlike mature Chinese operations with established supplier relationships and hedging mechanisms, new European and American facilities lack the financial resources and operational flexibility to manage supply price shocks effectively.
What Structural Factors Determine Long-Term NdPr Market Dynamics?
China's Dominant Position in Global Processing
China maintains 85-89% of global rare earth separation and refining capacity, representing approximately 250,000-300,000 tonnes of annual processing capability. This concentration creates structural market control that extends far beyond mining operations to encompass the critical value-added processing stages.
Separation Technology Barriers: Rare earth separation requires sophisticated solvent extraction processes involving hundreds of theoretical stages to achieve 99.5%+ purity levels required for magnet applications. The technical knowledge, specialised equipment, and operational expertise needed for efficient separation creates substantial barriers to entry for potential competitors.
Regulatory Framework Control: China's rare earth industry operates under comprehensive regulatory oversight that includes:
• Annual production quotas allocated among licensed producers
• Export licensing requirements controlling international sales
• Environmental compliance standards governing processing operations
• Consolidation policies concentrating operations among approved groups
Integration Advantages: Chinese rare earth operations demonstrate vertical integration spanning mining through finished magnets. This integration enables:
• Optimised production scheduling across processing stages
• Reduced transaction costs through internal material transfers
• Enhanced quality control throughout the value chain
• Coordinated response to market conditions across multiple production levels
Western Supply Chain Development Timeline
Current Dependency Metrics: Non-Chinese economies rely on Chinese suppliers for 80-95% of rare earth feedstock, creating strategic vulnerabilities in critical technology supply chains. European magnet manufacturers source approximately 90% of raw materials from Chinese suppliers, while American operations maintain similar dependency levels.
Mid-2030s Development Trajectory: Planned Western rare earth processing capacity aims to achieve 15-25% of global separation capability by 2035. However, these projections face significant execution risks:
• Capital requirements: $500 million – $2 billion per separation facility
• Technical expertise scarcity: Limited global pool of experienced rare earth processing engineers
• Regulatory approval timelines: 5-10 years for environmental permits and facility licensing
• Feedstock supply security: Dependence on limited non-Chinese mining operations
Investment Requirements Analysis:
| Development Stage | Capital Required | Timeline | Technical Risk |
|---|---|---|---|
| Mining Operations | $200-800M | 7-12 years | Medium |
| Separation Facilities | $500M-2B | 5-8 years | High |
| Alloy Production | $100-300M | 3-5 years | Low |
| Magnet Manufacturing | $50-200M | 2-4 years | Low |
The technical risk assessment reflects the complexity of each stage, with separation facilities requiring the most sophisticated expertise and longest development timelines. This is where a comprehensive critical minerals strategy becomes essential for Western nations.
Which Market Signals Indicate Sustainable vs. Temporary Price Movements?
Distinguishing Structural Tightening from Tactical Restocking
Market participants must differentiate between fundamental supply-demand imbalances and short-term inventory cycles to make informed strategic decisions. The December 1, 2025 price movement illustrates this analytical challenge, as Shanghai Metals Market provided limited attribution for the underlying causes.
Structural Tightening Indicators:
• Sustained high utilisation rates (>90%) across separation facilities
• Export quota exhaustion before Q4 of the quota year
• Multi-quarter inventory reduction among major consumers
• Cross-regional price correlation between Chinese and international markets
• Long-term contract price escalation beyond spot market movements
Tactical Restocking Characteristics:
• Seasonal purchase patterns aligned with historical cycles
• Short-duration price spikes (1-4 weeks) followed by stabilisation
• Limited downstream price transmission to finished products
• Inventory rebuild following periods of conservative stocking
• Speculative trading activity without underlying consumption growth
Forward Curve Analysis: The rare earth futures market on Shanghai Futures Exchange provides limited but valuable insight into market expectations. Contango conditions (future prices above spot) typically indicate temporary tightness, while backwardation (spot above futures) suggests structural supply constraints.
Geopolitical Risk Assessment Framework
Export Restriction Evolution: China's rare earth export policies have evolved from quantity-based quotas to licensing-based controls and technology transfer requirements. Recent policy developments include:
• Strategic mineral classification for certain rare earth compounds
• End-use monitoring requirements for high-purity materials
• Technology export restrictions on separation equipment and processes
• National security reviews of foreign investment in rare earth operations
Early Warning Systems: Effective risk monitoring requires tracking multiple indicators:
• Ministry of Industry and Information Technology announcements regarding production quotas
• Export licensing approval rates and processing timeframes
• Diplomatic tensions affecting trade relationships
• Domestic Chinese consumption growth competing with export availability
Investment Risk Matrix: The combination of supply concentration, geopolitical tensions, and technological barriers creates a unique risk profile requiring specialised assessment frameworks beyond traditional commodity analysis.
How Should Investors Evaluate NdPr Market Exposure?
Direct Investment Opportunities and Risks
Rare Earth Mining Equity Exposure: Direct investment in rare earth mining companies requires careful evaluation of resource quality, processing capabilities, and market positioning. Key analytical factors include:
Resource Grade Assessment:
• Total Rare Earth Oxide (TREO) content: >5% considered high-grade deposits
• NdPr percentage of TREO: 20-25% optimal for permanent magnet markets
• Heavy rare earth content: Premium valuation for dysprosium and terbium presence
• Radioactive material content: Thorium and uranium impact processing costs and regulatory approval
Geographic Risk Evaluation:
| Region | Mining Risk | Processing Risk | Political Risk | Infrastructure |
|---|---|---|---|---|
| China | Low | Low | Medium | Excellent |
| Australia | Low | High | Low | Good |
| USA | Medium | High | Low | Good |
| Africa | High | High | High | Poor |
| Canada | Medium | High | Low | Good |
Processing Facility Investments: Separation and refining facilities represent higher-margin, higher-risk opportunities compared to mining operations. Technical due diligence requirements include:
• Solvent extraction technology licensing and intellectual property rights
• Environmental permitting status and waste management capabilities
• Skilled workforce availability for complex chemical processing operations
• Feedstock supply agreements ensuring consistent raw material availability
Furthermore, this connects to broader defence critical materials requirements for nations seeking supply chain security.
Indirect Exposure Through Industrial Applications
Magnet Manufacturer Investment Analysis: Companies producing NdFeB permanent magnets offer leveraged exposure to rare earth price movements while maintaining diversified end-market exposure. Key performance indicators include:
• Magnet production capacity utilisation: >85% indicates strong demand
• Average selling price trends: Leading indicator of margin sustainability
• Customer concentration risk: Automotive OEM dependency levels
• Feedstock hedging strategies: Risk management sophistication
Electric Vehicle Supply Chain Exposure: EV manufacturers and component suppliers face material cost volatility that impacts margin predictability. Investment analysis should evaluate:
• Motor technology roadmaps: Permanent magnet vs. induction motor strategies
• Vertical integration plans: In-house magnet production capabilities
• Supply contract structures: Fixed-price vs. cost-plus arrangements
• Alternative technology development: Reduced rare earth content initiatives
Renewable Energy Sector Sensitivity: Wind turbine manufacturers demonstrate high sensitivity to rare earth costs due to large magnet requirements per unit. Critical assessment factors:
• Direct-drive vs. gearbox technology mix: Different rare earth intensity levels
• Geographic market exposure: Regional pricing differentials and supply access
• Long-term service contracts: Fixed-price maintenance agreements with cost exposure
• Technology development pipelines: Reduced rare earth content initiatives
What Does the Future Hold for Global NdPr Market Development?
Demand Growth Projections Through 2030
Electric Vehicle Market Expansion: Global EV adoption scenarios project 25-45% of new vehicle sales transitioning to electric powertrains by 2030. This transformation drives substantial rare earth demand:
• Conservative scenario: 25M EVs annually by 2030 = 12,500-25,000 tonnes NdPr demand
• Aggressive scenario: 45M EVs annually by 2030 = 22,500-45,000 tonnes NdPr demand
• Current global NdPr production: Approximately 50,000-60,000 tonnes annually
Wind Energy Capacity Additions: Offshore wind expansion drives disproportionate rare earth demand due to direct-drive generator preferences in marine environments. Projected installations:
• Global offshore wind capacity: 100-150 GW additions by 2030
• Direct-drive market share: 60-80% of new offshore installations
• Additional NdPr demand: 8,000-15,000 tonnes annually by 2030
Technology Sector Evolution: Device miniaturisation and performance enhancement requirements maintain rare earth intensity despite efficiency improvements:
• 5G infrastructure deployment: Enhanced permanent magnet motor requirements
• Data centre growth: Precision cooling and storage applications
• Aerospace and defence: High-performance motor and actuator applications
Supply Response Capabilities and Constraints
Chinese Capacity Expansion Plans: Current announced capacity increases target 20-30% expansion by 2030, but regulatory constraints and environmental policies may limit actual implementation. This development is crucial considering the mining industry evolution occurring globally.
• Planned separation capacity additions: 60,000-80,000 tonnes by 2030
• Environmental compliance costs: Increasing operational expenses
• Consolidation policy impacts: Reduced competitive pressure on capacity utilisation
Western Development Project Timeline:
| Project | Location | Capacity | Timeline | Development Risk |
|---|---|---|---|---|
| Lynas Malaysia | Malaysia | 22,000 tonnes | Operational | Regulatory |
| MP Materials | California, USA | 15,000 tonnes | 2025-2027 | Technical |
| Rainbow Rare Earths | South Africa | 3,000 tonnes | 2026-2028 | Financing |
| Vital Metals | Canada | 5,000 tonnes | 2027-2029 | Resource |
Recycling Technology Development: Urban mining from end-of-life magnets presents long-term supply diversification opportunities:
• Current recycling rates: <1% of rare earth consumption
• Technical barriers: Magnet demagnetisation and separation complexity
• Economic thresholds: Recycling viable above $40/kg NdPr pricing
• Potential by 2030: 5,000-10,000 tonnes annual recycled supply
Frequently Asked Questions About NdPr Market Dynamics
Why Can't Western Countries Quickly Replace Chinese NdPr Supply?
Technical Complexity Barriers: Rare earth separation involves hundreds of theoretical extraction stages using sophisticated solvent extraction processes. The technical knowledge required includes:
• Chemical engineering expertise: Understanding of multi-stage extraction chemistry
• Process optimisation skills: Minimising solvent consumption and waste generation
• Quality control systems: Achieving 99.5%+ purity for magnet-grade applications
• Operational experience: Managing complex, continuous chemical processes
Capital Intensity Requirements: Separation facilities require $500 million to $2 billion initial investment, representing one of the most capital-intensive segments of the mining industry. Cost components include:
• Specialised chemical processing equipment: Custom-designed extraction columns and systems
• Environmental control systems: Waste treatment and emission controls
• Laboratory and quality assurance facilities: Analytical equipment for purity verification
• Working capital requirements: 3-6 months of operating expenses due to process complexity
Timeline Constraints: Establishing competitive rare earth operations requires 8-12 years from initial investment to commercial production:
• Environmental permitting: 2-4 years for regulatory approval
• Engineering and construction: 3-5 years for facility development
• Commissioning and optimisation: 1-2 years for process refinement
• Market establishment: 2-3 years for customer qualification and volume ramp
How Do NdPr Prices Compare to Other Critical Materials?
Volatility Comparison Analysis:
| Material | Annual Volatility | Market Size | Liquidity | Substitution |
|---|---|---|---|---|
| NdPr | 40-80% | $3-5B | Low | Minimal |
| Lithium | 60-120% | $15-25B | Medium | Limited |
| Cobalt | 50-90% | $8-12B | Medium | Moderate |
| Nickel | 30-60% | $40-60B | High | Good |
Strategic Importance Rankings: Government and industry assessments consistently rank NdPr among the most critical materials due to:
• Supply concentration: 85%+ in single country (China)
• Technical irreplaceability: No viable substitutes for high-performance applications
• Economic significance: Essential for clean energy and defence technologies
• Supply elasticity: Limited ability to rapidly increase production
What Early Warning Indicators Signal Major Price Movements?
Production and Export Statistics: Monthly Chinese rare earth statistics provide the most reliable leading indicators:
• Mine production data: Released with 6-8 week lag by Chinese authorities
• Export volumes and pricing: Monthly customs data showing international shipments
• Separation facility utilisation: Industry surveys indicating capacity usage rates
• Inventory levels: Producer and consumer stockpile reports
Downstream Market Signals:
• Magnet producer order intake: Leading indicator of demand strength
• Electric vehicle production schedules: Forward-looking demand visibility
• Wind turbine installation pipelines: 12-18 month demand forecasting
• Long-term contract negotiations: Pricing trend establishment
Regulatory and Policy Announcements: Chinese government policy communications often precede market movements by 2-6 weeks:
• Ministry of Industry and Information Technology statements on production policy
• National Development and Reform Commission strategic planning announcements
• Environmental protection enforcement campaign declarations
• Trade policy modifications affecting export procedures or requirements
Strategic Implications for Global Manufacturing Competitiveness
Regional Vulnerability Assessment
European Manufacturing Exposure: European permanent magnet and electric motor industries demonstrate critical vulnerability to Chinese supply chain disruption:
• Automotive sector dependency: 90%+ of rare earth feedstock from Chinese sources
• Wind energy industry exposure: 85%+ reliance on Chinese permanent magnet supply
• Industrial motor manufacturing: 80%+ dependency on Chinese rare earth materials
• Limited strategic reserves: 2-6 month inventory levels across critical applications
North American Supply Chain Resilience: United States and Canadian manufacturing faces similar but somewhat lower dependency levels:
• Defence industry vulnerability: 95%+ rare earth content from Chinese supply chains
• Clean energy manufacturing: 75-85% dependency on Chinese materials
• Consumer electronics production: 90%+ rare earth component sourcing from Asia
• Strategic stockpile limitations: Current reserves insufficient for extended disruption scenarios
Asian Market Integration: Japanese and South Korean manufacturers benefit from closer integration with Chinese supply chains while maintaining higher inventory flexibility:
• Established trading relationships: Decades of commercial partnerships with Chinese suppliers
• Geographic proximity advantages: Reduced logistics costs and shorter supply chains
• Cultural and business familiarity: Enhanced communication and problem-solving capabilities
• Technology collaboration: Joint development programmes and technical partnerships
Policy Response Options and Effectiveness
Strategic Reserve Development: Government stockpiling programmes provide limited but important supply security enhancement:
Effectiveness Analysis:
• Optimal reserve size: 90-180 days of consumption for critical applications
• Cost considerations: $500 million – $2 billion investment for national-scale programmes
• Storage and management complexity: Specialised facilities and inventory rotation requirements
• Market impact: Large purchases can amplify price volatility and supply tightness
International Cooperation Frameworks: Multilateral initiatives aim to enhance supply chain resilience through coordinated action:
• Critical Materials Partnerships: US-EU-Canada-Australia coordination mechanisms
• Technology sharing agreements: Joint development of separation and processing technologies
• Emergency supply protocols: Mutual assistance during supply disruption events
• Investment coordination: Avoiding duplicate capacity development and optimising resource allocation
Research and Development Priorities: Long-term supply security requires sustained investment in alternative technologies and processes:
• Magnet recycling advancement: Urban mining technology development and cost reduction
• Alternative magnet materials: Research into rare-earth-free permanent magnet technologies
• Reduced rare earth content: Engineering solutions minimising material intensity
• Substitution strategies: Application-specific alternatives to rare earth technologies
Market Outlook Disclaimer: The analysis presented reflects current market conditions and available information as of December 2025. Rare earth markets demonstrate high volatility and are subject to rapid changes in supply, demand, regulatory policies, and geopolitical factors. Investors should conduct independent research and risk assessment before making investment decisions. Price projections and market forecasts carry substantial uncertainty and should not be considered as guarantees of future performance.
The China NdPr price surge reflects deeper structural imbalances in global supply chains that will likely persist throughout the decade. As reported by Reuters, rare earth prices have reached two-year highs following supply disruptions, while industry analysis suggests these elevated price levels may become the new normal as demand continues to outpace supply capacity additions.
Are You Positioned to Capitalise on Critical Mineral Market Volatility?
The unprecedented NdPr price surge demonstrates how quickly critical mineral markets can shift, creating substantial opportunities for investors who stay ahead of supply-demand dynamics. Discovery Alert's proprietary Discovery IQ model delivers instant notifications when significant ASX mineral discoveries are announced, turning complex market data into actionable investment insights that help you identify the next major breakthrough before the broader market responds. Begin your 30-day free trial today to ensure you never miss another critical mineral discovery opportunity in this rapidly evolving market landscape.