August 6, 2026
The Architecture of a Price: Why Benchmark Gold Figures May Not Reflect Physical Reality
Every day, millions of investors glance at a number on a screen and assume it tells them what gold is worth. That assumption has rarely been questioned with more structural justification than it is today. The mechanics of how gold prices are actually formed, and what backs those prices in physical reality, are questions that have moved from the fringes of monetary theory into the centre of one of the most significant financial transitions now unfolding in Asia.
The China paper gold trading shutdown is not a story about restricting access to gold. It is a story about removing synthetic price-setting instruments from the world’s largest retail market and replacing them with a framework that demands real metal moves when trades are made. The distinction is foundational, and its implications extend far beyond China’s borders.
When big ASX news breaks, our subscribers know first
What Paper Gold Actually Is, and Why It Sets the Price
To understand what is changing, it helps to first understand the mechanics of how most gold trades today. In the dominant Western benchmark markets, primarily London and New York, the vast majority of daily gold trading does not involve any physical movement of metal at all.
A buyer purchases a contract. That contract entitles the holder to a claim on gold at the prevailing price. The underlying bar theoretically exists somewhere in a vault, but because most participants never request physical delivery, the same ounce of gold can effectively underpin multiple contracts simultaneously. No regulatory mechanism exists to cap the ratio of paper claims to physical metal.
The most consequential price in the global monetary system is set by a market that cannot independently verify how much of the underlying asset it actually holds. That is not a minor technical footnote. It is the structural foundation of modern gold price discovery.
This matters for one precise reason: the gold price, like any price, is set by supply and demand. However, in a market dominated by synthetic contracts, the relevant supply figure is not the number of physical bars — it is the number of contracts. If ten paper claims exist for every real ounce, the market perceives ten times the actual supply. More apparent supply means a lower price, and every additional contract drives the benchmark further from what physical metal alone would command.
Paper Gold vs. Physical Gold: Key Structural Differences
| Feature | Paper Gold (Synthetic Contracts) | Physical Gold |
|---|---|---|
| Metal movement required | No | Yes |
| Leverage possible | Yes (up to 140% margin) | No |
| Settlement method | Cash | Bullion delivery |
| Price influence | High (sets benchmark) | Secondary |
| Counterparty risk | Present | Absent |
| Vault space required | None | Significant |
The Specific Instruments Being Terminated in China
The products ending on July 24, 2026 are leveraged synthetic instruments, specifically deferred delivery contracts and spot margin products, sometimes structured as AUT+D contracts, which allowed retail investors to control positions far larger than their actual cash deposits. These are not straightforward gold savings products. They are margin-based instruments where a small deposit governs a much larger notional position.
In the months leading up to the termination date, Chinese banks raised margin requirements to 140%, a level that effectively forced the closure of leveraged positions and compressed the retail paper gold market before the formal shutdown arrived. A 30-day liquidation window was provided, giving affected customers time to close positions or convert holdings.
The coordinated nature of these announcements is worth examining carefully.
Banks Halting Retail Precious Metals Services
| Institution | Announcement Timing | Effective Date |
|---|---|---|
| Postal Savings Bank of China | First mover | July 24, 2026 |
| Industrial and Commercial Bank of China (ICBC) | June 25, 2026 | July 24, 2026 |
| Ping An Bank | June 25, 2026 | July 24, 2026 |
| China Guangfa Bank | June 25, 2026 | July 24, 2026 |
When multiple systemically important financial institutions announce identical product terminations within the same regulatory window, the convergence raises questions that a single-bank consumer protection rationale cannot fully address. Coordinated structural exits of this scale typically reflect upstream policy direction rather than isolated risk management decisions.
The official explanation offered by these institutions centres on protecting retail customers from volatile price swings. Gold did reach an all-time high in early 2025 before experiencing a drawdown of nearly 30%, and some retail participants did suffer losses. However, consumer protection logic struggles to explain why institutions of this scale, operating across different corporate structures and risk management frameworks, would arrive at identical product terminations on the same calendar date.
A Six-Year Regulatory Arc Reaches Its Conclusion
The July 24 transition did not emerge suddenly. China’s regulatory trajectory toward physically settled gold markets has been building for over half a decade, with incremental tightening of margin products, increased scrutiny of synthetic instruments, and the deliberate expansion of physically settled infrastructure running in parallel. The bank-level announcements represent the final phase of a process that was architecturally planned long before this year’s gold volatility provided a convenient narrative justification.
What is being shut down is access to the instruments most capable of artificially suppressing price signals. Furthermore, what is being built in their place is a system where real metal must move, real vaults must hold it, and prices must reflect actual physical availability. The China paper gold trading shutdown, in this context, is the culmination of a carefully managed structural transition rather than a reactive policy response.
The 1968 London Gold Pool: A Historical Template for What Follows
The structural parallel between the current transition and the collapse of the London Gold Pool in 1968 is not rhetorical decoration. It is a precise mechanical analogy, and understanding the historical sequence clarifies what the current one may produce.
Following the Bretton Woods agreement in 1944, the US dollar was established as the world’s reserve currency, underpinned by a US government guarantee to exchange any dollar held by a foreign government for gold at a fixed price of $35 per ounce. Holding dollars was, in theory, equivalent to holding gold.
Through the 1950s and 1960s, American deficit spending, driven by military commitments and domestic programmes, expanded the number of dollars in global circulation significantly. The amount of gold in US vaults did not expand at the same rate. Consequently, any foreign government capable of basic arithmetic could see that the fixed $35 price was no longer mathematically credible and began converting dollar reserves into gold at the guaranteed rate.
To defend the price, the United States and seven European allies formed the London Gold Pool in 1961, a mechanism through which participating central banks sold gold into the open market whenever buying pressure pushed prices above $35. The pool was, at its core, a collective commitment to sell real assets to defend a paper price.
The Collapse of the London Gold Pool: A Timeline
| Date / Period | Event |
|---|---|
| 1944 | Bretton Woods agreement establishes $35/oz gold convertibility |
| 1961 | London Gold Pool formed by the US and seven European allies |
| Mid-1960s | US deficit spending accelerates; dollar-gold arithmetic deteriorates |
| 1965-1967 | France exits the pool; begins converting dollar reserves to gold |
| March 8, 1968 | Pool sells 100 tonnes of gold in a single trading day |
| Final week, March 1968 | Approximately 1,000 tonnes of gold sold to defend the price |
| March 14-15, 1968 | London gold market suspended; emergency bank holiday declared |
| Post-March 1968 | Two-tier pricing system introduced: official $35 vs. free market price |
| August 1971 | Nixon closes the gold window entirely |
| 1980 | Gold reaches $850/oz, a 24x increase from the defended price |
France was among the first to withdraw from the pool, concluding that the arithmetic did not support the official price and converting dollar reserves into gold directly. Others followed. By March 1968, the pool was selling 100 tonnes in a single trading day against typical weekly volumes of around five tonnes. In the final week of the pool’s operation, approximately 1,000 tonnes of gold were sold in a futile attempt to hold the price. The physical weight of gold being processed in the Bank of England’s weighing room became so great that the floor of that room physically collapsed.
On the evening of March 14, 1968, the London gold market was shut down entirely and an emergency bank holiday declared. When it reopened, two prices for gold existed: the official $35 rate used between central banks and a free market price that immediately exceeded it and continued rising. By 1980, gold traded at $850 per ounce — a 24-fold increase from the defended price.
The sequence is precise: a paper price defended by official selling, physical demand eventually overwhelming that selling capacity, a brief two-tier price system, and then a complete structural repricing. The 1968 collapse was unplanned and chaotic. What China has constructed appears to be the same sequence, deliberately engineered. Understanding gold in the monetary system helps contextualise just how significant these structural shifts can prove to be.
Gold as a Purchasing Power Instrument: What the Numbers Actually Show
The relevance of gold’s price structure extends well beyond trading mechanics. It reaches into the lived experience of purchasing power over decades. Measuring real-world costs in gold ounces, rather than dollars, reveals a dramatically different story about what inflation actually represents.
Purchasing Power Comparison: 1976 vs. 2026
| Asset | 1976 Dollar Price | 2026 Dollar Price | Dollar Increase | 1976 Gold Ounces | 2026 Gold Ounces |
|---|---|---|---|---|---|
| Average new home | ~$44,000 | ~$425,000 | ~10x | ~335 oz | ~106 oz |
| New vehicle | ~$5,400 | ~$50,000 | ~9x | ~43 oz | ~12 oz |
| Weekly groceries (family of 4) | ~$62 | ~$320 | ~5x | ~0.5 oz | ~0.08 oz |
| Gasoline (per gallon) | ~$0.61 | ~$3.79 | ~6x | ~200 gal/oz | ~1,000+ gal/oz |
Note: 1976 gold price approximately $125/oz; 2026 gold price approximately $4,000/oz. All figures are approximations for illustrative purposes.
Measured in dollars, everything became dramatically more expensive over fifty years. Measured in gold, however, the opposite is true. A house that required 335 ounces in 1976 requires roughly 106 today. Groceries that consumed half an ounce per week now consume less than one-tenth.
The framing of rising prices as inflation, as if prices inherently rise over time, obscures the underlying dynamic. Prices did not rise. The unit of measurement lost value. Gold did not. And critically, every one of these calculations uses the paper benchmark price, which, by the structural logic outlined above, may itself be suppressed.
The next major ASX story will hit our subscribers first
Central Bank Behaviour: The Signal That Cannot Be Dismissed
The most empirically observable evidence that institutional actors believe the paper price understates true value is not found in commentary or theory. It is found in central bank purchase records. Notably, central bank gold demand has reached historically unprecedented levels.
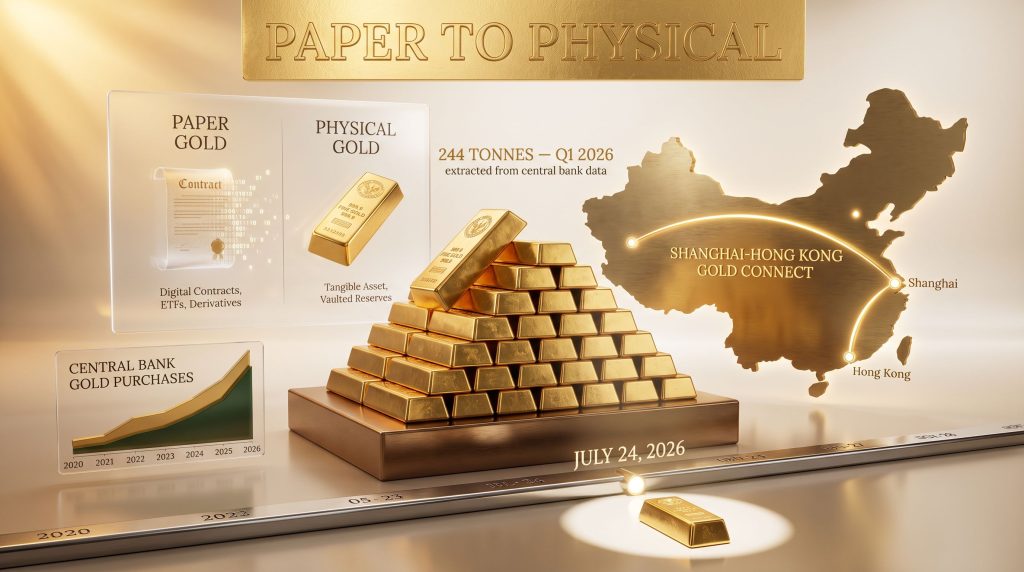
Central banks globally purchased 244 tonnes of gold in Q1 2026, the strongest first-quarter acquisition figure ever recorded. Sustained buying of more than 200 tonnes has occurred in 10 of the last 11 quarters, representing a generational shift in reserve composition strategy.
The World Gold Council openly acknowledges that a significant portion of central bank purchases are never formally declared. Buying occurs, but disclosure does not follow. These same institutions are simultaneously reducing holdings of US Treasury bonds to fund their gold acquisitions.
For the first time in the modern era, gold has surpassed US Treasuries as the largest single asset class in global central bank reserves. Reading that behaviour plainly: the institutions that have held dollar-denominated paper promises for generations are now selling them to acquire physical metal at the fastest sustained pace ever recorded, and they are not publicising those purchases.
China’s Three-Part Physical Infrastructure: Shanghai, Hong Kong, and the Vault Build-Out
The architecture China has assembled to replace paper gold markets consists of three interlocking components, each addressing a different dimension of the transition.
Part One: The Shanghai Gold Exchange. Unlike LBMA and COMEX gold benchmark markets, the Shanghai Gold Exchange operates on a physical delivery requirement. When a trade clears on this exchange, real metal must transfer from one vault to another. The structural impossibility of selling ten claims on one bar means price discovery reflects actual physical availability rather than synthetic contract volume.
Part Two: Hong Kong’s Offshore Bridge. China’s capital controls create friction for international participants seeking direct access to Shanghai’s physically settled prices. Hong Kong’s role in the new architecture is to provide a gateway through which offshore capital can trade against the physically determined Shanghai benchmark, giving international investors access to a price formed by real metal movement rather than paper contracts.
Part Three: Vault Capacity Expansion. London gold vault reserves currently represent the established benchmark for physical storage infrastructure, but Hong Kong is expanding its own gold vault infrastructure from approximately 200 tonnes to more than 2,000 tonnes of storage capacity — a tenfold increase built in advance of the July 24 transition.
A paper market requires no physical infrastructure. Vault space is only necessary when real metal is expected to move. The deliberate construction of storage capacity for 2,000 tonnes of gold, built ahead of the July 24 transition, is an infrastructural commitment that signals intent far more clearly than any policy statement.
It is worth noting that the head of the Shanghai Gold Exchange stated at a London conference in 2014 that gold is consumed in the east but priced in the west, and that China’s growing influence would eventually reveal what the real price is. That statement was made twelve years before the vaults began filling and the paper market began closing.
Two Indicators to Watch as the Transition Unfolds
For those monitoring this structural shift, two publicly observable indicators offer the clearest signal of whether the thesis is materialising.
Indicator One: The Physical Premium Gap. In an efficiently functioning market, a claim on gold and the physical metal itself should trade at the same price. When confidence in the integrity of paper claims erodes, buyers begin paying a premium for verified physical metal. Gold safe-haven dynamics are increasingly reflected in this premium gap, which, for instance, saw physical silver briefly trading at approximately 40% above the paper benchmark price in January 2026.
Indicator Two: Central Bank Reserve Composition. The continued acceleration of gold purchases by central banks, combined with reductions in Treasury holdings and a growing share of undisclosed acquisitions, provides a running institutional consensus view on the relative value of paper and physical assets.
Key Market Signals and What They Indicate
| Signal | Current Status | Threshold to Watch |
|---|---|---|
| Physical gold premium over paper price | Small but present | Sustained gap above 5-10% |
| Central bank gold purchases (quarterly) | 244t in Q1 2026 (record) | Continued acceleration |
| Unreported central bank gold buying | Estimated significant share | Disclosure gaps widening |
| US Treasury holdings as % of reserves | Declining | Continued reduction |
| Shanghai vs. London gold price spread | Emerging | Persistent divergence post-July 24 |
Three Scenarios for What Comes Next
The July 24 transition does not produce a single deterministic outcome. Three scenarios represent the credible range of possibilities.
Scenario One: Orderly Convergence. Physical and paper prices gradually align as the Shanghai benchmark gains international credibility, the premium gap remains narrow, and Western benchmark markets adapt their mechanics to reflect the new competitive pressure from a physically settled alternative. Gold rises, but the transition is measured.
Scenario Two: Accelerated Divergence. A persistent and widening gap emerges between physically settled Asian prices and Western paper benchmarks, creating a two-tier system analogous to the post-1968 official and free market prices. International investors consequently face meaningful basis risk between the price they see quoted and the price at which physical metal changes hands.
Scenario Three: Structural Repricing. Physical demand, amplified by the China paper gold trading shutdown and continued central bank accumulation, overwhelms the price-suppressing effect of paper contract volume in Western markets. Gold undergoes a repricing event that more accurately reflects the metal-to-paper-claim ratio embedded for decades.
Which scenario unfolds will be signalled most clearly by the two indicators outlined above: the physical premium gap and the trajectory of central bank reserve composition.
Frequently Asked Questions: China Paper Gold Trading Shutdown
What exactly is ending on July 24, 2026?
Leveraged synthetic gold instruments, including deferred delivery contracts and spot margin products offered by major Chinese retail banks, are being terminated. These are paper contracts that allowed investors to control positions far larger than their cash deposits.
Can Chinese citizens still buy physical gold after this date?
Yes. Physical gold purchases through Chinese financial institutions remain fully available. The shutdown targets synthetic instruments, not gold ownership itself.
Why did multiple major Chinese banks announce this simultaneously?
The coordination across institutionally distinct banks on an identical timeline and product category suggests upstream policy direction rather than independent consumer protection decisions. Major Chinese banks suspending trading on the Shanghai Gold Exchange further reinforces this interpretation.
What is the Shanghai Gold Exchange and how does it differ from paper gold markets?
The Shanghai Gold Exchange requires physical delivery on trades. Real metal must move between vaults when transactions settle, which prevents the multiplication of paper claims beyond the physical metal available.
Could a two-tier gold pricing system emerge globally?
Historical precedent from 1968 demonstrates this is a structurally possible outcome when official paper prices diverge significantly from physical market demand. The conditions for a similar divergence are more deliberate this time.
How does this affect gold prices for investors outside China?
If Shanghai’s physically settled benchmark gains influence, it introduces a competing price signal to Western paper benchmarks. A persistent spread between the two would represent a material shift in global price discovery.
Is this part of a broader de-dollarisation strategy?
The simultaneous decline of US Treasury holdings in central bank reserves and the acceleration of gold accumulation are consistent with a structural shift in reserve composition, though the specific policy motivations behind individual institutional decisions involve factors beyond what can be confirmed from public data alone.
Key Takeaways
- China’s largest banks are terminating leveraged retail paper gold instruments, not restricting gold ownership itself
- The move concludes a six-year regulatory tightening arc that culminated in coordinated bank-level action across multiple systemically important institutions
- The Shanghai Gold Exchange’s physical delivery requirement creates a fundamentally different price discovery mechanism than London or New York paper markets, where contract volume sets the benchmark
- Central bank gold accumulation reached a record Q1 2026 figure of 244 tonnes, with sustained buying above 200 tonnes in 10 of the last 11 quarters, suggesting institutional conviction about the gap between paper and physical value
- Hong Kong’s vault capacity expansion from 200 to 2,000 tonnes represents a physical infrastructure commitment that paper markets do not require and cannot explain
- Historical precedent from the 1968 London Gold Pool collapse demonstrates precisely how official paper prices and physical market prices can diverge when real demand exceeds synthetic supply management capacity
- Two observable indicators — physical premiums over paper prices and central bank reserve composition shifts — offer publicly accessible ways to monitor whether the thesis is materialising in real time
Disclaimer: This article is for informational and educational purposes only and does not constitute financial advice. The scenarios, historical comparisons, and analytical frameworks presented involve forward-looking assessments and speculative analysis. Past performance of any asset, including gold, is not indicative of future results. Readers should conduct their own research and consult qualified financial advisers before making investment decisions.
Want to Track the Next Major Mineral Discovery Before the Market Moves?
Discovery Alert’s proprietary Discovery IQ model delivers real-time alerts on significant ASX mineral discoveries, transforming complex data across 30+ commodities into clear, actionable insights for investors at every level — explore historic examples of exceptional discovery returns and begin your 14-day free trial today to position yourself ahead of the market.