July 29, 2026
The Copper Supercycle Is Reshaping How the World's Largest Miners Are Valued
For most of the past two decades, diversified mining giants were judged almost exclusively through the lens of iron ore. The commodity that built modern infrastructure, fed Chinese urbanisation, and funded record dividends defined the sector's fortunes. However, something structural is shifting beneath the surface of that narrative. Copper, long treated as a secondary revenue stream for major producers, is now challenging iron ore's dominance in earnings composition, capital allocation, and long-term strategic positioning.
The Rio Tinto half-year results driven by copper growth in H1 2026 offer perhaps the most compelling evidence yet that this shift is not cyclical. It is architectural. Understanding what these numbers reveal, and what they signal beyond the immediate reporting period, requires looking at the mechanics of how copper is transforming the economics of large-cap mining. Furthermore, the copper price growth drivers underpinning this transformation extend well beyond short-term price movements.
When big ASX news breaks, our subscribers know first
Rio Tinto H1 2026 Financial Performance: Key Metrics at a Glance
Before examining the strategic implications, it is worth grounding the analysis in the headline numbers. The H1 2026 results delivered a sequence of beats across virtually every key metric.
| Financial Metric | H1 2026 Result | Market Consensus | Variance |
|---|---|---|---|
| Underlying Profit | US$6.7 billion | Below actual | +~3% beat |
| Copper Earnings | US$5.7 billion | Below actual | +9% beat |
| Iron Ore Earnings | US$6.8 billion | Largest segment | Dominant |
| Free Cash Flow | US$3.8 billion | US$2.2 billion | +73% beat |
| Interim Dividend | US$2.11/share | US$2.04/share | +3% beat |
| Effective Tax Rate | 25.5% | Higher anticipated | Below forecast |
| Share Price Response | US$167.20 | — | +5% movement |
Underlying profit reached US$6.7 billion, representing a 47% increase compared to the prior corresponding period. That figure alone would have constituted a strong result, but the more remarkable data points are found in the free cash flow and copper earnings columns.
What Drove the 84% Surge in Copper Earnings?
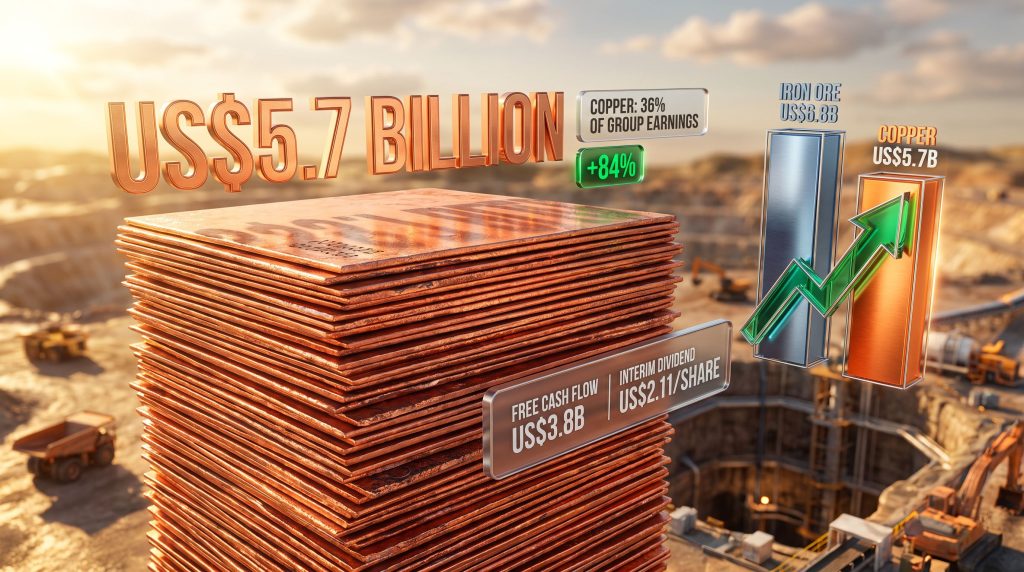
Copper earnings of US$5.7 billion represent an 84% year-on-year increase and exceeded analyst forecasts by 9%. To contextualise the scale of that outperformance: a 9% beat in earnings for a segment generating billions of dollars in half-year profit is an exceptional deviation from consensus in the mining sector, where asset performance is typically well-modelled by institutional analysts.
The primary volume driver behind this result is the underground ramp-up at Oyu Tolgoi in Mongolia, where copper production rose 31% year on year in the first half of 2026. Total group copper output reached 442 kt for the period, up approximately 1% year on year, with Oyu Tolgoi accounting for the bulk of incremental volume growth. Oyu Tolgoi developments have consequently become a focal point for analysts tracking Rio Tinto's long-term copper ambitions.
Oyu Tolgoi: A Geological Giant Entering Its Prime
What makes Oyu Tolgoi particularly significant from a geological and operational standpoint is the nature of its underground ore body. The Hugo North underground deposit, which entered commercial production in 2023 after years of development delays and cost overruns, hosts some of the highest-grade large-scale copper ore in the world. Underground mining at Oyu Tolgoi utilises block caving, a mass mining method that, once fully established, delivers remarkably low unit costs relative to the volume of ore processed.
Block caving involves undercutting an ore body and allowing gravity to progressively collapse and fragment rock downward into collection drives. It is capital-intensive to establish but operationally efficient at scale, and it is uniquely suited to Oyu Tolgoi's ore geometry. As the cave propagates further through the deposit in coming years, throughput volumes and copper recovery rates are expected to continue improving. This is not a mine nearing maturity. It is a mine entering its most productive phase.
Full-year 2026 copper production guidance remains unchanged at 800 to 870 kt, a signal that the operational trajectory at Oyu Tolgoi is tracking in line with or ahead of internal planning.
Production Snapshot: H1 2026 Copper Division
- Total copper output: 442 kt (+1% year on year)
- Oyu Tolgoi contribution: +31% year on year
- Copper-equivalent production across the group: +3% in H1 2026
- Full-year 2026 copper guidance: Unchanged at 800 to 870 kt
- Copper as a share of group earnings: 36%
Free Cash Flow of US$3.8 Billion: Why the Beat Matters More Than the Number
The free cash flow result of US$3.8 billion deserves particular attention. Market consensus had this figure at US$2.2 billion, while RBC Capital Markets had a forecast of approximately US$1.7 billion. The actual result exceeded even the more optimistic of these estimates by a substantial margin.
Two forces converged to produce this outcome. First, the underlying earnings strength across the copper and iron ore segments generated higher operating cash flows than modelled. Second, the effective tax rate of 25.5% came in meaningfully below expectations, which had anticipated a higher tax burden given the earnings mix across Rio Tinto's operating jurisdictions. A lower tax rate flowing through to post-tax earnings directly amplifies the cash available for distribution, reinvestment, and debt management.
"A free cash flow result that is 73% above market consensus is not a rounding error. It reflects either a fundamental underestimation of earnings quality or a structural advantage in the group's cost and tax position that markets had not fully priced."
This cash generation provides Rio Tinto with significant optionality entering the second half of 2026. Capital allocation decisions, including whether to accelerate investment in copper growth assets, return additional cash to shareholders, or pursue strategic acquisitions, will be closely watched by institutional investors. In addition, the Rio Tinto copper expansion strategy suggests the group is positioning deliberately for a sustained period of copper-led earnings growth.
Rio Tinto's Dividend Strategy: What US$2.11 Per Share Signals
The interim dividend of US$2.11 per share exceeded the RBC Capital Markets forecast of US$2.04 per share by approximately 3%. While the absolute differential is modest, the directional signal matters. Rio Tinto's payout policy is tied to underlying earnings and free cash flow generation, meaning that a dividend beat in this context reflects genuine financial outperformance rather than a discretionary uplift.
For income-oriented investors, the combination of a free cash flow result materially above consensus and a dividend that tracks the upper bound of expectations creates a compelling short-term narrative. For long-term holders, the more important question is whether this payout trajectory is sustainable and whether copper's growing earnings contribution provides a more durable foundation for shareholder returns than iron ore's cyclically sensitive pricing dynamics.
Iron Ore vs. Copper: A Structural Shift in Earnings Composition
Iron ore contributed US$6.8 billion to group earnings in H1 2026, representing 43% of the total, retaining its position as the single largest segment. However, the pace at which copper is closing that gap is the more important variable for long-term portfolio analysis. Furthermore, China iron ore demand faces mounting headwinds from the property sector slowdown, which adds further weight to the copper earnings growth narrative.
| Segment | H1 2026 Earnings | Share of Group Earnings |
|---|---|---|
| Iron Ore | US$6.8 billion | 43% |
| Copper | US$5.7 billion | 36% |
| Gap | US$1.1 billion | 7 percentage points |
Two years ago, the gap between these segments was considerably wider. The convergence reflects both the structural growth of the copper division and the relative softness of iron ore demand, which faces headwinds from China's property sector slowdown and a gradual peak in steel-intensive infrastructure spending.
"If copper earnings continue compounding at current rates while iron ore faces sustained pricing pressure from weaker Chinese demand, copper could realistically displace iron ore as the group's largest earnings contributor within two to three reporting cycles. This is a speculative projection, not a confirmed forecast, and is subject to commodity price movements, production outcomes, and macroeconomic variables."
The next major ASX story will hit our subscribers first
The Macro Context: Why Copper Demand Is Structurally Different From Prior Cycles
The copper demand thesis underpinning these results is not simply a price story. It is a structural intensification story rooted in the physical requirements of the global energy transition. Each electric vehicle requires roughly four times more copper than a comparable internal combustion engine vehicle. High-voltage transmission lines, grid-scale battery storage systems, offshore wind turbines, and data centre power infrastructure are all copper-intensive in ways that earlier industrial demand cycles were not.
| Demand Driver | Copper Intensity Impact | Timeline |
|---|---|---|
| Electric Vehicle Adoption | ~4x more copper per EV vs ICE vehicle | 2025 to 2040 |
| Grid Infrastructure Expansion | High-voltage transmission lines | 2025 to 2035 |
| Renewable Energy Buildout | Wind and solar require significant copper wiring | Ongoing |
| Data Centre Growth | Power infrastructure and cooling systems | Near-term |
On the supply side, the copper supply crunch is gaining traction among analysts. Declining ore grades at established copper mines globally, combined with a multi-year lag between exploration discovery and production, suggest that new copper supply will struggle to keep pace with demand growth through the 2030s. This dynamic underpins the long-term price floor that is making copper earnings increasingly defensive despite the commodity's historical volatility.
The Grade Decline Problem in Global Copper Mining
A detail often overlooked in headline analysis is the secular decline in head grades at the world's major copper operations. Average copper ore grades globally have fallen from above 1.5% copper decades ago to below 0.7% in many large open-pit operations today. This means more rock must be processed to produce the same quantity of refined copper, driving up energy consumption, water usage, and unit costs.
Oyu Tolgoi's underground ore, by contrast, hosts grades that are substantially higher than the global average for large-scale operations. This grade advantage is a critical but underappreciated differentiator, as it directly translates into lower cost intensity per tonne of copper produced and higher margins at equivalent copper prices.
Underlying EBITDA and Operating Cash Flow: Contextualising Scale
Group underlying EBITDA reached approximately US$11.5 billion in H1 2026, situating Rio Tinto firmly among the world's highest-generating mining enterprises in the period. Operating cash flow of US$6.9 billion reinforces the capacity for sustained reinvestment and shareholder distributions simultaneously, without requiring balance sheet leverage.
For context, generating US$6.9 billion in operating cash flow in a single half-year reporting period provides a reinvestment runway that few global competitors can match. This scale advantage matters in a capital-intensive sector where the barriers to building world-class copper assets are measured in billions of dollars and decades of development.
Watch Points for H2 2026 and Beyond
Investors monitoring the Rio Tinto half-year results driven by copper growth trajectory through the remainder of 2026 and into 2027 should focus on several key variables:
-
Oyu Tolgoi ramp-up continuity: Whether underground throughput and recovery rates continue improving in line with the block cave development schedule will be the single most important operational determinant of copper earnings growth.
-
Iron ore price sensitivity: Chinese steel demand conditions and the trajectory of the property sector remain the key macro variable for the group's largest earnings segment. Any material deterioration would compress the iron ore contribution and test whether copper growth can offset the shortfall.
-
Capital allocation decisions: With free cash flow materially exceeding expectations, the strategic question of how management deploys surplus cash, whether through accelerated copper investment, M&A activity, or enhanced shareholder returns, will shape market sentiment in H2 2026.
-
Tax rate normalisation: The below-consensus effective tax rate was a meaningful contributor to the free cash flow beat. Investors should assess whether this represents a structural advantage in Rio Tinto's jurisdictional earnings mix or a timing-related outcome that may not repeat in H2.
-
Copper price movements: While the demand thesis is structurally sound, near-term copper prices remain sensitive to macro sentiment, US dollar strength, and Chinese industrial activity readings. Tracking global copper price benchmarks provides useful context for evaluating future earnings sensitivity.
Frequently Asked Questions: Rio Tinto Half-Year Results and Copper Growth
What was Rio Tinto's underlying profit for H1 2026?
Rio Tinto recorded underlying profit of US$6.7 billion for the first half of 2026, a 47% increase on the prior corresponding period, exceeding market consensus by approximately 3%.
How much did copper earnings grow in H1 2026?
Copper earnings rose 84% to US$5.7 billion, beating analyst forecasts by 9%. Copper now represents 36% of group earnings, its highest share in the company's recent history.
What drove the copper production increase?
The underground ramp-up at Oyu Tolgoi in Mongolia was the primary driver, with that asset delivering a 31% year-on-year increase in copper output. Total group copper production reached 442 kt in H1 2026.
What is the full-year 2026 copper production guidance?
Rio Tinto maintained its full-year guidance at 800 to 870 kt, unchanged from prior guidance, indicating confidence in the operational performance of its copper portfolio.
Why was free cash flow so much higher than expected?
Free cash flow of US$3.8 billion significantly exceeded consensus of US$2.2 billion, driven by stronger-than-anticipated earnings, disciplined cost management, and an effective tax rate of 25.5% that came in below expectations.
How did the dividend compare to forecasts?
The interim dividend of US$2.11 per share was approximately 3% above the consensus estimate of US$2.04, reflecting the group's strong earnings performance and cash generation in the period.
Disclaimer: This article contains forward-looking analysis and scenario projections that involve assumptions about future commodity prices, production outcomes, and macroeconomic conditions. These projections are speculative and do not constitute financial advice. Investors should conduct independent research and seek professional guidance before making investment decisions.
Want to Identify the Next Major Copper Discovery Before the Market Does?
Discovery Alert's proprietary Discovery IQ model delivers real-time alerts the moment significant ASX mineral discoveries are announced, transforming complex geological data into actionable investment insights — as the copper supercycle continues to reshape the sector's largest valuations. Explore historic discovery returns on Discovery Alert's discoveries page and begin your 14-day free trial to position yourself ahead of the market.