July 27, 2026
Copper's New Identity: From Industrial Metal to Geopolitical Instrument
Few commodities have undergone a more profound reputational shift in recent years than copper. For most of modern industrial history, copper was treated as a reliable but unremarkable workhorse metal, its price cycles tied to construction booms and manufacturing output. That characterisation is becoming obsolete. As electrification reshapes the global economy, copper has quietly transitioned into something closer to a strategic asset, one whose geographic concentration, refining bottlenecks, and demand trajectory now sit at the centre of energy security debates in Washington, Brussels, Beijing, and Canberra.
Understanding who dominates global copper supply requires looking beyond mine output alone. The copper value chain has two distinct power centres, and they are controlled by different countries. This structural asymmetry is what makes copper's geopolitical profile so complex, and so consequential. Furthermore, exploring copper investment strategies is becoming increasingly relevant as this dynamic evolves.
When big ASX news breaks, our subscribers know first
How Global Copper Production Is Actually Structured
The copper supply chain operates across two largely separate tiers. The first involves extracting copper ore and concentrate from the ground. The second involves transforming that raw material into refined copper cathodes through smelting and electrolytic refining processes. These cathodes are the globally traded standard product, and it is at this second tier where true industrial pricing power resides.
Critically, the countries that lead in mining are not always the same countries that lead in refining. This decoupling creates dependency structures that expose downstream industries to layered, compounding risks.
Global Mine Production: The 2025 Baseline
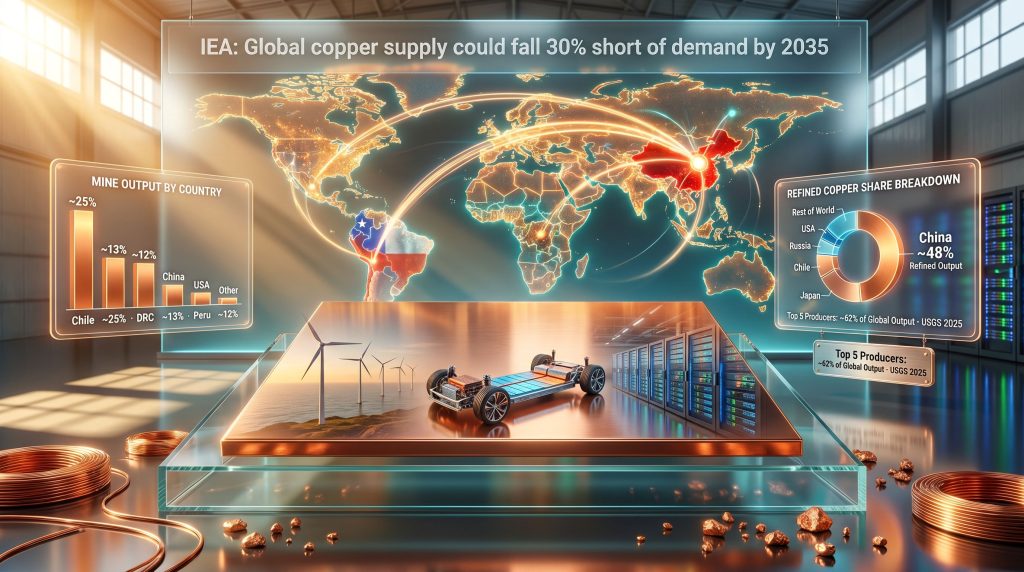
According to data from the U.S. Geological Survey, global primary copper production reached approximately 23 million metric tons in 2025. The five largest producing nations collectively supplied around 14.3 million metric tons, representing roughly 62% of global output.
| Country | Estimated Mine Output (2025) | Share of Global Total |
|---|---|---|
| Chile | ~5.7 million metric tons | ~25% |
| Democratic Republic of Congo | ~3.0 million metric tons | ~13% |
| Peru | ~2.8 million metric tons | ~12% |
| China | ~1.9 million metric tons | ~8% |
| Russia | ~0.9 million metric tons | ~4% |
| Top 5 Combined | ~14.3 million metric tons | ~62% |
| Global Total | ~23 million metric tons | 100% |
Source: U.S. Geological Survey (USGS), 2025 estimates
Secondary producers with growing strategic relevance include the United States, Zambia, Australia, and Indonesia. While each contributes meaningfully to global volumes, none yet approaches the scale of the top five. Understanding the largest copper mines helps illustrate why production remains so geographically concentrated.
Refined Copper: Where Market Power Is Concentrated
The refined copper picture is even more concentrated than mine output. Refined copper, produced through smelting and electrolytic processing, is where industrial value is captured and where supply disruptions carry the greatest downstream consequences.
| Country | Refined Copper Output (2025 est.) | Share of Global Refined Total |
|---|---|---|
| China | ~14 million metric tons | ~48% |
| Democratic Republic of Congo | ~2.8 million metric tons | ~10% |
| Chile | ~1.6 million metric tons | ~6% |
| Japan | ~1.5 million metric tons | ~5% |
| Global Refined Total | ~29 million metric tons | 100% |
China alone accounts for nearly half of all refined copper produced globally, despite ranking only fourth in mine production. According to UNCTAD data, China imports approximately 60% of copper ore produced worldwide to feed its domestic smelting infrastructure. This is not a coincidence of geography but the product of decades of deliberate industrial policy.
Key structural insight: The country that mines the most copper is Chile. The country that refines the most copper is China. The country with the broadest control over the overall copper supply chain, from upstream access to downstream processing, is also China.
Country-by-Country: The Major Players Examined
Chile: The Mining Giant With Structural Headwinds
Chile's copper importance to global markets stems from the extraordinary geology of the Atacama Desert, home to some of the world's highest-grade copper deposits. Flagship operations including Escondida, jointly operated by BHP and Rio Tinto, and Collahuasi, produce volumes that no single mine complex elsewhere can match. Codelco, Chile's state-owned copper enterprise, functions as a sovereign production vehicle and remains the world's largest single copper producer by corporate entity.
Yet Chile faces a set of structural challenges that are gradually eroding its competitive position:
- Ore grades at existing deposits are declining, requiring greater energy and water inputs to extract equivalent copper volumes
- Water scarcity in the Atacama is intensifying, creating operational constraints that are difficult to engineer around
- Energy transition costs are rising as operations shift toward renewable power sources to meet emissions targets
- Labour disputes and community relations remain persistent friction points for project development and operations
Despite holding roughly 25% of global mine output, Chile's role in refined copper production is comparatively modest, leaving it exposed to the processing leverage held by downstream refining nations.
China: The Refining Superpower
China's position in global copper is unlike any other nation's in any other commodity market. It built the world's largest copper refining infrastructure not by being the world's largest copper miner, but by systematically acquiring the processing capacity to transform other nations' ore into market-ready product. At approximately 48% of global refined copper output, China's smelting dominance gives it leverage over copper pricing and availability that operates independently of its mining output.
Chinese state-linked enterprises including Zijin Mining and CMOC (China Molybdenum) have expanded aggressively into copper-producing regions across Africa and Latin America, securing upstream concentrate supply to feed domestic refining operations. This vertical integration strategy — controlling the refining bottleneck while simultaneously securing upstream feed material — represents one of the most consequential resource strategies of the past two decades.
The Belt and Road Initiative has functioned as a financing and infrastructure mechanism enabling Chinese enterprises to access copper assets in the DRC, Zambia, Peru, and beyond, creating long-term supply security for Chinese smelters that Western competitors have struggled to replicate.
The Democratic Republic of Congo: Africa's Copper Powerhouse
The DRC occupies a unique position in global copper markets. It is simultaneously the second-largest copper mining nation by mine output and the second-largest refined copper producer globally, with estimated refined production of approximately 2.8 million metric tons. This relative downstream development distinguishes the DRC from most other African mining nations, which predominantly export concentrate rather than finished metal.
The Kamoa-Kakula mine complex, developed by Ivanhoe Mines in partnership with Zijin Mining, is widely regarded as one of the highest-grade large-scale copper deposits discovered in recent decades. Its rapid production ramp-up has materially altered the DRC's trajectory as a global copper supplier. However, recent operational disruptions at Kamoa-Kakula have introduced uncertainty into 2026 production forecasts and contributed directly to downward revisions in global supply growth estimates.
Peru: Third-Largest Producer, Persistent Vulnerabilities
Peru's copper sector, anchored by major operations including Las Bambas, Antamina, and Cerro Verde, makes it the world's third-largest mine producer. However, Peru's downstream processing capacity remains limited, with most of its copper ore exported as concentrate for refining elsewhere.
Community conflict, permitting delays, and political instability represent structural risks that have periodically disrupted output at even Peru's most established operations. Las Bambas in particular has experienced repeated production interruptions linked to land access disputes with surrounding communities, illustrating how social licence challenges can translate directly into global supply risk.
Russia and Secondary Producers
Russia's copper output of approximately 0.9 million metric tons is primarily generated through Norilsk Nickel's operations in Siberia. Western sanctions imposed following the 2022 invasion of Ukraine have introduced new complexities into the movement of Russian copper concentrate through global trade channels, adding a geopolitical dimension to what was previously treated as a purely commercial supply source.
Australia, Zambia, Indonesia, and the United States represent the next tier of producers with meaningful expansion potential, though each faces its own combination of geological, regulatory, and infrastructure constraints.
Supply Security Risks: What Could Disrupt the Market?
Production Forecast Downgrades and Tier-One Asset Disruptions
The International Copper Study Group (ICSG) published revised forecasts in April 2026, lowering the global production growth estimate for 2026 to approximately 1.6%, down from an initial projection of 2.3%. The revision was driven by downward adjustments in expected output from DRC and Chilean operations, with specific reference to disruptions at the Grasberg mine in Indonesia, operated by Freeport-McMoRan, and the Kamoa-Kakula complex in the DRC.
Supply Risk Snapshot (2026):
- Global production growth forecast revised to ~1.6% (from 2.3%) — ICSG, April 2026
- Top 5 producers control ~62% of global mine output — USGS, 2025
- China processes ~60% of global copper ore imports — UNCTAD
What makes these revisions particularly significant is that Grasberg and Kamoa-Kakula are not marginal operations. They are tier-one assets whose output moves global supply balances. When production at mines of this scale underperforms, the effects ripple through spot markets and forward pricing curves.
The Ore Grade Decline Problem
One of the least discussed but most consequential long-term challenges facing copper supply is the secular decline in average ore grades at existing mines worldwide. As the highest-grade portions of known deposits are extracted first, miners are progressively working lower-grade material, which requires more energy, more water, and greater capital intensity to produce equivalent copper volumes.
This is not a near-term crisis, but it is a structural pressure that is gradually increasing the cost floor for copper production globally. New deposits capable of offsetting grade decline at existing operations are becoming harder to find, more expensive to develop, and subject to longer permitting timelines.
Resource Nationalism and Trade Policy Risk
The trend toward resource nationalism — encompassing export levies, mandatory in-country processing requirements, and increased state ownership — is accelerating across copper-producing nations. Chile and Peru are both navigating evolving regulatory environments that affect the economics of foreign investment in their mining sectors.
China's control over refining infrastructure represents a potential lever in trade disputes that Western policymakers are only beginning to take seriously. The copper equivalent of rare earth export restrictions is theoretically possible, and the concentration of refining capacity in a single jurisdiction makes the downstream industrial base of copper-importing nations structurally exposed. Indeed, the emerging copper supply crunch is compounding these geopolitical pressures significantly.
The Coming Demand Gap: Why Supply Pressure Will Intensify
Electrification, Renewables, and AI Infrastructure
The demand trajectory for copper is structurally different from the cyclical patterns that characterised the metal's market history. Three converging forces are driving a multi-decade demand uplift:
- Electric vehicles consume approximately 3 to 4 times more copper than equivalent internal combustion engine vehicles, and EV adoption is accelerating across major markets
- Offshore wind turbines require up to 9.5 tonnes of copper per megawatt of installed capacity, making them among the most copper-intensive pieces of infrastructure being built at scale today
- AI-linked data centres are an emerging and rapidly scaling demand category, with the buildout of hyperscale computing infrastructure creating new requirements for copper wiring, cooling systems, and power distribution equipment
- Grid modernisation represents the largest aggregate copper demand driver, as aging transmission and distribution networks across North America, Europe, and Asia require comprehensive upgrades to accommodate renewable energy and bidirectional power flows
The IEA's 30% Deficit Warning
The International Energy Agency has projected that under accelerated energy transition scenarios, global copper supply could fall approximately 30% short of projected demand requirements by 2035. This figure is striking not only for its magnitude but for its timeline: new mine development from exploration to production typically spans 10 to 20 years, meaning that projects approved today may not deliver meaningful output until the early 2030s at the earliest.
| Demand Driver | Base Case Impact | Accelerated Transition Impact |
|---|---|---|
| Electric Vehicles | Moderate demand uplift | Significant (3-4x copper vs. ICE vehicles) |
| Power Grid Upgrades | Steady incremental growth | Surge demand for transmission infrastructure |
| Renewable Energy | Gradual ramp | Exponential (offshore wind highly copper-intensive) |
| AI and Data Centres | Emerging demand category | Rapidly scaling new demand vector |
| Projected Supply Gap by 2035 | ~10-15% | ~30% (IEA estimate) |
The pipeline of committed new copper projects is currently insufficient to close this projected gap, making the supply-demand imbalance one of the most significant commodity market structural tensions on the horizon. Furthermore, the IEA notes that copper prices have already hit record highs whilst smelters face mounting strategic pressures.
Africa's Role in the Future Supply Equation
The Central African Copper Belt
The geological formation spanning the DRC and Zambia, commonly referred to as the Central African Copper Belt, represents one of the richest concentrations of copper mineralisation on Earth. The DRC's production trajectory, already at approximately 3 million metric tons of mine output in 2025, is expected to continue growing as additional phases of Kamoa-Kakula and other projects advance.
Zambia copper growth ambitions are substantial, with plans to expand output through new project development and rehabilitation of previously shuttered mining operations. Separately, Angola and Namibia are emerging as new entrants to the African copper conversation, with exploration pipelines that could contribute incremental supply over the medium term.
The Infrastructure Constraint
Africa's ability to convert its geological endowment into production at scale is significantly constrained by infrastructure deficits. Inadequate rail networks, unreliable grid power, and limited port capacity all compress the economic viability of mining projects that might otherwise be developed. This infrastructure gap is not simply a development challenge; it is a direct factor in determining how quickly African copper supply can respond to global demand signals.
Chinese investment in African copper processing and associated infrastructure has partially addressed these constraints in specific corridors, though this creates its own dependency dynamics for host nations.
The Beneficiation Debate
A persistent policy tension across African copper-producing nations involves the choice between exporting raw concentrate and investing in domestic processing capacity. The DRC, as a partial exception with its relatively developed refining infrastructure, illustrates what is possible when processing investment accompanies extraction. For most other African producers, however, the value-addition opportunity remains largely unrealised, with economic benefits flowing disproportionately to the nations that smelt and refine the ore rather than those that extract it.
The next major ASX story will hit our subscribers first
The Great Power Competition for Copper Access
China's Vertically Integrated Strategy
China's approach to copper security reflects a systematic logic: control the refining bottleneck, then secure the upstream feed through overseas asset acquisition and infrastructure investment. Zijin Mining and CMOC have built substantial African copper portfolios, while Chinese financing has enabled infrastructure development that ties concentrate flows into Chinese processing networks. This strategy is currently the most comprehensive and best-executed approach to copper supply security of any major power.
Western Responses and Their Limitations
The United States, European Union, and Japan are all pursuing copper supply chain diversification, though from a structurally weaker position than China. Relevant policy frameworks include:
- The US Inflation Reduction Act, which contains provisions incentivising non-Chinese critical mineral supply chains
- The EU Critical Raw Materials Act, which classifies copper as a strategic raw material and sets supply diversification benchmarks
- Japan's long-term smelting relationships with Chilean and Indonesian producers, representing one of the few non-Chinese refining partnerships of meaningful scale
- Australia's critical minerals strategy, which includes efforts to attract copper processing investment as part of a broader value-chain participation agenda
The fundamental challenge for Western-aligned nations is that building alternative refining capacity takes time and capital, and China's head start — measured in decades of infrastructure investment and upstream asset acquisition — is not easily overcome through policy alone.
Frequently Asked Questions: Global Copper Supply
Which country produces the most copper in the world?
Chile is the world's largest copper mining nation, producing approximately 5.7 million metric tons in 2025, representing around 25% of global mine output, according to USGS data.
Which country dominates copper refining?
China dominates global copper refining, producing approximately 14 million metric tons of refined copper in 2025, nearly 48% of the global refined total of 29 million metric tons.
How much copper ore does China import?
According to UNCTAD data, China imports approximately 60% of globally produced copper ore, feeding its massive domestic smelting and refining infrastructure.
What is the projected copper supply deficit by 2035?
The International Energy Agency estimates that under accelerated energy transition scenarios, global copper supply could fall approximately 30% short of projected demand requirements by 2035.
Why was the 2026 copper production growth forecast revised downward?
The ICSG lowered its 2026 global production growth forecast from approximately 2.3% to 1.6%, citing operational disruptions and reduced output guidance at major assets including Grasberg in Indonesia and Kamoa-Kakula in the DRC.
Why is the DRC important to global copper supply?
The DRC is both the second-largest copper mining nation and the second-largest refined copper producer globally, with estimated refined output of approximately 2.8 million metric tons. The Kamoa-Kakula mine complex is among the world's highest-grade large-scale copper deposits.
Key Takeaways: The Structural Reality of Who Dominates Global Copper Supply
- Mine production is geographically concentrated with the top five producers accounting for approximately 62% of global output (USGS, 2025)
- Refining power is even more concentrated, with China alone processing nearly half the world's refined copper
- The supply chain has two distinct power centres: Chile dominates mining; China dominates processing
- Demand is structurally accelerating across electric vehicles, energy infrastructure, and AI data centre buildout
- The IEA's 30% supply deficit projection by 2035 represents one of the most significant commodity market imbalances currently visible on the horizon
- Africa's copper belt, particularly the DRC and Zambia, represents the most significant near-term opportunity for supply diversification
- Geopolitical competition for copper access is intensifying, with China's vertically integrated strategy currently holding a structural advantage over Western diversification efforts
For ongoing coverage of African mining, energy transition commodities, and resource geopolitics across emerging markets, visit Ecofin Agency.
Want to Know When the Next Major Copper Discovery Hits the ASX?
Discovery Alert's proprietary Discovery IQ model scans ASX announcements in real time, instantly identifying significant copper and critical mineral discoveries before the broader market reacts — turning complex geological data into clear, actionable investment insights. Start your 14-day free trial at Discovery Alert and explore how historic mineral discoveries have generated extraordinary returns for investors who moved early.