
June 12, 2026
Why the Dollar's Decline Is a Monetary Story, Not a Market Story
Most financial commentary frames rising commodity prices as a sector-specific phenomenon driven by supply constraints, geopolitical disruption, or shifting demand curves. That framing misses the deeper structural dynamic at work. When the entire commodity complex moves higher simultaneously, the more analytically precise explanation is not that all commodities are suddenly scarce. It is that the unit of account used to price them is losing purchasing power.
Understanding this distinction is the foundation upon which a coherent investment framework for gold, silver, and resource equities must be built. This is the core of the analytical lens offered by Alasdair Macleod on gold silver and dollar collapse, a framework that has gained significant traction among macro investors navigating the current environment. His approach is not bearish on commodities. It is bearish on the dollar itself, and that distinction carries profound implications for portfolio construction.
When big ASX news breaks, our subscribers know first
The Financialisation Problem: How U.S. Equities Became Structurally Overvalued
The 1983 Inflection Point and Its Long Shadow
To understand the fragility of today's equity market, it helps to trace the structural changes that began in the early 1980s. The gradual erosion of the functional separation between commercial and investment banking around 1983 to 1985 opened the door for capital to flood into equity markets at a scale and velocity previously constrained by regulatory architecture. Banks became market makers, investment banks, and equity participants simultaneously.
The downstream effect over four decades has been a progressive divergence between the earnings yield on the S&P 500 and the yield on the long bond. That divergence has now reached an extreme that, by some analytical measures, exceeds the overvaluation seen in the lead-up to the 1929 crash. That is not a minor observation. It suggests that the current repricing risk in U.S. equities is not cyclical but structural.
| Era | Key Structural Shift | Market Impact |
|---|---|---|
| 1983 to 1985 | Commercial and investment banking distinctions eroded | Capital flooded into equity markets |
| 1990s to 2000s | Leverage expansion via repo and broker loans | Inflated asset valuations |
| 2008 to 2015 | Post-GFC QE cycles | Suppressed yields, inflated equity multiples |
| 2020 to Present | Pandemic-era money creation | Record equity-to-bond yield divergence |
The $8 Trillion Collateralized Debt Problem
The equity market's vulnerability is not merely a valuation story. It is also a leverage story. The scale of credit supporting current equity prices creates a forced-selling dynamic that can accelerate any downturn into something more severe than a conventional correction.
Consider the structural exposure:
- Hedge fund borrowing through banks and repo markets is estimated at approximately $7 trillion
- FINRA-recorded broker loans represent an additional $1.2 trillion
- Foreign investor holdings in U.S. equities are estimated at $21 to $22 trillion
This means that more than $8 trillion in collateralized debt sits beneath the current equity structure. If long bond yields rise decisively above 5% across the curve from the 10-year maturity onward, equity valuations built on cheap credit face a repricing that is not a cyclical event. Foreign capital, holding trillions in U.S. equity exposure, may attempt to exit simultaneously, compounding domestic deleveraging pressure.
The distinction between a cyclical correction and a structural repricing event lies in the leverage architecture beneath the market. When forced sellers outnumber discretionary buyers, price discovery becomes disorderly.
The Debt Trap: Why Quantitative Easing Is the Only Political Option
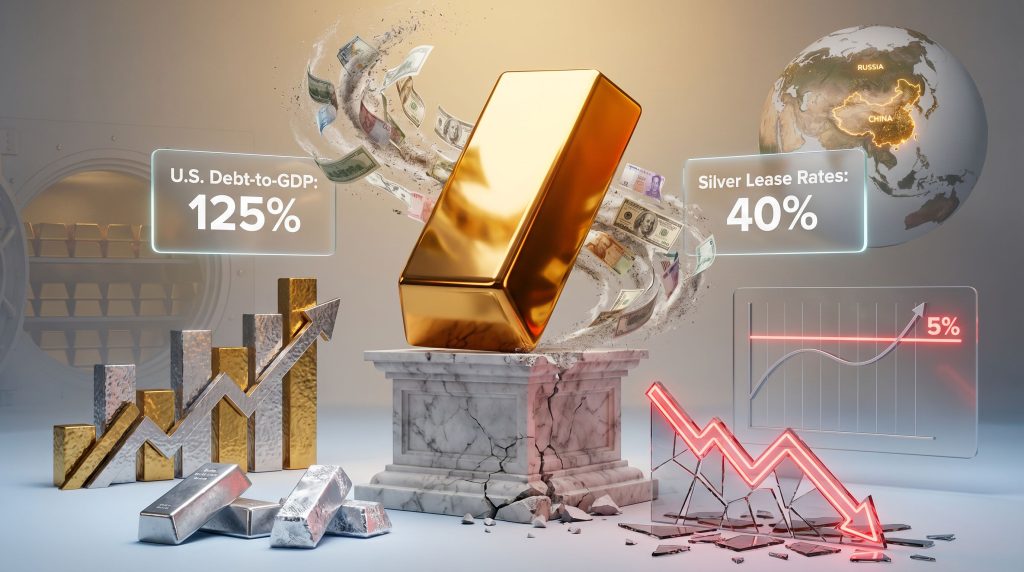
U.S. Government Debt-to-GDP at 125%: The Arithmetic of No Exit
With U.S. government debt-to-GDP at approximately 125%, the federal government is already operating in a zone where conventional debt management strategies are increasingly constrained. In an environment of slowing economic growth driven by geopolitical disruption, the fiscal dynamics deteriorate further through a familiar feedback loop:
- Economic slowdown reduces tax revenues across income, corporate, and capital gains categories
- Welfare and transfer payments expand automatically as unemployment rises
- The budget deficit widens sharply, requiring increased Treasury issuance
- Rising supply of Treasuries competes with existing holdings, pushing yields higher
- Higher yields increase debt service costs, expanding the deficit further
- Political pressure mounts for the Federal Reserve to intervene through asset purchases
The endpoint of this sequence is quantitative easing, not as a policy choice but as a political inevitability. When a sovereign issuer controls its own currency, formal default is not the mechanism of loss. The loss is transferred to currency holders through purchasing power erosion. Bondholders receive nominal repayment, however the real value of that repayment is quietly diminished.
Why Central Banks Cannot Go Bankrupt, But Their Currencies Can
A critical technical distinction that most investors overlook is that central banks operate under a different solvency framework than commercial entities. The Bank of Japan currently carries liabilities that substantially exceed its balance sheet equity, a condition that would render any private sector institution insolvent. Yet the Bank of Japan continues to function. The mechanism is simple: central banks can recapitalise themselves by creating currency.
This structural feature means that while central banks themselves will not fail in a formal sense, the currencies they issue can lose purchasing power without limit. There is no automatic circuit breaker. The discipline historically provided by the end of the gold standard, when the Bretton Woods system was abandoned in 1971, removed the only meaningful constraint on currency creation. Since that point, the only governor on money supply has been political will, a notoriously unreliable check.
Gold as Final Settlement: 2,600 Years of Legal Precedent
The Legal Lineage Investors Rarely Trace
Most contemporary investors treat gold as a commodity with monetary characteristics. This framing understates its legal and historical status considerably. The recognition of physical gold as final settlement under Roman law dates to approximately 450 BC, codified in what Roman legal tradition refers to as the Twelve Tables. This foundational legal principle was subsequently elaborated through centuries of Roman jurisprudence, consolidated in Justinian's Pandects around 550 AD.
Furthermore, through Portuguese, Spanish, British, and Dutch colonial expansion, this legal framework spread globally. In the American context, the common law principles encoded in Blackstone's Commentaries served as the legal foundation before and during the establishment of the U.S. Constitution. The role of gold in the monetary system is therefore not a speculative claim or ideological position. It is a legal principle with a documented lineage spanning more than two and a half millennia.
Physical gold possession carries zero counterparty risk because it is recognised as final settlement under legal systems that trace their foundations back to Roman law. Every fiat instrument, by contrast, carries the counterparty risk of the issuing government or institution.
The Investor Psychology Trap: Accounting in Fiat
The reason most investors fail to grasp this framework is structural rather than intellectual. Tax obligations, portfolio valuations, and financial reporting are all conducted in fiat currency. This accounting requirement makes fiat currency feel like the neutral, zero-risk baseline. In reality, it is a credit instrument carrying government counterparty risk.
| Asset Type | Counterparty Risk | Purchasing Power Risk | Final Settlement Status |
|---|---|---|---|
| Physical Gold | None | Minimal over long cycles | Yes, universal legal recognition |
| Fiat Currency | Government and central bank | High through inflationary erosion | No |
| Government Bonds | Sovereign inflation or restructuring | High | No |
| Equities | Corporate and market | High in crash scenarios | No |
| ETF Gold | Custodian and issuer | Low, tracks gold | No, paper claim only |
Despite this risk hierarchy, ETF gold exposure represents only approximately 0.2% of the estimated $60 trillion in North American portfolio assets. This minimal allocation suggests that the broad reallocation toward monetary metals has not yet occurred, implying significant upside potential as investor understanding evolves — historically a late-cycle phenomenon.
Why Central Banks Are Accumulating Gold at Record Rates
Dollar Weaponisation as a Structural Own Goal
The decision by the United States to deploy dollar access as a geopolitical weapon through sanctions regimes has had an unintended consequence of considerable magnitude. Nations that previously held dollar-denominated assets as neutral reserve instruments have been forced to confront the possibility that those assets could be frozen or seized. Consequently, this realisation has materially accelerated reserve diversification, with physical gold as the primary beneficiary.
Central bank gold demand reflects a strategic recognition that gold cannot be sanctioned, frozen, or rendered inaccessible by a third-party government decision. Central banks, particularly across Asia, understand the legal status of gold as final settlement. Their accumulation is not speculative but deliberate and strategic in nature.
Russia's Gold Position: More Than the Headlines Suggest
Russia's gold accumulation is frequently discussed in terms of its central bank reserves, but the full picture is considerably larger. The Russian central bank holds an estimated 2,300 to 2,400 tonnes, but sovereign wealth fund holdings are estimated at a further 10,000 tonnes. Combined, Russia's aggregate gold position likely exceeds that of the United States, particularly given longstanding questions about the auditability of U.S. gold reserves at Fort Knox.
Russia's mining sector has also reportedly overtaken China as the world's largest gold producer on an annual output basis. This dynamic has led some Russian economists, notably former Putin economic adviser Sergei Glazyev, to formally propose placing the ruble on a gold standard. Whether or not this proposal is implemented, Russia possesses the gold reserve base to make such a transition technically feasible. For further context on this geopolitical dimension, this in-depth discussion explores the strain that a debt-based system places on global monetary architecture.
The Turkey Misunderstanding
Periodic reports of Turkey's central bank selling gold reserves have created confusion in markets. The more accurate interpretation is that Turkey uses gold flows between its central bank and commercial banking system as a tool for managing Turkish lira money supply. When gold moves from the central bank to commercial banks, it is not leaving the country or being liquidated on international markets. It functions as a domestic monetary regulation mechanism, meaning Turkey's reported central bank gold sales do not represent a reduction in Turkey's national gold position.
The Silver Supply Crisis: Industrial Demand Meets Restricted Supply
China's Undeclared Silver Export Restriction
One of the most significant and least-publicised supply dynamics in the silver market is China's policy reversal on silver exports. When China announced severe restrictions on rare earth exports, a parallel policy restricting silver exports was introduced simultaneously but without equivalent public disclosure. The market signal that confirmed this shift was dramatic: London silver lease rates spiked to approximately 40% in early October, a level of physical tightness rarely observed outside genuine supply dislocations.
Furthermore, China recorded record silver imports in the first quarter, suggesting a strategic accumulation of physical silver inventory while restricting outflows. The net effect is a structural reduction in silver available to the rest of the world, and silver supply deficits of this nature carry significant implications for long-term price discovery.
Five Industrial Demand Vectors Creating a Structural Deficit
The supply restriction is occurring against a backdrop of genuinely structural demand growth across multiple industrial categories:
- Photovoltaic solar cell manufacturing requires silver paste in quantities that current cell designs cannot substitute away from
- Electric vehicle production uses silver in power electronics and battery management systems at scale
- AI data centre infrastructure requires high-conductivity silver in advanced computing hardware
- Defence and weapons manufacturing consumes silver in missiles and precision munitions, with no recycling pathway once deployed
- Grid modernisation and electrification is expanding electrical infrastructure globally, each unit of which requires silver
The U.S. Geological Survey's recommendation that the U.S. government classify silver as a critical mineral adds a policy dimension to this industrial picture. China's response to that classification — restricting exports to a nation that has formally designated silver as strategically critical — represents a deliberate supply chain vulnerability being created in real time.
COMEX Positioning at 20-Year Lows: What It Signals
Current COMEX open interest in silver futures is at its lowest level in 20 years, and managed money long positions are similarly at 20-year lows. This positioning configuration has a specific implication: the paper market is not driving the current silver price action. The next significant move in silver will likely require a rebuilding of speculative long positions, which at such historically depressed levels represents considerable pent-up potential.
Swap dealers, functioning as market makers and bullion bank trading desks, have maintained significant short positions and are understood to be managing price levels while attempting to rebuild their inventory positions. There is also evidence, in the form of rising COMEX silver warehouse stocks, that physical silver is beginning to flow back into the exchange system, potentially positioning for the next phase of price discovery.
The next major ASX story will hit our subscribers first
Mining Stocks: The Forced Selling Paradox
Why Winning Positions Get Sold During Market Stress
The behaviour of mining stocks during broader equity market dislocations follows a counterintuitive but well-documented pattern. When investors face margin calls or need to raise liquidity during a general market decline, they sell their profitable positions first. Mining stocks, which have significantly outperformed broader indices during the precious metals rally, become sources of liquidity precisely because they have held their value when other holdings have not. This creates a technical disconnect between mining stock valuations and underlying fundamental value that is temporary but can be severe in magnitude.
Gold Miner Operating Margins at Current Price Levels
The relationship between gold and mining equities has rarely been more compelling from a fundamental standpoint. Consider the following margin profile at varying gold price levels:
| Gold Price Level | Estimated AISC | Operating Margin |
|---|---|---|
| $1,300/oz | Approximately $1,300/oz | Breakeven |
| $1,800/oz | Approximately $1,300 to $1,400/oz | Approximately $400 to $500/oz |
| $4,200/oz (current) | Approximately $1,300 to $1,400/oz | Approximately $2,800 to $2,900/oz |
All-in sustaining costs across major producers have not risen proportionally with the gold price, meaning the leverage to the gold price at the operating earnings level is substantial. Analytical work that would typically support a re-rating of mining equities is being suppressed by broader market volatility and investor risk aversion, creating a value gap that benchmark-constrained fund managers are structurally unable to close in the near term.
Value investors who can tolerate near-term volatility are looking at a sector where fundamental earnings power has rarely been stronger relative to equity market valuations. The constraint is not the investment case. It is investor psychology during a period of broader market stress.
The recovery sequence for mining equities requires two conditions to align: a stabilisation or recovery in the gold and silver price measured in dollars, confirming resumed dollar weakness, and sufficient resolution of broader equity market uncertainty to allow capital to flow toward value-based rather than momentum-based positioning. For a detailed walkthrough of these dynamics, this analysis provides additional context on what accelerating dollar weakness means for precious metals positioning. Neither condition has been fully met, but both are analytically anticipated as the macro environment deteriorates further.
Frequently Asked Questions
What is the core argument about the structural decline of the U.S. dollar?
The argument is that the U.S. government cannot service its debt obligations without sustained monetary expansion, and that this expansion progressively destroys the purchasing power of the dollar. This is framed not as a cyclical risk but as the predictable terminal trajectory of any fiat currency system that removes the gold constraint on currency issuance.
Why is gold described as money rather than an investment?
Investments are defined by carrying risk relative to a monetary baseline. Physical gold, in this framework, is the monetary baseline itself — the zero-counterparty-risk asset that functions as final settlement. Fiat currencies are credit instruments carrying government counterparty risk and therefore occupy a higher risk position than physical gold, not a lower one.
What is driving the structural silver deficit?
A combination of China's undeclared restriction on silver exports, record Chinese silver imports, and simultaneously expanding industrial demand across photovoltaic solar, electric vehicles, defence manufacturing, AI infrastructure, and grid electrification. COMEX positioning at 20-year lows suggests the market has not yet fully priced this structural imbalance.
Could the U.S. government formally default on its debt?
Formal default by a sovereign issuer of its own currency is not the probable mechanism of loss. The more likely pathway is purchasing power destruction through monetary expansion, which transfers the real loss to currency holders rather than producing a formal default event in bond markets.
What does central bank gold accumulation signal?
It reflects institutional recognition of gold's legal status as final settlement and a strategic response to the demonstrated willingness of the U.S. government to weaponise dollar access. Nations that previously regarded U.S. financial assets as neutral reserves now face geopolitical risk from holding them, making gold the reserve asset of choice for diversification.
How should investors think about positioning during a monetary transition?
The analytical framework presented within Alasdair Macleod on gold silver and dollar collapse prioritises assets with no counterparty risk — primarily physical gold and silver — over credit-based instruments. Mining equities offer significant fundamental value at current metal prices but require tolerance for near-term volatility driven by broader equity market dynamics before that value is likely to be recognised by mainstream capital flows.
This article is intended for informational purposes only and does not constitute financial advice. All forecasts, valuations, and analytical scenarios involve significant uncertainty. Readers should conduct independent research and consult qualified financial professionals before making investment decisions. References to gold and silver price levels should be understood within the context of the macroeconomic scenarios described and not as price forecasts or guarantees.
Want to Identify ASX Mining Stocks Before the Next Major Discovery?
Discovery Alert's proprietary Discovery IQ model delivers real-time alerts on significant ASX mineral discoveries, cutting through market noise to surface actionable opportunities in gold, silver, and resource equities the moment they are announced — explore the historic returns major mineral discoveries have generated and begin your 14-day free trial today to position yourself ahead of the broader market.