July 24, 2026
The Hidden Engine Inside the World's Largest Copper Company
Most conversations about commodity diversification focus on what happens when a miner's primary metal falls out of favour. Far less attention goes to what happens when a secondary metal quietly becomes indispensable to the entire earnings architecture. That structural shift is precisely what has unfolded over the past decade inside the Freeport-McMoRan gold business, where bullion has evolved from a peripheral by-product into a material driver of consolidated cash flow.
Understanding this dynamic requires stepping back from quarterly earnings headlines and examining the mechanics of how large-scale copper-gold systems actually generate value. The interaction between commodity prices, ore body geology, and accounting treatment creates a financial profile that differs fundamentally from both pure-play copper miners and dedicated gold producers.
When big ASX news breaks, our subscribers know first
The By-Product Model and Why It Changes Everything
How Gold Functions as a Cost Reducer, Not Just a Revenue Line
In conventional mining accounting, by-product credits work by offsetting the cost of producing the primary metal. When Freeport mines copper at Grasberg, the gold recovered during that same process is sold, and the revenue generated is applied against the copper production cost. This means that as gold prices rise, Freeport's effective cost of producing copper falls, even if nothing changes operationally.
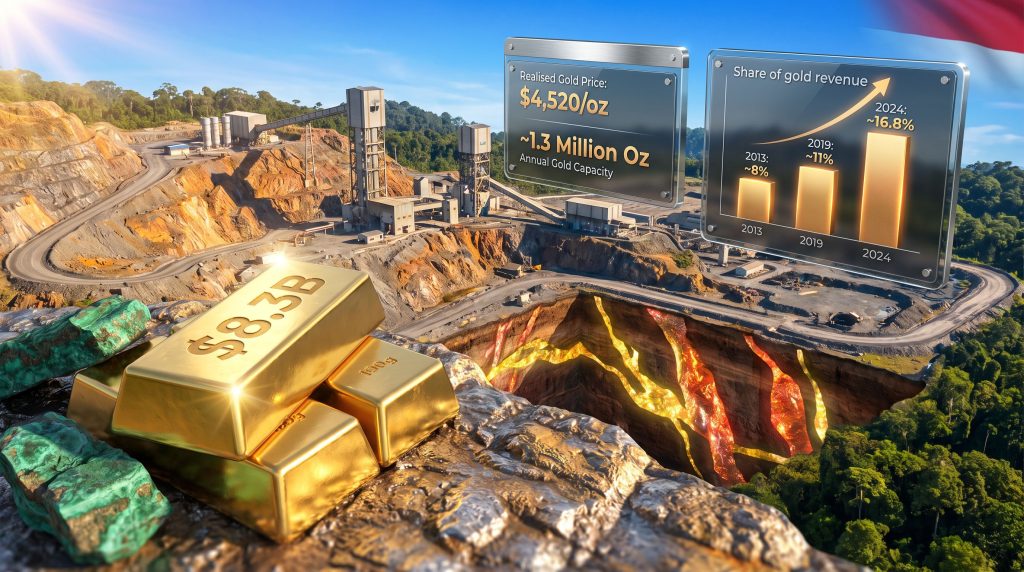
This mechanism has profound implications for margin analysis. At a realised gold price of $4,520 per ounce during the second quarter of 2026, the by-product credit effect on copper production economics is materially larger than it would have been at, say, $1,800 per ounce. The gold business is simultaneously boosting revenue and compressing reported costs, creating a double amplification effect on profitability.
Furthermore, the gold price impact on mining equities is particularly pronounced for companies like Freeport, where bullion functions as a structural margin enhancer rather than a standalone revenue stream.
Unlike dedicated gold producers who must allocate exploration budgets, mine development capital, and operational overhead specifically to gold, Freeport captures gold as an inherent consequence of copper extraction. This means there is no marginal capital cost associated with incremental gold production at Grasberg, which structurally advantages the company's returns during gold bull markets.
The Long-Term Shift in Gold's Revenue Contribution
The growing importance of gold within Freeport's revenue mix is not a recent development. It reflects a decade-long structural evolution tied to both commodity price cycles and deliberate operational transformation at Grasberg.
| Period | Gold's Approximate Revenue Share |
|---|---|
| 2013 | ~8% |
| 2019 | ~11% |
| 2024 | ~16.8% |
This near-doubling of gold's proportional contribution did not happen by accident. It reflects the convergence of two independent forces: a secular bull market in gold prices that gained significant momentum from 2019 onward, and the transition of Grasberg from open-pit to underground mining, which unlocked access to higher-grade ore zones that yield a richer gold-to-copper ratio in extracted material.
Grasberg: Scale, Geology, and the Underground Transition
What Makes This Ore Body Genuinely Exceptional
The Grasberg minerals district in Papua, Indonesia, sits within a porphyry copper-gold system of unusual scale and grade. Porphyry deposits are the workhorses of global copper supply, but most carry only trace quantities of gold. Grasberg is an outlier: its gold grades are high enough that gold functions as a genuine co-product rather than a trace contaminant, which is geologically uncommon at this tonnage scale.
The transition from open-pit to underground block cave mining at Grasberg was one of the most complex operational undertakings in modern mining history. Block cave mining involves undermining an ore body so that it collapses under its own weight into extraction tunnels below, a technique that works exceptionally well in competent, massive ore bodies but demands precise geotechnical engineering and substantial upfront infrastructure investment.
The underground ore zones at Grasberg, including the Grasberg Block Cave and the Deep Mill Level Zone, were known to contain higher gold grades than portions of the historical open pit. This gives the fully ramped underground operation a structurally richer gold production profile per tonne of copper extracted. In addition, broader copper market trends suggest that integrated operations like Grasberg are increasingly well-positioned to benefit from dual-commodity price appreciation.
The Mud Rush Incident and Its Production Consequences
In September 2025, a mud rush event at the Grasberg Block Cave underground mine disrupted operations significantly. Mud rushes occur in underground mines when saturated, fine-grained material flows unexpectedly into active mining areas, presenting both safety risks and production interruptions that can persist for months.
The incident constrained gold output into 2026. During the second quarter of 2026, Freeport produced 192,000 ounces of gold but sold only 123,000 ounces, a divergence that reflects the timing mismatch between ore extraction, processing, and metal delivery under constrained operating conditions. The production-to-sales gap signals that refined inventory was building during the recovery phase, which has forward revenue implications as throughput normalises.
The Ramp-Up Roadmap: A Phased Return to Full Capacity
Recovery from the mud rush is progressing according to the company's internal schedule. The phased restoration pathway looks as follows:
- Q2 2026: Production Blocks 2 and 3 achieved their planned operating rates, confirming that core infrastructure has been rehabilitated
- H2 2026: The mine is expected to operate at approximately 65% of total system capacity
- Mid-2027: Capacity utilisation is targeted to reach approximately 80%, reflecting continued sequential block commissioning
- End of 2027: Full production restoration is the stated objective, which would bring annual output toward the 1.3 million ounce gold and 1.7 billion pound copper nameplate rates
| Metric | Full Capacity Target |
|---|---|
| Annual Gold Production | ~1.3 million ounces |
| Annual Copper Production | ~1.7 billion pounds |
| Estimated Capacity Utilisation (H2 2026) | ~65% |
| Target Capacity Utilisation (Mid-2027) | ~80% |
| Full Production Timeline | End of 2027 |
For investors assessing the Freeport-McMoRan gold business specifically, this ramp-up trajectory represents one of the most significant near-term production growth stories in the global mining sector that does not require any new greenfield capital expenditure.
Q2 2026 Financial Performance: Parsing the Numbers
Earnings Improvement Despite a Consensus Miss
The headline financial result for the second quarter of 2026 reflected meaningful year-over-year improvement across both commodity price realisations and absolute earnings:
| Metric | Q2 2025 | Q2 2026 |
|---|---|---|
| Adjusted Earnings | $790 million ($0.54/share) | $1.1 billion ($0.74/share) |
| Net Income (Attributable) | Not disclosed | $984 million ($0.68/share) |
| Copper Price | $4.54/lb | $6.17/lb (+36%) |
| Realised Gold Price | $3,291/oz | $4,520/oz (+37%) |
Despite these strong year-over-year improvements, Freeport's results fell marginally short of analyst consensus, which had projected earnings of approximately $0.78 per share. The gap is primarily attributable to the production shortfall in gold sales volumes: with 192,000 ounces produced but only 123,000 ounces sold, the timing lag between extraction and revenue recognition reduced reported earnings relative to what full conversion of produced gold would have generated.
This distinction matters for sophisticated investors. The production-to-sales divergence is not a structural earnings impairment; it is a timing artefact of the mine recovery process. As the ramp-up advances and inventory normalises, that gap should narrow, which means the Q2 consensus miss may understate the forward earnings trajectory. Freeport-McMoRan economic concerns around macro headwinds have, however, added a layer of caution to near-term analyst projections.
Cash Flow at Scale: The $8.3 Billion Projection
Management's full-year operating cash flow forecast of approximately $8.3 billion is grounded in a second-half gold price assumption of $4,000 per ounce, which sits below the Q2 2026 realised price. This conservative base case implies that even if gold prices experience further softening from current levels, the cash flow generation profile remains substantial.
The dual-commodity leverage embedded in this forecast is worth emphasising. Both copper and gold prices are simultaneously elevated by historical standards, and the compounding effect on operating cash flow is disproportionate to what either commodity would generate in isolation.
Risk Dimensions That Investors Should Monitor
Geographic Concentration and Regulatory Exposure
Nearly all of Freeport's gold production originates from a single asset in a single country. The Grasberg district's location in Papua, Indonesia, means that regulatory changes, contract renegotiations, or geopolitical disruptions carry outsized consequences for the gold business specifically. Freeport's Indonesian operations have historically been subject to renegotiated terms, a dynamic that investors in the company have navigated through multiple cycles.
Underground Operational Risk
Block cave mining is operationally demanding. The September 2025 mud rush demonstrated that large-scale underground mines of this type carry inherent geotechnical risks that can interrupt production with limited warning. As Grasberg continues its ramp-up through 2027, the risk of further operational interruptions cannot be dismissed, particularly as newly commissioned production blocks are brought online.
Gold Price Sensitivity Scenarios
The company's guidance is anchored at $4,000 per ounce for the second half of 2026. A sustained decline below $3,500 per ounce would compress by-product credits, elevate effective copper production costs, and reduce consolidated cash flow materially. Investors treating Freeport as a gold price proxy should understand that the sensitivity runs in both directions.
Disclaimer: This article is for informational purposes only and does not constitute financial advice or a recommendation to buy or sell any security. Commodity price forecasts involve significant uncertainty, and actual results may differ materially from projections discussed herein.
Freeport vs. Pure-Play Gold Miners: A Framework for Comparison
The Freeport-McMoRan gold business occupies a unique position in the market structure. Unlike dedicated gold producers such as Newmont or Barrick, Freeport does not allocate capital specifically toward gold discovery, gold mine development, or gold-specific processing infrastructure. Gold arrives as a consequence of copper mining, which means:
- No gold-specific exploration expenditure is required to sustain production
- Gold hedging decisions are made within a broader copper-centric risk management framework
- Investor exposure to gold through Freeport is inherently bundled with copper price risk, Indonesian country risk, and underground operational risk
- Valuation methodologies applied by equity analysts typically assign separate net asset values to the gold and copper streams, but the market price of FCX shares reflects the integrated whole
This creates a genuine analytical complexity. Investors seeking pure gold price leverage will find that Freeport delivers a diluted version, while investors seeking copper exposure will find that gold acts as a meaningful earnings modifier that cannot be ignored in any serious financial model. Consequently, those exploring undervalued mining stocks may find Freeport's integrated model particularly compelling at current commodity price levels.
It is also worth noting that when comparing Freeport against the largest copper mines globally, Grasberg's gold co-product credentials set it apart from virtually every other asset in the peer group.
The next major ASX story will hit our subscribers first
Frequently Asked Questions: Freeport-McMoRan Gold Business
How much gold does Freeport-McMoRan produce annually?
At full Grasberg underground capacity, the company targets approximately 1.3 million ounces of gold per year. For full-year 2026, guidance points to approximately 650,000 ounces of gold sales while the phased recovery continues.
Where does Freeport source its gold production?
Virtually all gold production comes from the Grasberg minerals district in Papua, Indonesia, which hosts one of the largest and highest-grade copper-gold porphyry systems ever discovered. Freeport-McMoRan's company profile provides further background on how this asset came to sit at the centre of the company's global operations.
Is gold Freeport-McMoRan's main business?
No. Freeport is first and foremost a copper producer. Gold contributes an estimated 16.8% of total company revenues based on 2024 figures, functioning primarily as a by-product that amplifies margins rather than driving operational strategy.
What gold price underpins Freeport's 2026 guidance?
Management has applied a base-case assumption of $4,000 per ounce for the second half of 2026, supporting a projected full-year operating cash flow of approximately $8.3 billion.
What caused the disruption to Grasberg's gold output?
A mud rush event at the Grasberg Block Cave in September 2025 interrupted underground mining operations, constraining gold production through the first half of 2026. The recovery is proceeding on the company's stated timeline.
Key Takeaways for Investors Analysing the Gold Business
- Gold's share of Freeport's total revenue has more than doubled since 2013, driven by both sustained bullion price appreciation and the transition to higher-grade underground ore at Grasberg
- Even during gold's steepest quarterly price decline in over a decade, Freeport's realised price of $4,520 per ounce remained at historically elevated levels, demonstrating that the earnings support from current price regimes is structurally durable
- The production-to-sales divergence in Q2 2026 (192,000 ounces produced versus 123,000 ounces sold) is a timing artefact, not an impairment, and may represent a latent tailwind as inventory normalises through the ramp-up
- The Grasberg recovery roadmap, targeting full output restoration by end-2027, represents one of the most significant gold production growth trajectories in the sector that requires no additional greenfield capital
- Simultaneous elevation of both copper and gold prices creates a compounding effect on operating cash flow that a single-commodity model cannot replicate, and Freeport's $8.3 billion cash flow forecast reflects precisely this dynamic
Want to Identify the Next Major ASX Mineral Discovery Before the Broader Market?
Discovery Alert's proprietary Discovery IQ model delivers real-time alerts on significant ASX mineral discoveries — instantly transforming complex geological data into actionable investment insights for both short-term traders and long-term investors. Start your 14-day free trial today and explore Discovery Alert's discoveries page to see how historic finds have generated substantial returns for those positioned early.