August 6, 2026
Precious Metals at an Inflection Point: Understanding Gold's Historic Weekly Surge
Precious metals markets rarely move in a straight line, and the forces that produce truly meaningful weekly advances tend to reveal something deeper about the macroeconomic landscape than day-to-day price noise ever could. When gold heads for best week since January performance levels, the convergence of variables creating that outcome deserves careful unpacking, not just surface-level observation. The week ending August 8, 2026 delivered exactly that kind of signal.
When big ASX news breaks, our subscribers know first
The Macro Architecture Behind a 5%+ Weekly Move
To understand why spot gold climbed above $4,254.11 per ounce and gold futures reached $4,312.00, it helps to step back and examine the structural conditions that were quietly building beneath the surface for weeks prior to the breakout.
Three distinct forces converged almost simultaneously:
- Falling crude oil prices dragged inflation expectations lower, reducing the urgency for central banks to maintain aggressive tightening postures.
- Shifting Federal Reserve rate hike probabilities altered the opportunity cost calculus for non-yielding assets like gold.
- Geopolitical developments in the Middle East triggered a repricing of safe-haven demand dynamics, with peace signals creating a complex dual effect on investor positioning.
Gold had been consolidating above the $4,000 per ounce level for several weeks before this breakout, and that base-building phase is important context. Markets rarely sprint higher without first establishing a foundation, and the $4,000 range acted precisely as that kind of technical and psychological staging ground.
Key Price Metrics: What the Data Actually Shows
| Metric | Value |
|---|---|
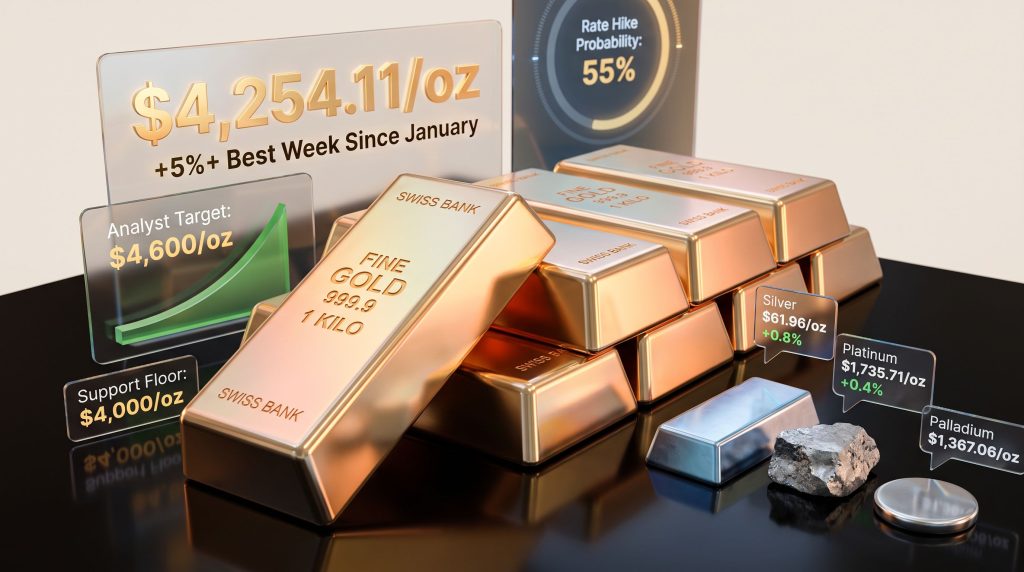
| Spot Gold Price | $4,254.11/oz (+0.4%) |
| Weekly Performance | +5%+ (best week since January) |
| Gold Futures (U.S.) | $4,312.00 (+0.3%) |
| Recent Session High | Seven-week high |
| Key Support Level | $4,000/oz |
| Analyst Upside Target | $4,600/oz |
The gap between spot gold and futures pricing reflects standard contango market structure, where future delivery commands a premium. That premium holding firm above $4,300 for futures is a signal that the market does not anticipate a near-term reversal, even as short-term volatility from economic data releases remains possible.
How Falling Oil Prices Became Gold's Most Unexpected Catalyst
Energy markets and gold markets do not always move in sync, but the mechanism connecting them is straightforward once understood. Crude oil prices are the single largest contributor to headline inflation readings in most major economies. When oil falls, headline CPI tends to follow, which in turn reduces the political and economic pressure on central banks to keep raising interest rates.
Lower rate hike expectations reduce the opportunity cost of holding gold. Unlike bonds or interest-bearing deposits, gold generates no yield. In a high-rate environment, that becomes a material disadvantage. As rates are expected to plateau or decline, that disadvantage shrinks, and gold's appeal as a store of value and portfolio diversifier reasserts itself.
The relationship between energy prices and gold is often underappreciated by retail investors, who tend to focus narrowly on dollar strength or geopolitical headlines. In reality, oil's influence on inflation expectations creates one of the most consistent indirect pathways into gold pricing.
Crude oil's weekly loss contributed meaningfully to the inflationary relief narrative, and that narrative directly fuelled the gold advance. Furthermore, monitoring the gold price forecast alongside energy trends provides a more complete picture of where pricing momentum may be heading.
Federal Reserve Policy Expectations: The Rate Probability Shift
One of the most precise data points capturing the week's shift in sentiment came from the CME FedWatch Tool. The probability of a U.S. Federal Reserve rate hike in September moved from approximately 63% to 55% over the course of a single week. While an 8-percentage-point shift may appear modest in isolation, in interest rate markets, this magnitude of repricing within five trading sessions is significant.
| Rate Scenario | Impact on Gold | Probability (CME FedWatch) |
|---|---|---|
| Rate hike in September | Moderate headwind | 55% |
| Rate hold / pause | Neutral to bullish | 45% |
| Accelerated hike cycle | Short-term pressure, long-term hedge demand | Low |
| Rate cut cycle begins | Strongly bullish | Contingent on data |
Federal Reserve Bank of St. Louis President Alberto Musalem maintained a hawkish public position during this period, expressing a preference for earlier incremental rate increases over potentially more disruptive abrupt adjustments later. Despite this institutional hawkishness, markets interpreted the broader data picture — particularly falling energy prices and mixed labour market signals — as reasons to reduce rate hike bets. This divergence between Fed rhetoric and market pricing created the environment gold needed to break higher.
In addition, central bank gold demand has continued to underpin structural buying across the market, reinforcing the metal's resilience even when short-term rate expectations create headwinds.
The NFP Catalyst: Mapping Two Distinct Scenarios
The U.S. nonfarm payrolls report for July sat directly in the market's near-term focus, scheduled for release after the week's trading concluded. Two distinct outcome pathways were being priced across asset classes:
Scenario A: Strong Jobs Print
A robust payrolls number would reinforce the case for Fed tightening, applying short-term pressure to gold prices. However, with $4,000 per ounce having absorbed multiple tests without breaking decisively, any pullback triggered by a strong NFP would likely prove shallow. Structural buyers have demonstrated patience at that level.
Scenario B: Weak Jobs Print
Softer employment data would reduce rate hike probability further, accelerating gold's trajectory toward the $4,600 per ounce analyst target that has emerged as the next significant technical objective. This outcome would also likely boost silver and platinum alongside gold.
Analysts at StoneX noted that the $4,000 level had proven itself as a solid structural support, with market participants likely positioned to use any NFP-driven dip as a buying opportunity rather than an exit signal. Price action heading into the data release confirmed gold's bullish bias. For broader context on how trade war impact on gold and silver prices has shaped recent macro sentiment, understanding the geopolitical backdrop adds further interpretive depth.
The next major ASX story will hit our subscribers first
Silver, Platinum, and Palladium: Reading the Broader Precious Metals Complex
When gold moves sharply, the behaviour of other precious metals provides critical interpretive context. This week, all four major metals recorded weekly gains, but with nuanced session-by-session differences worth examining.
| Metal | Price | Weekly Direction | Session Change |
|---|---|---|---|
| Gold (Spot) | $4,254.11/oz | Weekly gain (+5%+) | +0.4% |
| Silver (Spot) | $61.96/oz | Weekly gain | +0.8% |
| Platinum | $1,735.71/oz | Weekly gain | +0.4% |
| Palladium | $1,367.06/oz | Weekly gain | -0.3% (session) |
Silver's session outperformance at +0.8% is worth particular attention. Silver operates across two distinct demand profiles: monetary metal and industrial input. Its stronger session gain relative to gold suggests industrial demand signals were also firming alongside the monetary and safe-haven bid. Consequently, tracking the gold-silver ratio during periods like this helps investors determine whether silver's relative strength represents genuine divergence or simply catch-up pricing.
Silver is extensively used in solar panel manufacturing, electronics, and medical applications, meaning its price behaviour reflects not just investor sentiment but real-economy demand cycles.
Palladium's -0.3% session dip tells a different story. As an automotive catalyst metal, palladium pricing is deeply tied to vehicle production volumes and internal combustion engine demand. A session decline even within a positive weekly trend may signal caution around near-term automotive sector output, particularly as electric vehicle adoption continues reducing palladium intensity per vehicle produced over the longer term.
Gold as an Inflation Hedge: Resolving the Rate Paradox
Does rising inflation always benefit gold?
A persistent misconception in financial media is that gold behaves as a simple, one-dimensional inflation hedge. The reality is considerably more nuanced. Gold is simultaneously an inflation hedge and a rate-sensitive asset, which creates an inherent tension during periods when inflation is high and central banks are responding with rate hikes.
During these periods, gold can underperform expectations precisely because rising rates increase the opportunity cost of holding it. The resolution of this paradox typically arrives when rate hike cycles appear to be approaching their terminal point, or when inflation expectations begin falling faster than policy rates. Both conditions were present during this particular week, creating an unusually favourable dual tailwind.
Gold's strongest rallies rarely occur at the peak of inflation itself. They tend to occur when the response to inflation begins to shift — specifically when markets start pricing in the end of tightening cycles rather than the beginning.
Historical analysis of gold prices reveals a recurring pattern: the metal's sharpest advances have consistently preceded or coincided with pivotal shifts in Federal Reserve communication, rather than lagging them. This week's advance — representing gold heads for best week since January territory — fits that historical template with notable precision.
Risk Factors That Could Interrupt the Rally
No analysis of a gold rally is complete without mapping the credible risks that could challenge its continuation:
- Inflation re-acceleration: A surprise rebound in energy prices or services inflation could reignite rate hike expectations, temporarily capping gold's upside.
- Geopolitical resolution effects: Peace progress in the Middle East, while positive for global stability, can paradoxically reduce safe-haven demand for gold. The metal's geopolitical risk premium is real and can deflate quickly on positive diplomatic developments.
- Dollar strength: Gold is priced in U.S. dollars, meaning a significant USD rally would mechanically compress gold prices in dollar terms, even if underlying demand remains firm. Watching dollar index behaviour alongside gold pricing provides important signal calibration.
- Stronger-than-expected labour market data: A series of robust NFP prints could reverse the rate hike probability shift and reassert Fed hawkishness as the dominant market narrative.
However, analysts broadly agree that the broader context of strong U.S. dollar and Fed rate expectations weighing on prices in prior periods makes the current rally — with gold heads for best week since January levels — all the more significant as a reversal signal.
Frequently Asked Questions: Gold's Best Week Since January
Why is gold heading for its best week since January 2026?
The rally reflects a convergence of falling oil prices reducing inflation expectations, declining Federal Reserve rate hike probability, and Middle East geopolitical developments. Spot gold advanced more than 5% across the week, reaching $4,254.11 per ounce after touching a seven-week high.
What is the next major price target for gold?
Market analysts have identified $4,600 per ounce as the next meaningful upside objective, with $4,000 per ounce now widely viewed as a well-tested structural floor.
How do nonfarm payrolls affect gold prices?
The NFP report influences gold indirectly through its effect on Federal Reserve rate expectations. Weaker employment data reduces rate hike probability, lowers the opportunity cost of holding gold, and typically supports higher prices. A strong print can create short-term headwinds but is unlikely to break established support at current levels.
Why does silver sometimes outperform gold on a session basis?
Silver carries dual demand drivers: investment demand that tracks gold, and industrial demand from solar, electronics, and medical sectors. When silver outperforms gold on a session basis, it often signals that industrial demand conditions are strengthening independently of monetary factors — a nuance worth monitoring.
Is palladium's session decline concerning despite a positive week overall?
A single session dip within a positive weekly trend is not inherently alarming. However, palladium's structural demand outlook faces longer-term headwinds from electric vehicle adoption reducing the use of internal combustion engine catalytic converters, which represent the metal's primary demand base.
Three Structural Themes This Rally Confirms
This week's advance is more than a short-term price event. It confirms several durable structural themes relevant to macro markets and precious metals investors through the remainder of 2026:
- Inflation sensitivity remains amplified: Even moderate shifts in energy prices are producing outsized responses in precious metals, suggesting markets are operating on a hair-trigger for inflation signals.
- $4,000 per ounce is now a genuine technical and psychological anchor: Multiple challenges to this level without a sustained breakdown demonstrates the depth of structural buying interest beneath current prices.
- Rate expectations are the dominant near-term variable: Weekly swings of 8 percentage points in Fed probability pricing are translating directly into gold price volatility, making CME FedWatch data an essential monitoring tool for any precious metals investor.
Disclaimer: This article is intended for informational purposes only and does not constitute financial or investment advice. Precious metals prices are volatile and subject to rapid change based on economic, geopolitical, and market-specific factors. Past performance and historical patterns do not guarantee future results. Readers should conduct their own due diligence and consult a qualified financial adviser before making any investment decisions.
Want to Capitalise on the Next Major Mineral Discovery Before the Broader Market?
Discovery Alert's proprietary Discovery IQ model delivers real-time alerts on significant ASX mineral discoveries, transforming complex data across 30+ commodities into clear, actionable insights for both short-term traders and long-term investors — explore the historic returns major discoveries have generated to understand what's possible, then begin your 14-day free trial at Discovery Alert to position yourself ahead of the market.