
July 30, 2026
Two Markets, One Metal: Understanding the Structural Divide Driving Gold in 2026
Commodity markets rarely offer clean narratives, but the gold market in mid-2026 is presenting investors with something unusually legible: two entirely separate buyer groups, operating on entirely different time horizons, sending entirely different signals. Gold and central bank demand has become one of the defining structural forces shaping the metal's trajectory. Western financial participants are reducing exposure in response to shifting interest rate expectations, whilst sovereign reserve managers are doing the opposite, accumulating gold at a pace that continues to exceed historical averages regardless of where short-term rates are headed.
Understanding which force is driving marginal price movements at any given moment, and which force will determine gold's trajectory over the next several years, is the analytical challenge that separates informed positioning from reactive trading.
When big ASX news breaks, our subscribers know first
Gold and Central Bank Demand: The 15-Year Structural Shift That Changes Everything
The relationship between central banks and gold has undergone a complete reversal over the past two decades. Through the 1990s and into the early 2000s, official-sector institutions were consistent net sellers, systematically offloading gold reserves as financial assets denominated in US dollars and other reserve currencies offered competitive returns with greater liquidity. That era is now a distant memory.
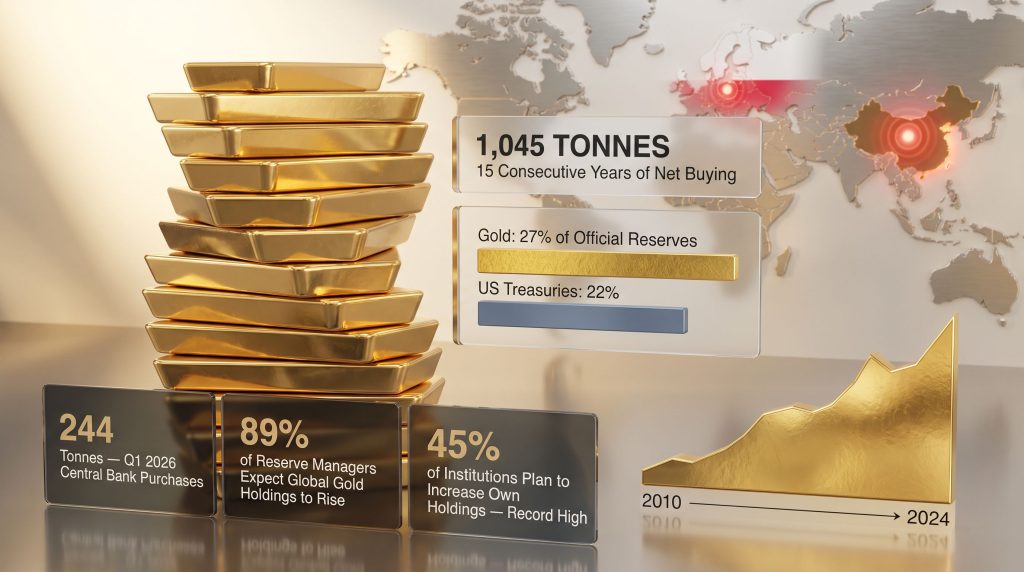
Central banks have recorded net positive gold purchases for 15 consecutive years through 2024, a sustained reversal with no modern precedent. More significantly, the volume of that buying has escalated dramatically. Annual official-sector purchases have exceeded 1,000 tonnes for three straight years, with 2024 recording 1,045 tonnes. This is not a temporary anomaly driven by one or two large buyers. It reflects a broadening of reserve diversification strategies across multiple geographies and institutional mandates.
The share of total global gold demand attributable to central banks has grown from roughly one-tenth during the 2010s to more than 20% in 2024, making the official sector one of the single most consequential demand sources in the entire market. Furthermore, central bank demand has proven remarkably resilient to short-term price fluctuations, a characteristic that distinguishes it sharply from Western investment flows.
Q1 2026 Confirms the Trend Remains Intact
Some market observers had speculated that elevated gold prices following the January 2026 peak would discourage further official-sector accumulation. The Q1 2026 data has answered that question directly. Net central bank gold purchases reached 244 tonnes in the first quarter of 2026, exceeding both the prior quarter's total and the five-year rolling average. Critically, this volume also surpassed the equivalent period in 2025.
Perhaps more revealing than the headline number is what did not happen. Despite gold prices correcting approximately 28% from their January 2026 peak, neither the People's Bank of China nor the National Bank of Poland accelerated their purchasing to take advantage of lower prices. Both maintained a consistent pace. This behavioural pattern is analytically significant: it indicates that sovereign buyers are executing against long-term allocation mandates, not attempting to optimise entry prices the way a hedge fund or ETF investor might.
Three Strategic Pillars Behind the Central Bank Gold Accumulation Cycle
The motivations driving gold and central bank demand are not monolithic, but three distinct strategic pillars can be identified across the reserve management community.
Sanctions Risk and the Counterparty Problem
The single most consequential event reshaping global reserve management in recent history was the 2022 freezing of approximately $300 billion in Russian sovereign reserves following the invasion of Ukraine. For reserve managers at non-Western central banks, this episode fundamentally altered the perceived risk profile of financial assets held within foreign financial systems.
Physical gold held domestically carries no counterparty risk whatsoever. It cannot be frozen by foreign governments, is not transmitted through SWIFT-based payment networks, and cannot be subject to asset restrictions imposed by other jurisdictions. This combination of properties, which were theoretically understood before 2022, became urgently practical after it. Reserve managers began treating counterparty and sanctions exposure as a first-order portfolio risk rather than a remote scenario. According to CNBC reporting on reserve storage trends, this shift toward domestic gold holdings has accelerated considerably since 2022.
Dollar Concentration and the Diversification Imperative
The US dollar retains a 42% share of global reserve assets, according to European Central Bank data from June 2026. While that figure confirms the dollar's continued dominance, it also illustrates the concentration risk inherent in a reserve system where a single currency and its associated instruments account for nearly half of all sovereign holdings.
The ECB's June 2026 report delivered a finding with significant implications: gold surpassed US Treasuries as the world's second-largest official reserve asset class by end-2025. Gold's share of official reserves rose from 20% in 2024 to 27% in 2025, while US Treasuries fell to a 22% share. This reordering of the global reserve hierarchy, occurring over roughly twelve months, represents one of the most rapid compositional shifts in modern reserve management history. In addition, the global gold reserves picture continues to shift away from dollar-denominated instruments at a pace few analysts anticipated even two years ago.
Store of Value and Crisis Performance
World Gold Council survey data identifies the top motivations for official-sector gold accumulation as long-term store of value, crisis-period performance, and portfolio diversification. Gold's track record during episodes of elevated inflation, currency debasement, and geopolitical disruption has consistently reinforced its role as a non-correlated reserve asset, one whose value does not depend on any single issuing authority. Consequently, its safe-haven characteristics remain a core pillar of official-sector conviction.
What the 2026 Reserve Survey Reveals About Institutional Conviction
The World Gold Council's 2026 Central Bank Gold Reserves Survey provides a quantified view of where institutional sentiment currently sits.
| Survey Metric | 2026 Finding |
|---|---|
| Reserve managers expecting global gold holdings to rise | 89% |
| Institutions planning to increase their own gold holdings | 45% (record high) |
| Survey collection timing | Post-Middle East conflict escalation |
| Implied demand trajectory | Structurally positive across 12+ months |
The 45% figure is the highest recorded in the survey's history. Crucially, responses were collected after the escalation of the Middle East conflict, meaning the data reflects current geopolitical conditions rather than a pre-crisis baseline. This context matters: survey participants were not expressing optimism about a hypothetically stable future. They were expressing conviction within an already-disrupted environment.
According to The Conversation's analysis of central bank gold holdings, holdings are now at a 50-year high, underscoring just how profound this structural shift has become.
The survey findings collectively suggest that no single central bank policy decision by the US Federal Reserve is likely to redirect the multi-year reserve diversification strategy that is underpinning official-sector gold accumulation at scale.
Country-Level Buying Patterns: China and Poland as Case Studies
Examining individual central bank behaviour adds texture to the aggregate demand picture.
People's Bank of China
- Extended its net gold-buying streak to 20 consecutive months as of May 2026
- Added 10 tonnes in May 2026, the largest single-month purchase since December 2024
- Pattern reflects steady, non-opportunistic accumulation rather than price-driven concentration
National Bank of Poland
- Purchased 18 tonnes in May 2026, its fourth consecutive month of double-digit acquisitions
- Year-to-date 2026 purchases reached 64 tonnes by end of May
- Total holdings grew to 614 tonnes, advancing toward a publicly declared 700-tonne reserve target
- Pattern reflects target-driven systematic accumulation aligned with a declared strategic objective
Neither institution increased purchase volumes during the price correction from January 2026 highs. This steady-pace behaviour is a meaningful signal for investors trying to assess the price sensitivity of official-sector demand. Central banks are not buying on dips. They are buying on schedule.
How Federal Reserve Policy Actually Moves Gold Prices, and Where Its Influence Ends
The monetary policy transmission mechanism for gold operates through two well-understood channels. Higher interest rate expectations tend to strengthen the US dollar, applying inverse pressure to dollar-denominated gold prices. Rising real yields simultaneously increase the opportunity cost of holding non-yielding assets like gold, making the metal relatively less attractive to yield-oriented investors.
These effects are real, but they operate almost exclusively through Western financial market participants: ETF investors, futures traders, and institutional allocators benchmarking against rate-sensitive alternatives. For a broader perspective on how gold interacts with bonds across economic cycles, the gold and bonds dynamics relationship offers additional analytical context.
Western ETF Flows as a Rate Sensitivity Barometer
The data from mid-2026 illustrates just how acute that sensitivity has become. SPDR Gold Shares, the world's largest gold-backed ETF, recorded more than $1.6 billion in net outflows over a 30-day window. Six-month cumulative outflows from Western gold-backed funds exceeded $12 billion.
During a single reporting week, global gold fund inflows of $1.668 billion were almost entirely cancelled out by $1.67 billion in redemptions elsewhere, effectively demonstrating near-complete neutralisation of Western investment demand at that moment.
| Fed Meeting | Rate Hike Probability (Mid-2026) | Market Implication |
|---|---|---|
| July 2026 FOMC | ~36% | Elevated near-term uncertainty |
| September 2026 FOMC | ~80% | Hawkish trajectory increasingly priced |
| US Dollar Index Level | ~101.5 (one-month high) | Near-term gold price headwind |
The key analytical point here is not that Fed policy is irrelevant to gold — it clearly moves prices in the near term. The key point is that Fed policy operates within a different time dimension than the reserve diversification strategies driving central bank demand. One cycles over months; the other plays out over years.
The next major ASX story will hit our subscribers first
The Geopolitical Wildcard: Strait of Hormuz Risk and Asymmetric Gold Upside
Beyond monetary policy, the unresolved US-Iran dispute over Strait of Hormuz transit represents a distinct and arguably underpriced risk for gold markets. Brent crude briefly approached $100 per barrel around late July 2026 before retreating on ceasefire expectations, demonstrating how quickly energy markets reprice on geopolitical developments.
A breakdown in Hormuz shipping arrangements would create a compounding effect for gold. Higher energy prices would reinforce inflation expectations, complicating the Federal Reserve's rate path whilst simultaneously generating safe-haven demand for the metal. These two channels would work in the same direction simultaneously.
An earlier memorandum of understanding on Hormuz transit arrangements collapsed in 2026, establishing a precedent that current ceasefire proposals carry real execution risk. If negotiations fail, markets would likely need to reprice both geopolitical risk premiums and monetary policy expectations in rapid succession — a scenario that has historically provided abrupt support for gold from multiple demand channels at once.
The asymmetry here is notable: gold's current price appears to underweight geopolitical tail risk, particularly given the metal's historical role as a safe-haven asset during energy market crises. Investors who separate the near-term Fed trade from the longer-term structural thesis may find this asymmetry relevant to position sizing.
What Operational Quality Means for Gold Producers in a Range-Bound Market
When gold's near-term direction is genuinely uncertain, the risk-adjusted value proposition shifts toward producers whose economics hold across a range of gold price scenarios, not just in a rising price environment. Three operational characteristics consistently differentiate resilient producers from those whose margins deteriorate under price or input cost pressure.
Cost Discipline Over a Mine's Full Life
Integra Resources' June 2026 feasibility study for its Florida Canyon operation illustrates why a single year of elevated costs can be deeply misleading as a proxy for long-term project economics. The study extended mine life to eight years, increased reserves by 78%, and estimated a net present value (at a 5% discount rate) of $601 million alongside nearly $800 million in after-tax free cash flow.
While 2026 site-level all-in sustaining costs (AISC) are forecast at $3,300 to $3,500 per ounce, the life-of-mine AISC estimate sits at $2,331 per ounce. The gap reflects temporary waste stripping and sector-wide input cost inflation in fuel and explosives, not a structural deterioration in the mine's cost base. An investor evaluating Florida Canyon solely on current-year AISC would substantially undervalue the asset's long-term economic profile.
This distinction between temporary cost pressure and structural cost deterioration is one of the most commonly misunderstood concepts in gold equity analysis. Input cost inflation driven by external commodity price cycles is a sector-wide phenomenon that does not alter the underlying ore body economics of a well-positioned mine.
Balance Sheet Strength and Self-Funded Growth
Serabi Gold ended its most recent quarter debt-free with $65.7 million in cash, funding exploration entirely through operating cash flow. This matters considerably more in a rising-rate environment than it would in a period of cheap capital. When the Federal Reserve is tightening policy expectations, the cost of external financing increases and investor appetite for mining equities with leverage to capital markets diminishes.
Producers that can fund their own growth avoid both the cost burden and the dilution risk that external financing introduces. In a tightening cycle, this balance sheet discipline creates a structural competitive advantage that is independent of where gold prices go in the next quarter.
Meanwhile, West Red Lake Gold Mines increased second-quarter production by 51% quarter over quarter and expects mined grades to advance toward 6 to 8 grams per tonne as operations move into higher-grade zones. Grade improvement is a form of internal value creation that does not require higher gold prices to translate into better economics.
Processing Infrastructure Ownership: The Payability Margin Lever
For producers mining refractory ore — where gold is locked within sulfide mineral matrices that resist conventional cyanide leaching — the question of who owns the pressure oxidation infrastructure is a first-order economic question.
Refractory ore must undergo pressure oxidation (POX) before standard processing can occur. Producers that rely on third-party toll milling for this step typically achieve payability rates of 55 to 60% of recovered metal value. By contrast, owner-operated POX infrastructure can increase payability to approximately 92%, a difference of more than 30 percentage points that flows directly into operating margin.
i-80 Gold is investing $430 million to refurbish its Lone Tree pressure oxidation facility, targeting this payability improvement as the central economic rationale for the capital expenditure. The margin improvement this generates is independent of gold price movements, making it one of the cleaner examples of internally driven value creation in the sector.
| Processing Approach | Payability Rate | Margin Implication |
|---|---|---|
| Third-party toll milling | 55-60% | Significant value leakage to processor |
| Owner-operated POX infrastructure | ~92% | Substantial margin retention improvement |
Separating the Trade from the Long-Term Investment Thesis
The practical framework for evaluating gold exposure in the current environment requires holding two distinct analytical lenses simultaneously. A thorough gold market analysis consistently reinforces the importance of distinguishing near-term rate-driven volatility from the multi-year structural thesis underpinned by sovereign accumulation.
| Time Horizon | Primary Driver | Key Risk | Strategic Approach |
|---|---|---|---|
| Days to weeks | Fed policy decisions and rate expectations | Sharp ETF-driven price swings | Measured position sizing; avoid concentrated directional bets |
| Months | Geopolitical developments and USD trajectory | Ceasefire breakdown or escalation | Monitor Hormuz situation alongside rate path |
| Years | Central bank reserve diversification | Structural policy reversal (low probability) | Evaluate gold as a strategic portfolio allocation |
The near-term trade is driven by Federal Reserve policy expectations and can produce sharp price movements over days or weeks. The long-term investment thesis is anchored by structural reserve diversification and operates over a multi-year horizon that is largely independent of any single rate decision. Conflating the two time horizons is the most consistent source of analytical error in gold market commentary.
Key Data Points: The Structural Case for Gold at a Glance
| Metric | Data Point | Significance |
|---|---|---|
| Central bank net buying streak | 15 consecutive years through 2024 | Sustained structural demand shift |
| 2024 central bank purchases | 1,045 tonnes | Third consecutive year above 1,000 tonnes |
| Q1 2026 central bank purchases | 244 tonnes | Above five-year average; above Q1 2025 |
| Gold share of official reserves (2025) | 27% | Up from 20% in 2024; now exceeds US Treasuries |
| US Treasuries share of official reserves | 22% | Now ranked below gold for first time |
| Reserve managers expecting global gold holdings to rise | 89% | World Gold Council 2026 survey |
| Institutions planning to increase own gold holdings | 45% | Record high in survey history |
| Western ETF 6-month outflows | >$12 billion | Rate-sensitivity of Western investment demand |
| People's Bank of China buying streak | 20 consecutive months | Systematic accumulation strategy |
| National Bank of Poland YTD 2026 purchases | 64 tonnes | Target-driven toward 700-tonne reserve goal |
The weight of evidence across these data points consistently points toward one conclusion: gold and central bank demand have become structurally linked in a way that meaningfully floors long-term price support regardless of what Western financial market participants do in response to any given Fed decision.
For investors, gold price risk and company-specific execution risk remain separate return drivers. A well-positioned producer with disciplined costs, a debt-free balance sheet, and owned processing infrastructure can still experience share price volatility following a hawkish Fed announcement. However, that volatility does not alter the underlying business. Understanding the difference is what separates a reactive gold trade from a considered gold investment.
Disclaimer: This article is intended for informational purposes only and does not constitute financial advice. Forecasts, projections, and analysis of future events involve inherent uncertainty. Readers should conduct their own due diligence and consult a qualified financial adviser before making any investment decisions. Past performance of any asset class is not indicative of future results.
Want to Position Yourself Ahead of the Next Major ASX Gold Discovery?
Discovery Alert's proprietary Discovery IQ model delivers real-time alerts the moment significant mineral discoveries are announced on the ASX, instantly cutting through complex data to surface actionable opportunities in gold and beyond — explore the historic returns major discoveries have generated to understand the magnitude of what early positioning can mean, then begin your 14-day free trial at Discovery Alert to ensure you never miss a market-moving find again.