
August 13, 2026
The Macro Disconnect: When Lower Rate Expectations Fail to Lift Gold
Most investors carry a straightforward mental model of gold's relationship with interest rates: when rate-hike probability falls, the opportunity cost of holding a non-yielding asset shrinks, and gold should rise. It is a logical framework, grounded in decades of observed behaviour. Yet markets regularly break this model, and understanding why is arguably more valuable than the model itself.
When gold falls as Fed hike odds drop, the instinctive reaction is confusion. The correct response is analysis. What the price action reveals in those moments is that gold's short-term trajectory is never governed by a single variable. It is the product of at least four competing forces: rate expectations, dollar dynamics, broader risk sentiment, and structural demand.
In any given session, one or more of these forces can overwhelm the others, producing outcomes that appear paradoxical on the surface but are entirely rational once the full picture is mapped. Furthermore, understanding gold's safe-haven role alongside rate dynamics is essential to making sense of these contradictions.
The relationship between Fed rate-hike odds and gold prices is not a simple inverse equation. Multiple macro variables compete simultaneously, and any individual session's price action may reflect positioning mechanics rather than a meaningful shift in gold's long-term investment thesis.
When big ASX news breaks, our subscribers know first
How Fed Rate-Hike Probability Actually Transmits Into Gold Prices
From CME FedWatch to Spot Markets: The Three-Step Mechanism
The CME FedWatch tool derives implied rate-hike probabilities from federal funds futures contracts, which are traded instruments reflecting collective market expectations about where the policy rate will sit at future Federal Open Market Committee meetings. These probabilities update in real time as economic data is released, making them a continuously shifting input into asset pricing.
The transmission from implied probability to gold price follows a three-step sequence:
- Rate expectations shift based on new data, changing the anticipated yield differential between US dollar assets and non-yielding alternatives.
- The US Dollar Index responds, typically strengthening when hike odds rise and weakening when they fall, because the dollar's relative yield appeal adjusts accordingly.
- Gold reprices in USD terms, moving inversely to dollar strength under normal conditions, since gold is globally priced in dollars and a stronger dollar reduces its purchasing power equivalence in other currencies.
The complication arises at step two. The dollar does not respond exclusively to rate expectations. It also functions as a global safe-haven currency, meaning that geopolitical stress, growth fear, or broad risk-off sentiment can independently drive dollar strength even when the rate backdrop is turning dovish. When that happens, gold can face simultaneous headwinds from dollar appreciation and a positioning unwind.
According to Investopedia's analysis of Fed rate hikes and gold, the historical relationship between rate moves and gold prices is far more nuanced than conventional wisdom suggests, with multiple variables frequently overriding the expected directional outcome.
The August 2026 Session: A Textbook Anomaly
The August 2026 CPI release provided a clear illustration of this dynamic in action. US CPI moderated to 3.4% year-over-year, easing from the prior 3.5% reading. The disinflationary signal was unambiguous: CME FedWatch implied probability for a September rate hike collapsed from 55% to 36% in the week following the print.
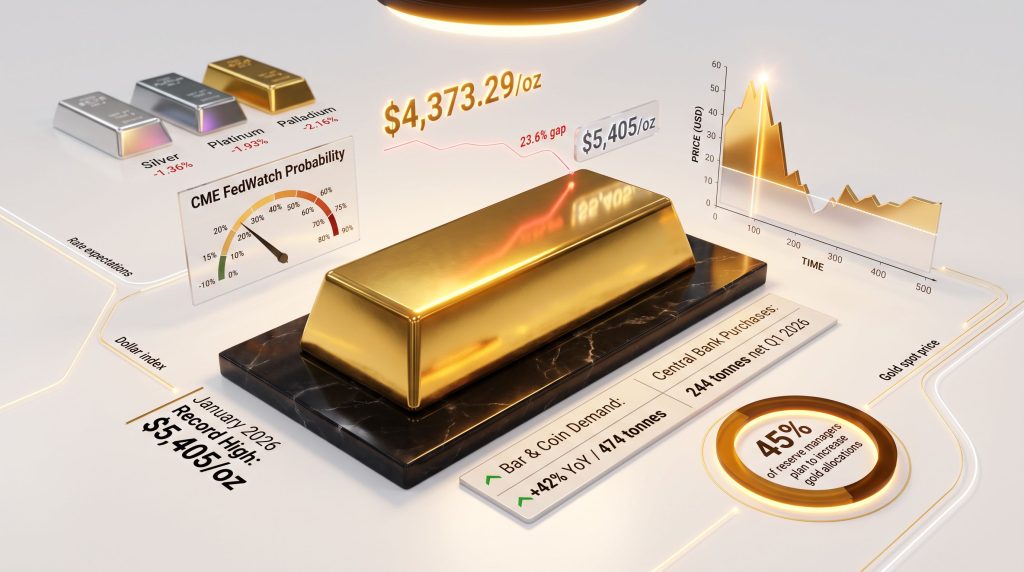
Despite this, spot gold retreated 0.7% to $4,373.29/oz, having briefly touched a two-month high earlier in the session. December gold futures declined 0.8% to $4,430.20/oz, confirming the selling extended beyond spot markets and represented a genuine positioning reset across the futures curve.
| Period | September Hike Odds (Before) | September Hike Odds (After) | Gold Price Move | Primary Driver |
|---|---|---|---|---|
| Week prior to August 2026 CPI | 55% | 36% | -0.7% to $4,373.29/oz | Profit-taking + dollar safe-haven bid |
| June 2026 (tightening signal) | ~29% | ~69% | Declined | Dollar firmed on rate expectations |
| July 2026 (soft jobs data) | Elevated | ~18% | Rose | Rate pressure eased, dollar weakened |
Source: CME FedWatch, World Gold Council; compiled for analytical reference. Past performance is not indicative of future results.
What drove the sell-off was not a deterioration in gold's fundamental case. Independent market analyst Ross Norman attributed the pullback to two concurrent forces: pre-event positioning being liquidated after the data resolved, and a resilient safe-haven bid for the US dollar acting as a near-term headwind, delaying what he characterised as an otherwise constructive longer-term advance for the metal.
The Precious Metals Complex: Reading Synchronized Declines Correctly
Cross-Asset Correlation as a Diagnostic Signal
One of the most underappreciated analytical tools available to gold investors is cross-metal correlation during sell-off sessions. When gold declines in isolation, it demands metal-specific investigation. When the entire precious metals complex falls simultaneously, the signal changes fundamentally: it indicates a systemic positioning event rather than a structural deterioration in any individual metal's fundamentals.
The August 2026 session produced precisely this pattern across the complex:
- Silver: declined 1.36% to $64.41/oz
- Platinum: fell 1.93% to $1,722.65/oz
- Palladium: dropped 2.16% to $1,339.87/oz
- Gold: retreated 0.7% to $4,373.29/oz
The fact that palladium and platinum, which have fundamentally distinct demand drivers rooted in industrial and automotive applications rather than monetary demand, experienced even larger percentage declines than gold confirms the sell-off was driven by portfolio-level risk management and macro-event resolution.
What the $4,387/oz Technical Level Represents
Gold's breach of the $4,387/oz level during the August session amplified the magnitude of the sell-off beyond what the underlying fundamentals could justify. This is a characteristic of price levels that function as aggregation points for stop-loss orders and algorithmic trading triggers. When support is broken, automated selling layers activate, generating additional downward momentum that is mechanical rather than fundamental in origin.
Understanding the distinction between a technical support failure and a fundamental demand deterioration is critical for positioning decisions. The former creates short-term volatility; the latter would require reassessing the entire structural thesis. The August session represented the former category exclusively. In addition, gold and bond dynamics during these periods further reinforce why price dislocations often resolve in gold's favour over subsequent weeks.
The Structural Demand Architecture That Short-Term Prices Do Not Reflect
Central Bank Accumulation: A Demand Floor Operating on Sovereign Timescales
While short-term gold price movements are dominated by futures positioning and macro sentiment shifts, the demand architecture beneath these flows operates on an entirely different timescale. Central bank gold demand reached 244 tonnes net in Q1 2026, establishing a sustained institutional demand baseline that is structurally insulated from individual inflation prints.
Perhaps more significant than the volume figure is the forward-looking survey data from the World Gold Council. A record 45% of central bank reserve managers indicated plans to increase gold allocations within the next 12 months, up from 43% the prior year. The World Gold Council's head of central banks research characterised this as a shift in how sovereign institutions are treating gold: no longer as a passive reserve holding, but as an active strategic allocation within reserve portfolios.
This framing matters for investors. When sovereign wealth managers with multi-year mandates treat gold as a strategic asset rather than a legacy holding, the demand floor they create is structurally different from speculative positioning. Reserve managers do not exit positions because of a single CPI print. Their purchasing decisions are driven by:
- De-dollarisation strategies in emerging market economies seeking to reduce reserve concentration risk
- Geopolitical risk hedging amid ongoing multipolarity in global trade and finance
- Reserve diversification away from single-currency dominance
None of these motivations are materially altered by a 0.1 percentage point moderation in US CPI.
The Venezuela Case: Gold as a Reserve Asset Under Hyperinflationary Stress
An often-overlooked lens for understanding gold's role as a sovereign reserve asset is the Venezuela situation. Approximately 31 metric tonnes of Venezuelan gold continue to be held at the Bank of England under disputed circumstances, representing roughly $4 billion in reserve value. With Venezuela's domestic annual inflation reaching 575.9%, that gold stockpile represents a purchasing power anchor of enormous strategic importance.
When domestic currency loses purchasing power at hyperinflationary rates, gold's reserve function is validated empirically, not theoretically. This is precisely why emerging market central banks are accelerating accumulation even at elevated price levels.
This case is not an isolated footnote. It is a live demonstration of why reserve managers in economies with currency vulnerability are assigning increasing strategic weight to gold, independent of near-term price volatility.
Investment Demand vs. Jewellery: Why the Distinction Matters for Portfolio Construction
Bar-and-Coin Demand at Near-Record Levels
The Q1 2026 demand data revealed a striking divergence in how different categories of gold buyers responded to elevated prices. Retail bar and coin demand surged 42% year-over-year to 474 tonnes, the second-highest quarterly total ever recorded. This is counter-cyclical behaviour: investors accumulating physical gold because prices are elevated reflects conviction in the directional thesis, not price-insensitive consumption.
At the same time, US jewellery demand fell to a record quarterly low, driven by straightforward price elasticity. When the metal becomes expensive, consumers defer discretionary jewellery purchases. This is entirely expected and carries no negative signal for the investment case. For investors weighing their options, understanding the differences between physical gold vs ETFs can help clarify which vehicle best captures this structural demand trend.
| Demand Category | Q1 2026 Performance | Price Sensitivity | Investor Signal |
|---|---|---|---|
| Bar and Coin | +42% YoY / 474 tonnes | Low (counter-cyclical) | Bullish: investors accumulating at high prices |
| Jewellery | Record quarterly low | High (price-elastic) | Neutral: consumer pullback at elevated prices |
| Central Bank Purchases | 244 tonnes net | Very low (strategic mandate) | Strongly bullish: structural demand floor |
The analytical error that many investors make is treating gold demand as a monolithic figure. Combining investment demand with jewellery consumption produces a blended metric that obscures the diverging signals within the data. Portfolio construction should be informed by investment demand and central bank accumulation, which carry directional conviction, rather than jewellery volumes.
The World Gold Council and the Artisanal Gold Council's recently signed five-year traceability agreement adds another layer to this structural story. By building institutional infrastructure for compliant sourcing of artisanal gold, the agreement expands the accessible supply base for institutions that require transparent provenance documentation, supporting the scalability of sovereign and institutional purchasing programmes over time.
What Comes Next: Catalysts, Scenarios, and Positioning Discipline
The PPI Release as the Immediate Rate-Expectations Inflection Point
With September Fed hike odds having declined sharply following the CPI print, the next critical data release is the US Producer Price Index. PPI functions as an upstream leading indicator for future consumer inflation, and its direction relative to market expectations will materially influence whether the September hike probability stabilises at 36%, rebounds toward 50%, or continues falling below 30%.
Two distinct scenarios emerge from this data dependency:
Scenario A: PPI surprises to the upside, September hike odds rebound above 50%
- Dollar safe-haven premium strengthens
- Rate competition with non-yielding gold intensifies
- The $4,387/oz technical level becomes a more significant resistance point on any recovery attempt
Scenario B: PPI comes in soft, September hike odds decline further below 30%
- Dollar safe-haven premium erodes without an independent geopolitical catalyst
- Gold's non-yielding characteristic becomes a diminishing competitive disadvantage
- Structural demand from central banks and retail investors provides a recovery foundation
The January 2026 record high of $5,405/oz establishes the longer-term upside reference architecture. The distance between current spot prices near $4,373/oz and the prior record represents approximately 23.6% potential upside to the previous peak. The broader gold price outlook contextualises this current volatility within what remains a structurally intact bull cycle.
Why Position Sizing Outperforms Event-Timing Strategies
The August 2026 session demonstrated a fundamental truth about trading around macro data releases: even when the directional outcome is favourable, the price response can move against the anticipated direction. Traders who built long exposure ahead of the CPI print in anticipation of a dovish outcome experienced losses in the immediate session despite being correct about the direction of the data.
This asymmetry between correct macro analysis and adverse short-term price outcomes is why institutional gold investors consistently emphasise position sizing discipline over event-timing precision. Furthermore, a framework that prioritises incremental accumulation during volatility periods, informed by quarterly demand data rather than individual session price action, has a structurally higher probability of capturing the directional trend.
| Signal Type | Timeframe | Reliability | Actionability |
|---|---|---|---|
| Single CPI or PPI print | Intraday to 1 week | Low | Position sizing only |
| CME FedWatch implied probability | 1 to 4 weeks | Moderate | Tactical adjustment |
| Central bank demand data (quarterly) | 3 to 12 months | High | Strategic allocation |
| Reserve manager survey (annual) | 12+ months | Very high | Long-term thesis validation |
A sustained close above $4,387/oz would signal the recovery of near-term technical support and restore confidence in the short-term setup. Until that level is reclaimed, the path of least resistance remains choppy while the dollar maintains its safe-haven premium. As CNBC reported, gold falls as Fed hike odds shift and the dollar firms, a pattern that has repeated consistently across multiple macro data cycles in 2026.
The next major ASX story will hit our subscribers first
Frequently Asked Questions: Gold, Fed Hike Odds, and Structural Demand
Why does gold fall when Fed hike odds drop?
Gold's short-term price is shaped by multiple simultaneous forces. Following major data releases, pre-positioned traders often exit regardless of the outcome, creating selling pressure that overwhelms the directionally favourable macro signal. A concurrent safe-haven bid for the US dollar, driven by factors independent of rate expectations, can add further downward pressure on dollar-denominated gold.
What is the most reliable signal for gold's structural direction?
Central bank demand data published quarterly by the World Gold Council carries the highest reliability for directional conviction. The combination of 244 tonnes net purchased in Q1 2026 and a record 45% of reserve managers planning further increases within 12 months provides a more durable signal than any individual inflation print.
What price level would restore gold's near-term technical confidence?
A sustained close above $4,387/oz would signal recovery of the key support threshold that was breached during the August positioning unwind. The January 2026 all-time high of $5,405/oz remains the longer-term reference point for the structural bull case.
Does falling jewellery demand indicate weakness in gold's investment thesis?
No. Jewellery demand is price-elastic consumer behaviour. When gold prices are elevated, discretionary jewellery purchases naturally decline. The investment thesis is validated by bar and coin demand, which rose 42% year-over-year to 474 tonnes in Q1 2026, and by central bank accumulation, both of which moved counter-cyclically at elevated price levels.
Disclaimer: This article is for informational purposes only and does not constitute financial advice. Gold markets involve significant risk. Past performance and historical demand data are not reliable indicators of future price movements. Investors should conduct independent research and seek professional financial advice before making investment decisions.
Want to Identify the Next Major Mineral Discovery Before the Broader Market?
While gold's macro dynamics play out across sovereign reserve portfolios and Fed rate cycles, Discovery Alert's proprietary Discovery IQ model scans the ASX daily to deliver real-time alerts on significant mineral discoveries — including gold and precious metals — translating complex data into actionable opportunities the moment they are announced. Explore historic discoveries and their market-moving returns, then begin your 14-day free trial to position yourself ahead of the market.