
August 8, 2026
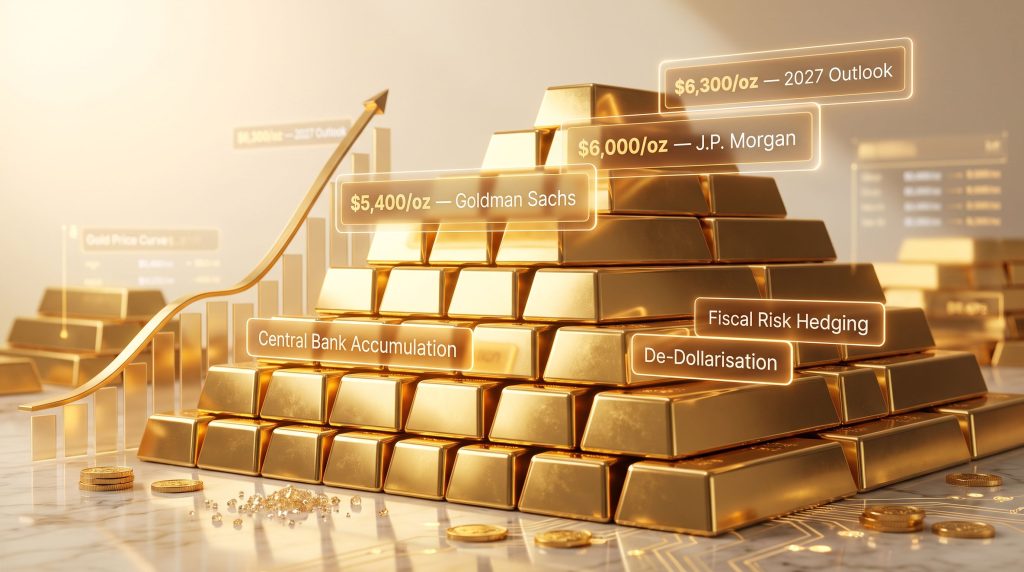
Why the Gold Market Upside Story Is More Structural Than Speculative
Every decade or so, gold enters a phase where the investment community debates whether prices have overextended or whether a new paradigm is genuinely taking hold. The current environment sits firmly in the second camp. Unlike previous rallies largely driven by fear-of-the-moment or speculative futures positioning, the forces pushing gold higher in 2025 reflect genuine gold market upside potential. Central banks are restructuring reserve portfolios, governments are running historically elevated fiscal deficits, and the geopolitical order underpinning dollar dominance for decades is visibly fragmenting.
Understanding the gold market upside case today requires stepping back from short-term price charts and examining why institutions managing trillions of dollars in assets have reached a directional consensus that would have seemed extreme just a few years ago.
When big ASX news breaks, our subscribers know first
How This Gold Cycle Differs From 2011 and 2020
Gold's previous major peaks are instructive precisely because of how different they were from today's setup. The 2011 peak near $1,900/oz was heavily driven by speculative futures positioning and retail investor enthusiasm that followed the post-GFC monetary expansion. When the Federal Reserve signalled policy normalisation, gold fell sharply and spent nearly a decade in a structural downtrend.
The 2020 pandemic surge to approximately $2,075/oz was similarly reactive, driven by emergency monetary conditions and a temporary collapse in real yields. As vaccination programmes advanced and economies reopened, the primary catalyst unwound.
The current cycle is architecturally different in several key respects:
- Sovereign-level demand, rather than retail or hedge fund positioning, is the dominant driver
- Central bank gold buying has remained elevated for multiple consecutive years, not just a single crisis response
- De-dollarisation is a structural policy shift among emerging market economies, not a tactical trade
- Fiscal expansion in major economies has become politically entrenched, sustaining inflation hedging demand
- Geopolitical fragmentation is multi-vector and prolonged, not a single resolvable flashpoint
This combination creates a demand profile that is far more durable than anything seen in previous gold bull markets.
The Multi-Force Framework Behind Gold's Bullish Bias
Central Bank Accumulation as a Structural Demand Floor
Perhaps the most underappreciated driver of the current gold market upside is sovereign buying behaviour. Emerging market central banks, particularly across Asia, the Middle East, and Eastern Europe, have been systematically increasing gold allocations as part of broader reserve diversification strategies. Furthermore, this is not a cyclical phenomenon responding to short-term dollar volatility. It represents a long-term recalibration of how nations structure their reserve assets in response to geopolitical risk and the weaponisation of financial systems.
The critical implication is that central bank demand effectively creates a relatively price-insensitive buyer base. Unlike retail investors or hedge funds who might reduce exposure during a price consolidation, central banks buying gold for reserve purposes are not primarily motivated by short-term return optimisation. This sovereign demand establishes a price floor that limits meaningful downside even during periods of broader risk appetite.
Geopolitical Uncertainty as a Persistent Safe-Haven Catalyst
Historical analysis consistently shows that gold responds more durably to prolonged, unresolved geopolitical tension than to acute crisis events. Acute crises produce sharp but short-lived spikes. Sustained ambiguity, where investors cannot see a clear resolution pathway, generates persistent safe-haven premium.
The current global landscape features multiple simultaneous flashpoints without clear resolution timelines. This structural uncertainty is arguably more bullish for sustained gold prices than any single geopolitical event. Consequently, markets cannot price in a resolution they cannot see, so the safe-haven component of gold's price remains continuously supported.
Monetary Policy Expectations and Real Yield Dynamics
The relationship between real yields and gold prices is one of the most reliable correlations in financial markets. When real yields — nominal yields minus inflation expectations — are low or negative, the opportunity cost of holding gold, which pays no income, diminishes significantly. In this context, understanding gold and bond dynamics is essential for any serious investor.
When real yields are negative, gold is not just a hedge. It becomes a rational portfolio component by pure yield comparison. Expectations of a softening Federal Reserve stance have been progressively priced into gold futures markets. A Fed that pivots toward rate reductions, or even simply holds rates steady while inflation remains above target, sustains the real yield environment that supports gold at elevated prices.
Fiscal Risk Hedging and Inflation Insurance Demand
Sovereign debt levels in major economies have reached historic highs. The United States, Japan, and multiple European nations carry debt-to-GDP ratios that structurally constrain future policy flexibility. Investors increasingly treat gold as insurance against fiscal deterioration, not just consumer price inflation. Even when inflation remains contained, the potential for monetisation of sovereign debt is sufficient to sustain a store-of-value premium.
ETF inflows provide a real-time barometer of this hedging behaviour. Sustained inflows into gold-backed exchange-traded products signal that institutional and retail investors are actively buying and holding gold, not simply trading it. Persistent inflow trends are a qualitatively different signal from speculative futures open interest.
What Are the Major Bank Price Forecasts for Gold in 2026 and 2027?
Institutional price targets for gold in 2026 and 2027 reflect genuine conviction rather than incremental adjustments. The range of forecasts is wide, but the direction is uniform. For a comprehensive gold price forecast breakdown, the data paints a consistently bullish picture across major institutions.
Institutional Price Target Comparison
| Institution | 2026 Price Target | 2027 Outlook | Key Driver Cited |
|---|---|---|---|
| J.P. Morgan | ~$6,000/oz (Q4 avg) | Up to $6,300/oz | Geopolitics + Fed policy path |
| Goldman Sachs | $5,400/oz (Dec 2026) | Upside skewed higher | Private-sector diversification |
| UBS | $5,000/oz (near-term) | Constructive | Macro + policy hedging demand |
| Morgan Stanley | $4,400/oz (2026) | Further upside possible | Weaker USD + ETF + central banks |
| World Gold Council | $4,500-$5,000/oz | Catalyst-dependent | Sustained structural demand |
According to J.P. Morgan's gold research, the case for elevated prices rests on compounding macro and geopolitical pressures that are unlikely to resolve quickly.
The spread between the most conservative estimate at $4,400/oz and the most aggressive at $6,300/oz does not represent disagreement about direction. Every major institution in this table is forecasting higher gold prices. The divergence is entirely about the pace and magnitude of catalysts that are already identified and already in motion.
What Would Need to Happen for Gold to Reach $6,000/oz?
J.P. Morgan's case for a $6,000/oz average in Q4 2026 is not a tail-risk scenario. It is a base case built on a specific set of conditions that remain plausible:
- The Federal Reserve pivots toward sustained easing, keeping real yields suppressed
- Central bank reserve diversification continues accelerating, particularly among BRICS-aligned economies
- Gold ETF inflows return to or exceed the levels seen during the 2020 pandemic period
- The US dollar index continues weakening, amplifying gold's attractiveness for non-USD buyers
- Geopolitical tensions across multiple active flashpoints remain unresolved
What Could Derail the Gold Market Upside Case?
- A decisive Fed pivot back toward tightening, driving real yields sharply higher, represents the most credible near-term risk
- Broad resolution of multiple simultaneous geopolitical tensions would remove the safe-haven premium
- Sustained profit-taking by institutional holders following an extended price run could create a significant technical correction
- A broad rotation toward risk assets pulling capital from defensive allocations
Where Is Gold Trading and What Are the Key Technical Levels?
From a technical structure perspective, gold is currently positioned above key long-term moving average thresholds, sustaining a constructive trend bias. Traders and technical analysts are watching several price zones closely.
Key resistance levels include approximately $5,235, $5,342, and the record-area ceiling near $5,598. A sustained break above $5,598 would likely accelerate momentum buying and draw significant media and retail attention, potentially creating a self-reinforcing demand dynamic.
Support levels in the $4,800 to $5,000 range represent the zone that bulls need to defend to maintain the structural uptrend. A sustained break below this zone would shift the narrative considerably.
Critical Market Psychology Point: Gold markets in momentum phases tend to attract speculative capital that amplifies moves in both directions. Distinguishing between genuine institutional accumulation and momentum-chasing is essential for assessing how durable any given price level is. Open interest in futures markets and ETF holding trends provide cleaner signals than price action alone.
Short-Term vs. Long-Term Gold Upside: A Scenario-Based Analysis
Short-Term Outlook (0-6 Months)
- Base case: Gold consolidates with a constructive bias, testing resistance in the $5,235-$5,342 range without decisive breakouts
- Bull case: A softer-than-expected Fed signal or escalating geopolitical event pushes price toward the $5,598 record zone
- Bear case: Dollar strength and risk-on equity rotation compress gold back toward $4,800-$5,000 support
6-12 Month Institutional Consensus
Institutional forecasts for the 12-month window cluster between $4,400/oz and $5,400/oz, with J.P. Morgan's $6,000/oz average representing the high-conviction bull scenario for Q4 2026. The World Gold Council's $4,500-$5,000 range reflects an environment where catalysts remain active but do not dramatically accelerate.
The $6,300 Scenario: Beyond 2026
J.P. Morgan's projection of $6,300/oz by end-2027 assumes that the current constellation of geopolitical and monetary catalysts not only persists but deepens. Historical precedent exists for this. The 2001-2011 gold bull market, during which gold climbed from approximately $250/oz to nearly $1,900/oz, was sustained for a full decade by a compounding set of factors. No single event drove that decade-long rally. The same structural logic applies today at a much higher absolute price level.
The next major ASX story will hit our subscribers first
Physical Gold vs. Gold Miners: Where Does the Better Upside Sit?
The Operating Leverage Dynamic Explained
One of the most powerful but least understood dynamics in commodity investing is operating leverage. For gold mining companies, the profit margin on each ounce produced is determined by the difference between the gold price and the all-in sustaining cost (AISC) of production. AISC for major producers typically ranges between $1,100/oz and $1,500/oz depending on jurisdiction, orebody grade, and operational efficiency.
When the gold price moves from $4,400/oz to $5,400/oz — a $1,000/oz increase in revenue per ounce — the cost base does not move proportionally. If a miner's AISC is $1,200/oz, their margin at $4,400/oz is $3,200/oz. At $5,400/oz, the margin becomes $4,200/oz, a 31% increase in profit per ounce from a roughly 23% increase in the gold price. Understanding gold mining equity leverage is therefore essential for investors seeking amplified exposure to rising gold prices.
Key Risk Factors Specific to Mining Equities
- Operational disruptions including equipment failure, labour disputes, and weather events
- Jurisdiction risk, particularly in politically unstable mining regions
- Capital expenditure requirements that can consume cash flows during expansion phases
- Producer hedging programmes that lock in sales at lower prices, capping upside during rallies
- Balance sheet leverage that amplifies downside during gold price corrections
ASX-Listed Gold Sector Considerations
Australian gold producers carry a structurally advantageous position in the current environment. Gold is priced globally in US dollars, and Australian producers sell gold but incur most costs in Australian dollars. When the Australian dollar weakens against the USD, the AUD-denominated gold price rises even if the USD gold price is flat. This currency amplification effect has historically provided Australian producers with an additional buffer during periods of global uncertainty.
What Are the Primary Investment Vehicles for Capturing Gold Market Upside?
Comparison of Gold Exposure Methods
| Vehicle | Upside Capture | Liquidity | Risk Profile | Best Suited For |
|---|---|---|---|---|
| Physical gold (bullion/coins) | Direct 1:1 | Low-Medium | Low | Long-term store of value |
| Gold ETFs | Near 1:1 | High | Low-Medium | Portfolio hedging, tactical |
| Gold futures | Leveraged | Very High | High | Sophisticated short-term traders |
| Gold mining equities | Amplified (2-3x+) | Medium-High | Medium-High | Growth-oriented investors |
| Gold royalty/streaming companies | Amplified, lower risk | Medium | Medium | Income and growth hybrid |
Royalty and streaming companies deserve particular attention as a vehicle that captures operating leverage without direct exposure to production costs. These companies provide upfront capital to mining operations in exchange for the right to purchase gold at a fixed, below-market price in perpetuity. The result is a business model with dramatically lower cost exposure, higher margins, and greater diversification than direct equity in a single producer.
Investor Consideration: Australian investors should also account for the distinct tax treatment of each vehicle. Physical gold and ETFs may attract capital gains tax with access to the 50% CGT discount for assets held longer than 12 months, while mining equities carry dividend and franking credit considerations. Royalty and streaming structures may carry international tax complexities depending on the entity's domicile. Investors can also monitor live gold price movements to stay informed on current market conditions.
Frequently Asked Questions About Gold Market Upside
What is the current gold price forecast for the end of 2026?
Institutional forecasts range from approximately $4,400/oz (Morgan Stanley) to $6,000/oz (J.P. Morgan), with Goldman Sachs projecting $5,400/oz by December 2026. The variance reflects differing assumptions about Federal Reserve policy speed and the pace of central bank reserve diversification globally.
Why do analysts maintain a bullish view even after a significant price rally?
The structural forces driving gold are not responding to a single event or temporary condition. Central bank buying, fiscal risk hedging, and geopolitical safe-haven demand represent multi-year shifts in how gold is valued within global portfolios. Analysts characterising these as durable argue that gold has not been speculatively repriced but fundamentally re-evaluated.
What is the biggest risk to the gold upside thesis?
A decisive and sustained pivot back toward monetary tightening by the Federal Reserve, pushing real yields meaningfully higher, is the most credible near-term threat. Resolution of major geopolitical tensions would simultaneously remove a significant component of gold's safe-haven premium.
How does a weaker US dollar affect gold prices?
Gold is denominated globally in US dollars. When the dollar weakens, gold becomes less expensive for buyers holding other currencies, mechanically stimulating international demand. Beyond the mechanical effect, dollar weakness is typically associated with reduced confidence in US monetary and fiscal credibility — the same conditions that motivate safe-haven allocation to gold.
What role do central banks play in supporting gold prices?
Central banks, particularly in emerging markets pursuing reserve diversification, have become among the most consistent gold buyers in recent years. Their purchasing behaviour is driven by strategic asset allocation policy rather than return optimisation, making them relatively insensitive to short-term price moves and providing structural price support that retail and institutional investors cannot easily replicate.
Key Takeaways
- The directional consensus among major financial institutions is firmly bullish, with price targets ranging from $4,400/oz to $6,300/oz depending on scenario and time horizon
- The current gold market upside thesis is anchored in structural forces including central bank demand, fiscal risk hedging, real yield dynamics, and de-dollarisation, not speculative momentum alone
- Meaningful further upside from current levels will likely require new catalysts: a softer Federal Reserve posture, escalating geopolitical pressure, or accelerating dollar weakness
- Gold mining equities offer amplified upside through operating leverage but carry additional operational, jurisdictional, and balance sheet risks absent from physical or ETF exposure
- Australian investors benefit from an additional currency amplification dynamic, with AUD weakness versus USD mechanically lifting the domestic gold price for locally domiciled producers
- Investors should match their gold exposure vehicle to their time horizon, risk tolerance, and portfolio role, and should not treat all gold investments as interchangeable
This article is intended for informational purposes only and does not constitute financial advice. All forecasts and price targets referenced are sourced from publicly available institutional research and are subject to change. Past performance is not indicative of future results. Investors should seek independent financial advice before making investment decisions.
Want to Position Yourself Ahead of the Next Major Gold Discovery?
Discovery Alert's proprietary Discovery IQ model delivers real-time alerts on significant ASX mineral discoveries, instantly translating complex data across 30+ commodities into clear, actionable insights for investors seeking exposure to the gold sector's structural upside — explore historic discovery returns to understand the magnitude of opportunities that major finds can generate, and begin your 14-day free trial at Discovery Alert to secure your market-leading edge today.