July 16, 2026
When Monetary Policy Expectations Become the Market
Most commodity investors focus on supply deficits, mine output, and physical demand. Yet for gold, the single most powerful price driver over short to medium timeframes is something far more abstract: the collective expectation of where interest rates are heading, not where they currently stand. This distinction matters enormously. Markets do not wait for policy decisions. They price them weeks or months in advance, and when those expectations shift rapidly, gold can move sharply in either direction before the Federal Reserve has touched a single lever.
That dynamic is playing out with unusual force in mid-2026. The gold price and Fed rate hike odds have become inseparably linked, and the current configuration, with an 85% probability assigned to a December rate hike, is presenting investors with one of the more complex macro environments in recent memory. Understanding how these variables interact is essential for anyone tracking the gold price forecast through the remainder of the year.
When big ASX news breaks, our subscribers know first
The Opportunity Cost Mechanism and Why It Drives Gold More Than Most Realise
Gold's sensitivity to interest rates stems from a fundamental characteristic: it generates no income. Every dollar held in gold is a dollar that could otherwise be invested in a Treasury instrument, a money market fund, or an interest-bearing deposit. When the market expects rates to rise, the income gap between gold and yield-bearing alternatives widens, and capital naturally gravitates toward assets that pay.
This is the opportunity cost mechanism, and it is routinely underestimated by retail investors who focus purely on inflation or geopolitical headlines. The more precise insight is that gold does not primarily respond to rate decisions themselves. It responds to changes in expectations about future rate decisions. A repricing from 50% to 85% hike probability, as markets experienced following the June 2026 FOMC meeting, carries far greater near-term price impact than the actual decision to hold rates steady. Furthermore, the gold and bond dynamics at play here reinforce this sensitivity across multiple asset classes.
The Dollar Amplifier Effect
Rising rate hike expectations do not operate in isolation. They simultaneously strengthen the U.S. dollar, which creates a compounding headwind for gold through a separate channel. Because gold is priced globally in U.S. dollars, a stronger dollar directly reduces the purchasing power of international buyers. A Japanese institution, a Brazilian family office, or a South African pension fund all face a higher effective price for gold when the dollar appreciates, regardless of what spot prices show in dollar terms.
The Federal Reserve Board's broad trade-weighted dollar index illustrates this dynamic clearly:
| Date Reference | Dollar Index Level | Context |
|---|---|---|
| January 2, 2026 | 119.61 | Year-open baseline |
| Late March 2026 | 121.29 | Cycle peak |
| June 12, 2026 | 119.51 | Post-FOMC close |
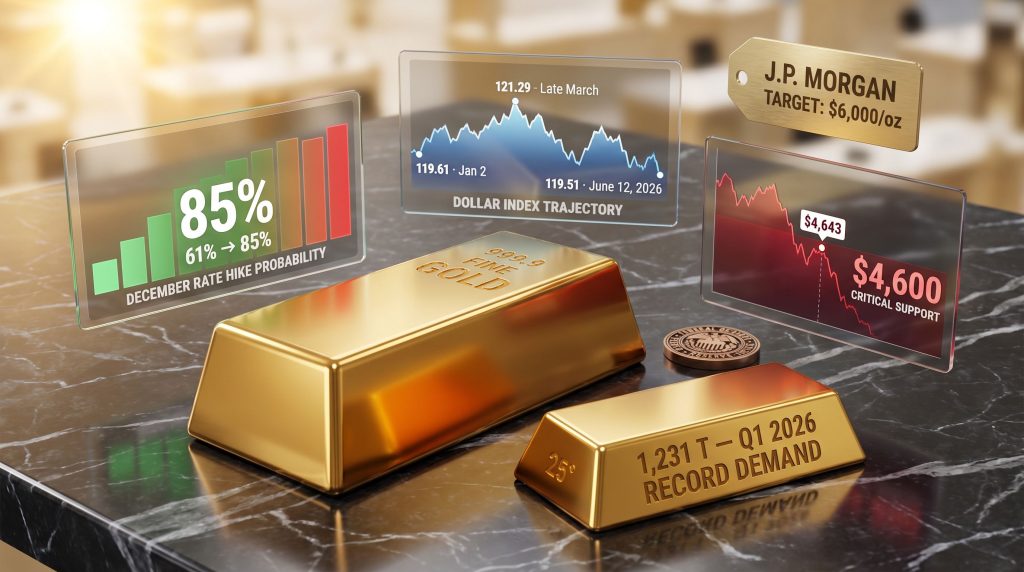
The index closed at 119.51 on June 12, 2026, sitting approximately 1.5% below its late-March peak while remaining essentially flat against the January 2 opening level of 119.61. This relative stability means the dollar is not yet delivering the full compounding headwind it would in a sustained appreciation cycle. However, the directional bias, supported by hawkish Fed expectations, remains unfavourable for gold. Analysts tracking Fed rate hike expectations note that this dollar pressure tends to compound when futures markets price in multiple consecutive hikes.
A 24-Point Repricing: What Happened to December Rate Hike Odds
The June 2026 FOMC meeting did not produce a rate change. The Fed held its benchmark at 3.50%–3.75%. Yet the market reaction in rate futures was significant. December hike probability jumped from approximately 61% to 85% within a single trading session, a 24-percentage-point move that represents one of the more abrupt single-day repricing events in recent Fed Funds futures markets.
To understand why, context from the weeks prior is essential:
- May nonfarm payrolls came in at 172,000 jobs added, nearly double the 85,000 consensus forecast, signalling a labour market that remains far more resilient than the Fed's own projections implied.
- Both PPI and CPI data for May printed above consensus, reinforcing the view that inflation is not retreating fast enough to justify a policy pause.
- The FOMC dot plot revealed that 9 of 19 policymakers were projecting at least one additional rate increase during the current calendar year, confirming a hawkish internal bias even without an immediate action.
Prior to the June meeting, December hike odds had already climbed from 48% to 63% following the May employment data. The FOMC meeting accelerated that repricing significantly.
Fed Chair Kevin Warsh's post-meeting guidance further reinforced that policymakers retain the option to tighten again if economic growth and inflation remain at elevated levels. This combination of data surprises and internal Fed hawkishness created the conditions for a rapid, market-wide reassessment of the rate path. Consequently, the gold price and Fed rate hike odds have rarely been more tightly correlated than they are today.
The US-Iran Ceasefire: A Temporary Disinflationary Catalyst
While rate expectations were tightening, a separate geopolitical development introduced a short-term counterforce. A 14-point interim agreement between the United States and Iran extended a prior ceasefire arrangement by 60 days and established a framework for continued diplomatic negotiations. The agreement's provisions include potential sanctions relief affecting Iranian oil exports and the reopening of key regional shipping corridors.
The immediate market effect was a decline in oil prices. Lower energy costs feed directly into reduced near-term inflation expectations, which in turn temporarily softened one of the bearish arguments for gold, namely that rising inflation would prompt more aggressive Fed tightening.
Short Covering and the 1.4% Rebound: What It Does and Does Not Mean
Spot gold rose 1.4% to $4,316.42/oz following the oil price decline, recovering from a prior session loss of 1.7%. The metal later traded near $4,329/oz. This move was almost entirely technical in nature, driven by short covering, where traders who had sold gold anticipating continued weakness bought back positions as the inflation catalyst temporarily eased.
This distinction is critical for investors trying to read the signal:
- The rebound reflected lower inflation expectations triggered by falling oil, not a reversal of Fed policy direction.
- The underlying 85% December hike probability remained fully intact after the bounce.
- Short-covering rallies in commodity markets are common and frequently mislead investors into treating technical noise as fundamental trend changes.
The ceasefire remains provisional. Any breakdown in the 60-day diplomatic window could push oil prices sharply higher, reignite inflation expectations, and create a counterforce to Fed hawkishness that could benefit gold significantly.
The 60-Day Window: Variables Worth Monitoring
The provisional nature of the agreement creates a defined catalyst timeline. Key developments to watch include:
- Whether sanctions relief on Iranian crude exports is formally implemented, which would add supply to global markets and further cap energy prices.
- The status of regional shipping route reopening, which affects energy transport costs across multiple markets.
- Whether formal negotiations progress toward a permanent settlement, or whether talks stall and military risk re-escalates.
Technical Damage Assessment: Where Gold Stands Structurally
The accumulation of hawkish data and the FOMC repricing event produced measurable technical damage to gold's price structure during May and June 2026:
- Week ending June 5, 2026: Gold declined nearly 4%, erasing all year-to-date gains.
- Critical support breach: The metal fell below the $4,700 level, touching an intraday low of $4,643 before closing at $4,649.
- Next support zone: Approximately $4,600, with further downside risk toward $4,560 if bearish momentum resumes.
A sustained close below $4,600 would represent a structurally significant breakdown. The $4,560 area then becomes the next meaningful reference point for both fundamental and algorithmic participants. Conversely, the most direct catalyst for a gold recovery would be a sustained decline in December rate hike odds from the current 85% level. It is also worth considering how gold in recession scenarios have historically produced sharp technical reversals from similar support zones.
The Structural Demand Floor: Why Bears Should Not Dismiss Gold Entirely
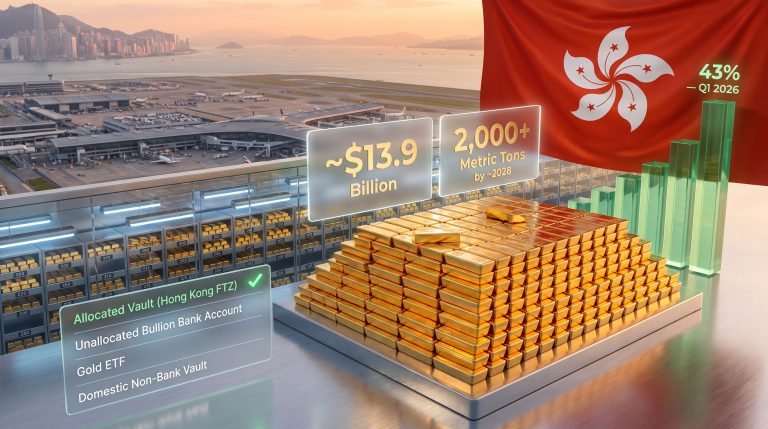
Despite the rate-driven headwinds, dismissing gold's underlying fundamentals would be a mistake. Global gold demand reached 1,231 tonnes in Q1 2026, a record quarterly figure. Central bank gold demand contributed 244 tonnes of that total, reflecting continued institutional diversification away from dollar-denominated reserve assets, a trend that shows no signs of reversing regardless of near-term Fed policy direction.
The IMF's current macro baseline, projecting 5.4% global inflation against 2.5% GDP growth, describes a stagflationary backdrop that historically provides durable support for gold. In environments where inflation stays elevated but growth slows, gold's dual role as both an inflation hedge and a recessionary risk buffer becomes more operationally relevant. Furthermore, gold's gold safe-haven role tends to strengthen precisely when stagflationary conditions persist.
J.P. Morgan's projection of gold reaching $6,000/oz by the end of 2026 rests on a specific conditional assumption: that the Federal Reserve does not crystallise a sustained rate-hiking cycle. Under that scenario, Western ETF inflows would resume, central bank demand would continue at its current pace, and dollar appreciation would remain contained. At current futures pricing, this scenario carries an implied probability of approximately 15%. Historical analysis from Investopedia on the effect of Fed rate hikes on gold supports the view that sustained hiking cycles consistently compress gold's medium-term performance.
The next major ASX story will hit our subscribers first
Four Scenarios for Gold Through December 2026
| Scenario | Key Trigger | December Hike Odds | Gold Direction | Estimated Range |
|---|---|---|---|---|
| Hawkish Crystallization | Inflation re-accelerates; Fed hikes | Rises above 90% | Bearish | Below $4,560 |
| Ceasefire Collapse | US-Iran talks fail; oil spikes | Falls as inflation risk rises | Bullish | $4,700-$5,000+ |
| Soft Landing | Inflation cools; labour moderates | Falls to 40-50% | Bullish | $4,800-$5,200 |
| Policy Pause Signal | Fed signals extended hold | Falls to 30-40% | Strongly Bullish | $5,200-$6,000 |
Portfolio Positioning When Rate Hike Odds Are Elevated
Elevated rate hike probability creates a selective environment rather than a universally bearish one. Capital does not leave the market; it rotates. The current configuration favours:
- Shorter-duration positioning to reduce sensitivity to rising rate expectations in fixed income.
- Dollar-linked and cash-generating assets, which benefit directly from the same interest rate environment that pressures gold.
- Selective commodity exposure in energy and industrials, where geopolitical risk premiums can provide support independent of monetary policy.
- A maintained base allocation to gold for tail-risk purposes, given the structural demand backdrop and the provisional nature of the ceasefire.
The difficulty of trading this environment precisely is that the two primary variables, December hike odds and US-Iran diplomatic progress, can shift within days. Portfolios should be stress-tested against both a December hike scenario and a scenario in which the ceasefire collapses and energy prices re-accelerate. Neither outcome is certain, and the market is currently assigning meaningful probability to both.
Frequently Asked Questions: Gold Price and Fed Rate Hike Odds
Does a Fed rate hike automatically push gold prices lower?
Not necessarily. If a hike is already fully priced into markets, gold may not decline further on the decision itself, and can occasionally rally on a relief dynamic once uncertainty resolves. The most significant price moves occur when the probability of a hike shifts rapidly, not when the Fed simply confirms what futures markets already expected. In this sense, the gold price and Fed rate hike odds relationship is more nuanced than many investors assume.
Why do central bank purchases not fully offset rate-driven selling pressure?
Central bank accumulation provides a structural demand floor, but it operates on a different timeframe and with different price sensitivity than Western institutional investors. A pension fund or ETF investor responding to real rate changes can reduce or exit a gold position within hours. Central banks accumulate gold as part of multi-year reserve diversification strategies and do not respond to short-term rate repricing in the same way. Their demand buffers rather than reverses rate-driven trends.
What would need to change for the J.P. Morgan $6,000/oz target to come into view?
The conditional requirement is a material reduction in December rate hike odds from the current 85% level, ideally driven by cooling inflation data or a softening labour market. A sustained move back toward 40-50% probability would signal that the monetary policy headwind is easing. This would likely trigger resumed ETF inflows from Western institutional investors and provide the fundamental momentum required for a move toward the upper end of analyst price targets.
Readers seeking additional institutional-grade analysis on macroeconomic forces affecting resource markets can access Crux Investor's Analyst's Notes series at cruxinvestor.com.
This article contains forward-looking statements and scenario analysis based on publicly available data as of mid-June 2026. It does not constitute financial advice. All price targets, probability estimates, and scenario projections carry inherent uncertainty and should not be relied upon as predictions of future market outcomes.
Want To Catch The Next Major ASX Mineral Discovery Before The Broader Market?
Discovery Alert's proprietary Discovery IQ model delivers real-time alerts on significant ASX mineral discoveries, instantly translating complex data across 30+ commodities into clear, actionable insights for both short-term traders and long-term investors — start your 14-day free trial today and gain a market-leading edge, or explore historic discoveries and their returns to understand just how transformative a well-timed discovery alert can be.