August 10, 2026
The Real Yield Chain: Why Gold Prices Are Driven by Mechanisms Most Investors Overlook
Most commentary about gold frames the metal as a simple fear barometer. Tensions rise, gold goes up. Inflation cools, gold retreats. This surface-level reading misses the actual engine driving price moves, and that misunderstanding consistently costs traders and investors money at precisely the moments that matter most.
The true architecture behind gold pricing is a transmission chain, not a single variable. Economic data feeds into Federal Reserve rate expectations. Those expectations shape the trajectory of real Treasury yields. Real yields determine the opportunity cost of holding a non-yielding asset like gold. At each link of that chain, there are amplifiers and dampeners that can invert the intuitive outcome entirely.
Understanding this mechanism is not just academic. It is the prerequisite for correctly reading what is currently one of the most consequential setups in the precious metals market: the gold price NFP CPI setup that emerged from July's jobs shock and now hangs on Wednesday's inflation print.
When big ASX news breaks, our subscribers know first
The Real Yield Framework and Why It Governs Gold
The relationship between real yields and gold is the most consistently reliable framework for interpreting short-to-medium-term price movements. Real yields are calculated by subtracting inflation expectations from nominal Treasury yields. When that figure rises, the cost of holding gold climbs in relative terms because investors can earn a positive, inflation-adjusted return from bonds instead. When real yields compress, that calculus reverses.
Furthermore, understanding gold-bond dynamics helps clarify why seemingly counterintuitive outcomes occur regularly:
- A weak NFP report can be powerfully bullish for gold, not because bad news is inherently positive, but because deteriorating employment reduces the Fed's justification for hiking rates, which compresses real yields
- High CPI data can paradoxically weaken gold in the short term by raising rate-hike expectations, lifting real yields, and strengthening the U.S. dollar simultaneously
- Geopolitical tension, when it feeds through to energy inflation, can actually cap gold's upside by keeping the Fed's hawkish options alive
The gold price NFP CPI setup is not about any single headline number. It is about how that number shifts the probability distribution of Federal Reserve decisions, and how that shift then flows through real yields and the dollar to alter gold's opportunity cost.
What July's Jobs Report Actually Revealed
The July Non-Farm Payrolls report delivered a genuine shock to consensus expectations. The U.S. economy shed 23,000 jobs, a reading well below any major pre-release forecast. Compounding the miss, prior-month figures were revised downward by a combined 103,000 positions, confirming that the deterioration was not a one-month aberration but a trend in motion.
The headline unemployment rate fell from 4.2% to 4.1%, which initially appeared constructive. However, a closer look at the underlying data revealed a very different picture.
| Metric | July Reading | Analytical Interpretation |
|---|---|---|
| Net job change | -23,000 | Genuine labor market contraction |
| Prior-month revisions | -103,000 combined | Trend deterioration confirmed |
| Unemployment rate | 4.1% (from 4.2%) | Superficially positive |
| Labor force change | -264,000 | Workers exited the workforce |
| Wage growth YoY | 3.2% | Weakest reading since May 2021 |
The unemployment rate improved not because more people found work, but because 264,000 individuals left the labor force entirely. A shrinking denominator produces a lower rate without any genuine improvement in employment conditions. Average hourly earnings grew by just two cents, slowing annual wage growth to 3.2%, the softest pace recorded since May 2021.
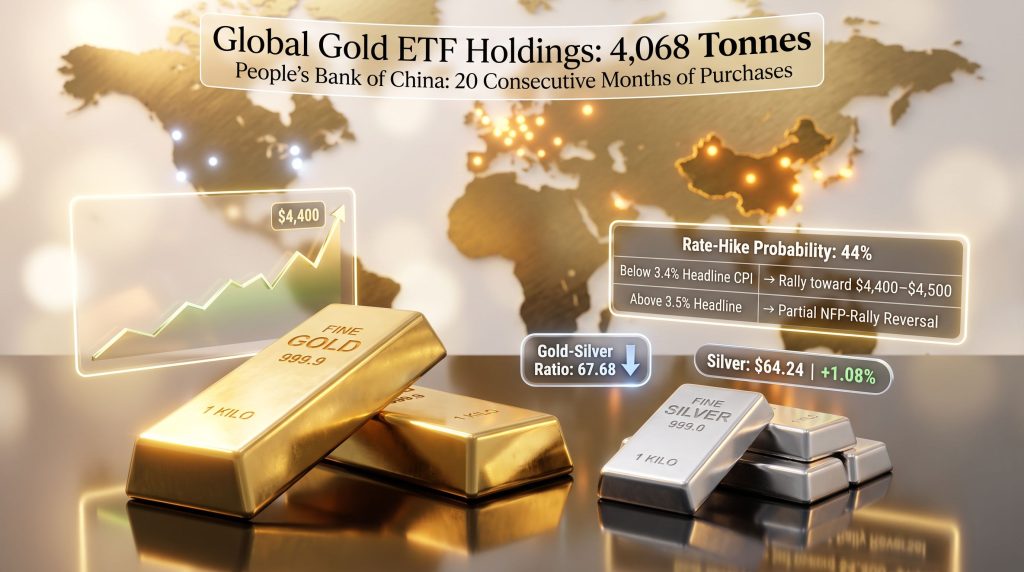
The Federal Reserve's rate-hiking calculus shifted immediately. Per CME FedWatch data, the probability of a September rate hike collapsed from approximately 67% to 44% in the hours following the release. Gold surged to a seven-week high of $4,400 per ounce before consolidating to around $4,318 as markets entered a holding pattern ahead of Wednesday's CPI release.
Five Structural Forces Now Acting on Gold Simultaneously
Force 1: The Fed Repricing Is Significant but Incomplete
A move from 67% to 44% rate-hike probability is a meaningful shift, but 44% represents a genuinely split market. At that level, neither dovish nor hawkish outcomes are priced with conviction, which means Wednesday's CPI data carries unusual binary weight.
- A softer CPI reading could push hike odds below 40%, extending the post-NFP rally toward the $4,400 to $4,500 range
- An above-consensus CPI print could snap odds back toward 60% or higher, partially reversing the gains built on the back of the jobs report
- At the current 44% probability, gold is essentially priced for maximum uncertainty, making the CPI release an unusually powerful directional catalyst
Force 2: The Hormuz Stalemate Is an Inflation Floor, Not Just a Geopolitical Risk
The Iran-gold relationship is consistently mischaracterised in mainstream analysis. The prevailing narrative treats geopolitical tension as automatically bullish for gold. In the current environment, however, the transmission mechanism runs in a more complicated direction.
Iran's Foreign Minister publicly denied any direct diplomatic engagement with the United States over the Strait of Hormuz, and Tehran's stated conditions for reopening the waterway — including full cessation of hostilities, financial compensation, and formal recognition of Iranian maritime authority — remain far from any negotiated resolution. Washington has maintained its position on unrestricted freedom of navigation.
Brent crude rose 1.4% to $84.70 as a direct consequence of the stalemate. The mechanism that matters for gold investors is the following chain:
Hormuz tension → elevated oil prices → sustained energy inflation → Fed hawkish optionality preserved → rate-hike expectations floor remains elevated → gold upside capped
Each escalation in the Strait keeps energy inflation anchored at levels that give the Federal Reserve reason to maintain hawkish optionality, even after a weak jobs report. The stalemate does not lift gold; it places a ceiling on how far gold can rally. The ongoing inflation hedge debate is consequently more nuanced than most mainstream commentary suggests.
Force 3: Silver Is Outperforming and the Ratio Compression Has Structural Roots
While gold consolidated on Monday, silver moved higher. The metal traded at $64.24, gaining 1.08%, while the gold-to-silver ratio compressed from 68.32 to 67.68 across two consecutive sessions.
Silver's outperformance in a falling-rate-expectations environment is not coincidental. It reflects a structural characteristic that most investors miss entirely. In-depth gold-silver ratio analysis reveals why this matters for positioning decisions.
Approximately 58% of silver demand is industrial in nature, compared with less than 10% for gold. When rate-hike expectations fall, markets are simultaneously pricing in a more accommodative environment for manufacturing, clean energy deployment, and capital expenditure. Silver benefits from both the monetary repricing that also lifts gold and a separate industrial demand uplift that gold does not share.
This dual sensitivity is compounded by a physical supply reality that operates completely independently of any rate cycle. According to the Silver Institute's World Silver Survey 2026, the physical silver market has recorded a supply deficit in each of the past six consecutive years, with above-ground stockpiles drawn down continuously since 2021. A less restrictive interest rate environment amplifies the investment case for silver at exactly the moment when the structural supply picture is already acute.
Force 4: Global ETF Demand Is Regionally Asymmetric and the U.S. Holds the Key
The World Gold Council's July 2026 ETF flows report, published August 6, provides a detailed picture of where gold demand is concentrated and, critically, where it is not. Notably, gold ETF demand has shown a pronounced regional divergence that deserves careful attention.
| Region | July Inflows | YTD Status |
|---|---|---|
| Europe total | +$2.0 billion | Net inflow |
| United Kingdom | +$875 million | Net inflow |
| Switzerland | +$657 million | Net inflow |
| Asia | +$616 million | Net inflow |
| North America | +$71 million | Net outflow YTD |
| Global total | +$3.0 billion | Reversal of 2-month outflow trend |
Total global gold ETF holdings reached 4,068 tonnes in July, up 23 tonnes from June but still 108 tonnes below the February 2026 record of 4,176 tonnes. Asian inflows were partly driven by Chinese investors seeking a refuge from equity market weakness, with the CSI 300 recording its worst monthly performance since January 2016.
North America represents the critical swing variable in this picture. U.S. investors sold aggressively when rate-hike expectations spiked earlier in the year and have not meaningfully returned. A soft CPI print on Wednesday could serve as the catalyst for a significant re-entry by this investor cohort, adding structural fuel to any rally that the current rate repricing has only partially ignited.
Force 5: Sovereign Accumulation Operates on a Multi-Year Timescale
The People's Bank of China has now executed 20 consecutive months of gold purchases, representing one of the most sustained sovereign accumulation programmes in recent history. This demand stream is policy-driven and strategically motivated. It does not pause because of a single CPI reading or a Fed meeting outcome.
Furthermore, central bank gold buying across Asia, the Middle East, and Eastern Europe has materially increased gold reserve allocations over the past three years, reflecting a broader strategic decision to diversify away from U.S. dollar-denominated reserve assets. This sovereign demand provides a structural floor under gold prices that functions independently of any short-term rate cycle, limiting downside even in a scenario where Wednesday's inflation data drives a hawkish repricing.
Reading Wednesday's CPI: A Scenario Framework
The July CPI release arrives Wednesday, August 12, at 8:30 a.m. ET. A Reuters poll forecasts headline inflation at 3.4% year-over-year, down from June's 3.5%, with core CPI expected at 2.5%, down from 2.6%.
| CPI Outcome | Rate-Hike Probability | Expected Gold Response | Silver Response |
|---|---|---|---|
| Below 3.4% headline / below 2.5% core | Falls below 44% | Rally toward $4,400–$4,500 | Outperforms gold; ratio compresses further |
| In-line with forecasts (3.4% / 2.5%) | Holds near 44% | Consolidation; modest drift | Neutral to slight outperformance |
| Above 3.5% headline / above 2.6% core | Rises toward 55–65% | Partial NFP-rally reversal | Underperforms; ratio expands |
Trading the Release: Discipline Over Instinct
High-impact data releases like CPI consistently reward disciplined process over reactive instinct. Experienced practitioners apply a structured approach rather than attempting to capitalise on the initial volatility spike.
Before the release:
- Identify the pre-release price range and mark the high and low as the news boundary
- Note the nearest significant support and resistance levels above and below the current price
- Confirm the current rate-hike probability via CME FedWatch as your baseline reference
- Reduce position sizing in the 30 minutes before release
- Define your stop-loss level before the number drops, not after
After the release:
- Avoid the first 5 to 10 minutes entirely; gold and silver frequently whipsaw violently before the genuine directional move asserts itself
- Wait for price acceptance beyond a key structural level, defined as a close outside the pre-release range rather than a brief spike through it
- Look for a retest or break-of-structure confirmation before committing capital
- Target risk-to-reward ratios of 1:2 or 1:3; attempting to capture the entire post-CPI move from a single entry is rarely realistic
A critical and widely underappreciated point: the first directional move after a major data release is frequently a false signal. Algorithmic systems trigger large orders at the release moment, creating sharp moves that are then partially or fully reversed within minutes as human participants reassess the data. Waiting for genuine price acceptance dramatically improves entry quality.
Consequently, structured news-trading approaches have gained considerable traction among practitioners who prioritise consistency over short-term excitement.
The next major ASX story will hit our subscribers first
The Structural Case Extends Well Beyond Any Single Print
The gold price NFP CPI setup is a short-term catalyst window sitting inside a much larger structural framework. Conflating the two is a common and costly error.
Three separate timescales operate simultaneously in precious metals markets:
- Short-term (days to weeks): Dominated by rate-expectation repricing driven by data releases like NFP and CPI
- Medium-term (months): Shaped by ETF flow trends, dollar trajectory, and the direction of real yields over a broader cycle
- Long-term (years): Driven by sovereign accumulation programmes, structural supply deficits (particularly pronounced in silver), and the gradual erosion of confidence in fiat monetary systems globally
Wednesday's CPI print will move positioning on the first of these timescales. It will not alter the structural arguments operating on the second and third. The six-year physical silver supply deficit, the persistence of European and Asian ETF demand, and the People's Bank of China's two-year accumulation streak are not variables that one inflation reading can reset.
For investors, the distinction between tactical noise and strategic signal is not just conceptually useful. It determines whether a single data release is read as a repositioning opportunity within a larger thesis, or mistakenly treated as a verdict on that thesis itself.
Frequently Asked Questions: The Gold Price NFP CPI Setup
What exactly is the gold price NFP CPI setup?
It refers to the analytical window between a major U.S. jobs report and the subsequent Consumer Price Index release, during which gold prices are in a state of active repositioning. The NFP data shifts Federal Reserve rate expectations, gold reprices accordingly, and the following CPI report either confirms or reverses that repricing. The relationship between these two data points creates a defined period of directional probability that traders and investors use to assess positioning.
Why does a weak jobs report sometimes push gold sharply higher?
A weaker-than-expected NFP outcome signals labour market deterioration, which reduces the Federal Reserve's justification for raising interest rates. Lower rate-hike expectations compress real Treasury yields and soften the U.S. dollar, both of which reduce the opportunity cost of holding non-yielding gold. The mechanism runs through the rate cycle, not through sentiment directly.
Why can high inflation data actually push gold prices lower in the short term?
Elevated CPI increases the probability that the Federal Reserve will raise interest rates to contain inflation. Higher rate expectations lift real yields and strengthen the dollar, both of which raise the opportunity cost of holding gold. This is why strong inflation data, despite being superficially consistent with gold as an inflation hedge, can produce the opposite short-term price reaction.
What does the gold-to-silver ratio reveal about current market conditions?
The ratio measures how many ounces of silver are required to buy one ounce of gold. Compression in the ratio, where silver outperforms gold, typically occurs when rate-hike expectations fall. Silver's large industrial demand base, approximately 58% of total consumption, means it benefits simultaneously from the monetary repricing and from the improved outlook for manufacturing and clean energy activity that a less restrictive rate environment implies.
Does central bank gold buying affect short-term price movements?
Sovereign accumulation programmes like the People's Bank of China's 20-month consecutive purchase streak operate on a policy-driven timescale that is largely insensitive to individual data releases. This demand creates a structural floor under gold prices rather than contributing to short-term volatility. Its significance is most relevant to medium and long-term price analysis rather than to the immediate post-CPI reaction.
Disclaimer: This article is intended for informational and educational purposes only and does not constitute financial or investment advice. Precious metals investing involves significant risk, including the potential loss of principal. Past performance is not indicative of future results. Always consult a qualified financial adviser before making any investment decisions.
Want to Catch the Next Major Mineral Discovery Before the Market Does?
While macroeconomic forces like real yields and CPI data drive gold prices, the most asymmetric returns in precious metals often come from significant new mineral discoveries — and Discovery Alert's proprietary Discovery IQ model delivers real-time ASX alerts the moment they are announced, turning complex data across 30-plus commodities into clear, actionable insights. Start your 14-day free trial today, or explore Discovery Alert's discoveries page to see the historic returns that major mineral discoveries have generated for investors who moved early.