July 21, 2026
The Structural Question Redefining How Investors Think About Gold
For most of the past two decades, experienced commodity investors operated within a relatively predictable gold market framework: identify the macro trigger, ride the rally, then brace for the inevitable mean reversion. That playbook rewarded patience and punished overconfidence at cycle peaks. However, the extraordinary events unfolding between late 2022 and early 2026 have forced a genuinely uncomfortable question onto the table — not whether gold will correct, but whether the forces now governing its price floor have changed so fundamentally that historical correction templates may no longer apply cleanly.
Understanding the gold price outlook and new drivers shaping this market requires moving beyond surface-level price comparisons and examining the structural architecture beneath the rally itself.
When big ASX news breaks, our subscribers know first
The Historical Correction Playbook: A Pattern Built Over Two Decades
Two decades of gold price history reveal a strikingly consistent rhythm. Large percentage advances tend to be followed by meaningful retracements, and critically, the depth of those retracements has broadly correlated with the magnitude of the preceding rally.
The 2008 to 2011 advance serves as the most instructive historical precedent. Gold climbed from $697.45 per ounce in October 2008 to a then-record $1,884.40 in September 2011, a gain of approximately 170%. What followed was a correction of 37% that extended over nearly seven years before the next sustained advance began. The subsequent rally from the August 2018 low delivered a 74% gain to $2,072.49 by August 2020, which was then unwound by a 22% pullback taking prices back to $1,620.20 by September 2022.
Three observations emerge from this pattern that matter enormously for interpreting today's market:
- Rallies have historically unfolded over compressed timeframes, while corrections tend to play out across much longer periods
- The magnitude of each correction has broadly scaled with the size of the preceding advance
- Recovery phases following corrections have consistently reset at meaningfully higher structural floors
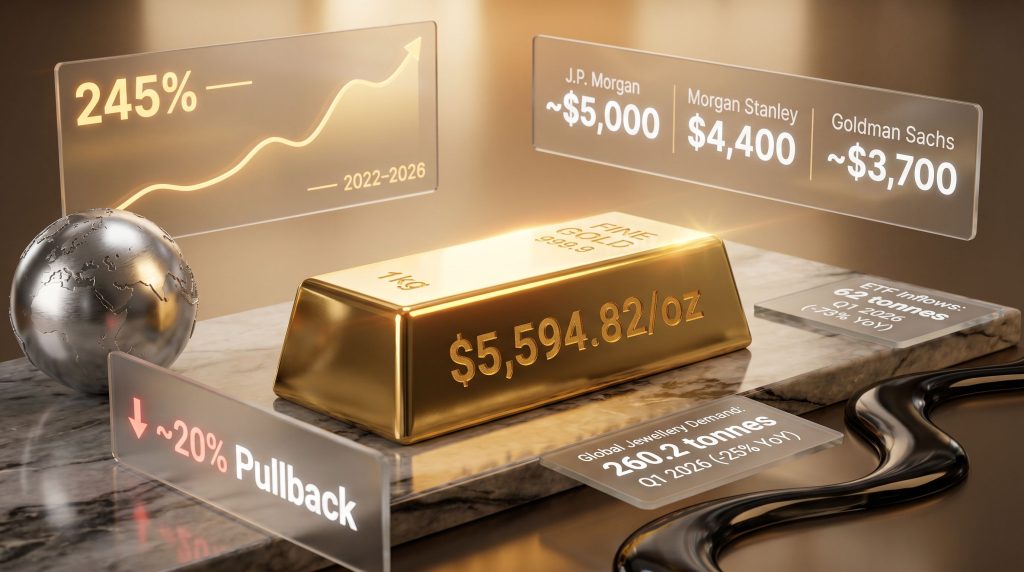
The 2022 to 2026 advance, which delivered approximately 245% gains and drove gold to an all-time high of $5,594.82 per ounce on January 29, 2026, represents the largest percentage advance in the modern gold era. By the standards of prior cycles, this scale of gain implies the risk of a correction exceeding anything previously observed. The subsequent pullback of approximately 20% to roughly $4,473 per ounce by early June 2026, while meaningful, remains well below what historical templates would predict if prior dynamics remain fully intact.
Why the 20% Pullback May Be Deceivingly Calm
Spot gold declined as much as 3% in a single session to $4,330 per ounce, its lowest level since March 2026, as expectations of interest rate hikes surged. For context, this price action occurred even as total gold demand contracted by 9% year-on-year in Q1 2026 to 1,195.9 tonnes, compared to 1,315.6 tonnes in the same quarter of 2025.
The fact that prices have not collapsed more aggressively despite deteriorating demand across multiple traditional categories is itself analytically significant. Either the correction is still in its early stages, or something structural has shifted in how gold's equilibrium price is being determined. Furthermore, gold and bond dynamics during this period suggest that conventional inverse relationships are behaving less predictably than in prior cycles.
What Actually Drove Gold to Record Highs: A Demand Decomposition
The 2022 to 2026 rally was architecturally unusual because it was not built on a single dominant driver. Instead, multiple independent demand forces aligned simultaneously, creating a compounding effect that amplified price momentum beyond what any individual factor could have achieved in isolation.
The Three Pillars That Converged
According to Reuters commodities columnist Clyde Russell, writing in June 2026, the current rally was distinguished from prior cycles by the simultaneous reinforcement of three primary demand pillars: central bank gold demand at historically elevated rates, strong retail demand from China and India operating in tandem, and broad investor appetite linked to what Russell characterises as the fear trade encompassing inflation anxiety, geopolitical instability, and concerns about U.S. dollar hegemony under the Trump administration's policy approach. (Reuters / Mining.com, June 5, 2026)
The table below summarises how each pillar has evolved from peak contribution to current status:
| Demand Pillar | Peak Contribution Period | Q1 2026 Status |
|---|---|---|
| Central bank purchases | 300+ tonnes/quarter (mid-2022 to end-2024) | 243.7 tonnes, +3% YoY |
| China jewellery demand | Dominant consumer driver 2022-2024 | 85.2 tonnes, down 31% YoY |
| India jewellery demand | Co-anchor of physical demand | 66.1 tonnes, down 19% YoY |
| ETF investment inflows | Strong amplifier through 2025 | 62 tonnes, down 73% YoY |
| Total demand | 1,315.6 tonnes (Q1 2025) | 1,195.9 tonnes, down 9% YoY |
Central Bank Buying: A Structural Shift, Not a Cyclical Spike
Perhaps the most consequential development shaping the long-term gold price outlook is the transformation of central bank behaviour from occasional tactical buyers to systematic strategic accumulators.
Central banks purchased 243.7 metric tonnes in Q1 2026, representing a 3% year-on-year increase. However, this headline figure masks a more nuanced picture. Quarterly purchases have settled into a range broadly around 200 tonnes per quarter since early 2025, a meaningful step down from the extraordinary pace of more than 300 tonnes per quarter sustained across five consecutive quarters between mid-2022 and the end of 2024.
Poland and China were among the leading buyers in the most recent reporting period. The sustained nature of this accumulation, even at moderated rates, reflects a deliberate policy decision rather than opportunistic buying. Multiple major institutional analysts, including those at Morgan Stanley, have noted that gold has surpassed U.S. Treasuries as a share of central bank reserves for the first time since 1996, a development that carries profound long-term implications for gold's price floor.
Central bank reserve diversification represents a policy-level structural shift that operates independently of retail sentiment, ETF flows, or short-term macro conditions. Unlike cyclical demand, it does not reverse when prices rise.
Consumer Demand Erosion: Price Sensitivity Strikes Back
The other side of the demand equation tells a more sobering story. Global jewellery demand fell 25% to 260.2 tonnes in Q1 2026, according to World Gold Council data. Within this aggregate decline, the deterioration in the world's two largest consumer markets is particularly pronounced:
- China: Jewellery demand fell to 85.2 tonnes, down 31% year-on-year
- India: Jewellery demand slipped to 66.1 tonnes, down 19% year-on-year
India's government took the additional step of increasing taxes on gold imports to reduce purchases and ease balance-of-payments pressures, illustrating how extreme price levels can trigger policy responses that mechanically suppress demand. This is a dynamic less visible in prior cycles, when price levels were insufficient to provoke such fiscal interventions in major consumer economies.
The New Drivers Reshaping the Gold Price Outlook
Understanding the gold price outlook and new drivers in 2026 requires moving beyond the traditional demand accounting framework. Several forces now operating in the gold market have no meaningful precedent in prior cycles. According to JP Morgan's commodity research, the combination of structural central bank buying and persistent geopolitical risk premia represents a genuinely new configuration of demand forces.
De-Dollarization and the Reserve Diversification Mega-Trend
The erosion of unconditional confidence in the U.S. dollar as the dominant global reserve asset has become one of the most consequential structural forces in commodity markets. Institutions including VanEck and J.P. Morgan have identified de-dollarization, trade sanctions volatility, and systematic emerging-market central bank buying as long-duration structural supports for gold that operate on timescales of years to decades rather than quarters.
In addition, the global monetary shift driven in part by China's reserve reallocation strategy has reinforced this trend in ways that extend well beyond conventional commodity cycle dynamics.
Unlike retail jewellery demand or ETF flows, which respond rapidly to price signals, central bank reserve allocation decisions are driven by geopolitical strategy and monetary policy mandates. They are slow-moving, deliberate, and relatively insensitive to short-term price fluctuations. This characteristic makes central bank demand the most durable component of the new gold demand architecture.
Monetary Policy as Gold's Short-Term Puppet Master
A notable feature of the current gold market is how extensively the metal has been repriced as a monetary policy derivative. The inverse relationship between crude oil prices and gold, observed consistently through mid-2026, illustrates this dynamic with unusual clarity.
As Reuters' Russell explains, when crude oil prices rise amid the ongoing U.S.-Iran conflict, gold weakens, because higher energy prices reinforce inflation expectations and raise the probability of interest rate hikes. Conversely, when oil prices fall on signals of potential diplomatic progress, gold recovers, as disinflation expectations revive hopes for rate cuts. (Reuters / Mining.com, June 5, 2026)
This feedback loop creates a market structure where gold's short-term direction is as much a function of energy geopolitics as of traditional precious metals fundamentals. The practical implication for investors is that monitoring oil market developments has become a necessary input into gold price forecasting, a relationship that did not exist with this level of immediacy in prior cycles.
The Geopolitical Fear Premium: Persistent but Hard to Quantify
Beyond the mechanistic oil-rates-gold linkage, a broader fear premium appears embedded in current gold prices. This premium reflects overlapping anxieties including inflation risk, geopolitical escalation, and institutional concerns about U.S. economic policy credibility. Furthermore, gold's safe-haven appeal has been meaningfully amplified by structural concerns about the long-term viability of dollar-denominated reserve assets following the weaponisation of financial sanctions.
This fear premium represents a genuinely new component of gold's valuation architecture, one that was not present in the same form or scale during the 2008 to 2011 or 2018 to 2020 cycles.
Institutional Gold Price Forecasts for 2026: A Wide Dispersion
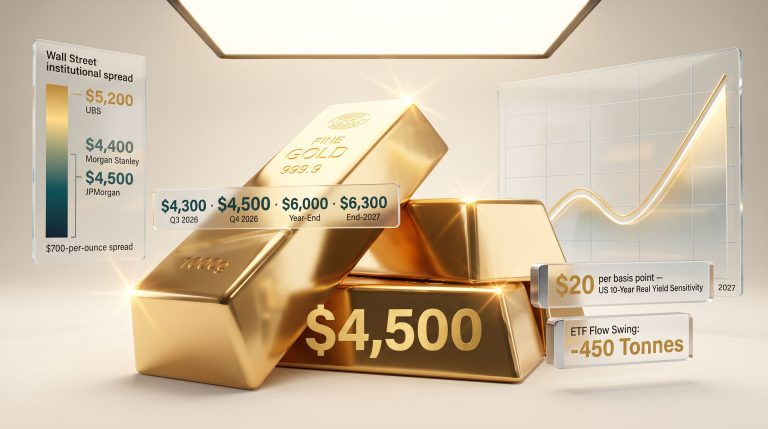
The range of institutional price targets for gold in 2026 is itself informative, as it reflects genuine analytical uncertainty about which demand forces will prove dominant. For instance, Goldman Sachs' gold outlook highlights a notably wide set of scenarios depending on how central bank demand and investor flows evolve through year-end.
| Institution | 2026 Gold Price Forecast | Primary Thesis |
|---|---|---|
| J.P. Morgan | ~$5,000/oz by Q4 2026; avg ~$5,055/oz | Continued reserve diversification and investor flows |
| Morgan Stanley | $4,400/oz | Central bank buying, weaker dollar, ETF demand |
| Goldman Sachs | ~$3,700/oz base; $3,880/oz recession case | Structural CB demand and renewed investor appetite |
| World Gold Council | 5-15% upside in soft-growth scenario | Rate-sensitive; macro-dependent base case |
| CoinCodex | ~$3,465/oz by end-2026 | Conservative; assumes demand normalisation |
The more than $1,500 per ounce spread between the most bullish and most conservative institutional forecasts reflects a genuine analytical fork in the road. J.P. Morgan's case rests on the durability of structural central bank demand and continued investor re-engagement. The more cautious projections assume that cyclical headwinds from high real yields and demand erosion will reassert the historical correction pattern.
Scenario Analysis: What Pushes Gold Higher or Lower
| Macro Scenario | Expected Gold Impact | Primary Mechanism |
|---|---|---|
| Slower growth and rate cuts | Strongly positive | Lower opportunity cost; weaker USD |
| Recession and risk aversion spike | Very strongly positive | Safe-haven surge; ETF inflows accelerate |
| Strong growth, firmer dollar, rate hikes | Negative | Higher real yields reduce appeal |
| Persistent de-dollarization and CB buying | Positive structural floor | Long-duration demand insulation |
| Oil price spike from Iran escalation | Ambiguous, negative short-term | Rate hike fears offset safe-haven demand |
Structural Transformation or Dangerous Complacency?
Financial market history is replete with examples of analysts convincing themselves that a structural regime change has eliminated the risk of historical mean reversion, only to be proven wrong. The "this time is different" framing carries genuine intellectual risk, and dismissing it out of hand would be equally irresponsible as accepting it uncritically.
The Case for Historical Pattern Dominance
The mathematical logic of prior gold cycles is straightforward and sobering for bulls. The 245% rally from September 2022 to January 2026 is the largest percentage advance in modern gold market history. If historical correlation between rally magnitude and correction depth holds, the ~20% pullback observed through early June 2026 would represent only a fraction of the eventual retracement. The extended duration of prior corrections, which have tended to unfold across multi-year timeframes, further suggests that investors expecting a rapid resumption of the bull trend may be premature.
The Case for a Permanently Higher Floor
The counter-argument rests on three structural observations that have no meaningful parallel in prior cycles:
- Central bank reserve diversification is operating at a policy level, driven by geopolitical strategy rather than market opportunism, making it structurally distinct from retail or institutional investor demand
- Gold's share of global central bank reserves has surpassed U.S. Treasuries for the first time since 1996, a threshold that, once crossed, tends to reinforce further allocation through sovereign wealth frameworks
- The geopolitical architecture underpinning demand including de-dollarization pressures, sanctions-related reserve concerns, and U.S. policy unpredictability has not materially resolved and shows no near-term sign of doing so
The analytical tension here is genuine and unresolved. Dismissing structural demand shifts as temporary risks misrepresenting how gold's role in the global financial system has evolved. Accepting them uncritically risks the same category error that has trapped investors at prior cycle peaks.
Consequently, a nuanced gold price forecast must account for both the durability of these structural supports and the very real possibility that cyclical forces eventually reassert the historical mean-reversion pattern.
The next major ASX story will hit our subscribers first
Key Takeaways: Navigating the Gold Market in 2026
- Gold's post-January 2026 consolidation is occurring against a backdrop of contracting demand across most traditional categories, yet price resilience remains relatively strong
- The most durable new driver in the gold price outlook and new drivers framework is central bank reserve diversification, which institutional analysts increasingly classify as structural rather than cyclical
- Short-term price direction is heavily hostage to U.S. monetary policy expectations and the oil market dynamics generated by the U.S.-Iran conflict
- The $1,500+ per ounce spread in 2026 institutional price targets reflects genuine uncertainty about which forces will dominate through year-end
- For investors, the central risk is not simply macro headwinds but the possibility that the structural demand narrative proves less durable than currently assumed, or alternatively, that historical correction templates underestimate the permanence of the new demand floor
- Monitoring central bank reserve data, oil price trajectories, and real interest rate expectations simultaneously has become necessary for forming a coherent view on gold
This article is intended for informational purposes only and does not constitute financial advice. Gold price forecasts cited from institutional sources involve forward-looking assumptions that may not materialise. Readers should conduct their own due diligence before making investment decisions. All demand data referenced from World Gold Council quarterly reports.
Want to Stay Ahead of the Next Major Mineral Discovery on the ASX?
While structural forces continue reshaping commodity markets like gold, Discovery Alert's proprietary Discovery IQ model cuts through the complexity by delivering real-time alerts on significant ASX mineral discoveries — instantly translating technical announcements across 30+ commodities into clear, actionable insights for both short-term traders and long-term investors. Explore how historic discoveries have generated substantial returns on Discovery Alert's dedicated discoveries page, and begin your 14-day free trial today to position yourself ahead of the broader market.