June 13, 2026
When Bull Markets Breathe: Understanding Gold's Structural Correction
Commodity markets have never moved in straight lines. From crude oil in the 1970s to copper in the early 2000s, every major bull market in history has been interrupted by corrections severe enough to shake out the most speculative participants before resuming its underlying trajectory. Gold in 2026 is no exception, and understanding why that correction is happening is far more valuable than reacting to the fact that it is.
The gold price pullback and central bank selling to buy oil represent the two most consequential forces reshaping the precious metals landscape right now. Neither is arbitrary, and neither signals the end of the longer-term cycle. What they do signal is a complex, interconnected mechanism that most retail investors have never fully mapped out.
When big ASX news breaks, our subscribers know first
The Fractal Mathematics Hiding Inside Every Major Commodity Correction
Why 50% Retracements Are a Feature, Not a Bug
Veteran commodities investors have long observed a pattern that repeats across different assets, different magnitudes, and different decades: major bull markets routinely surrender approximately half their gains before the next leg higher begins. This is not folklore. It has a mathematical foundation rooted in what Benoit Mandelbrot described as fractal geometry and scale invariance, the tendency for the same structural patterns to repeat at different scales within complex dynamic systems.
Scale invariance in financial markets means that the proportional behaviour of market participants tends to remain consistent even as the absolute numbers change. A trader navigating the gold market in 2026 is subject to the same psychological pressures, the same stop-loss cascades, and the same capitulation dynamics as a trader navigating the oil market in 1986. The numbers differ enormously; the pattern does not.
Oil provides one of the clearest historical examples. During the 1980s, crude prices fell from approximately $20 per barrel to a low of roughly $6 per barrel, a decline well exceeding 50% from the cycle peak, before eventually recovering and resuming its long-term upward path. The market at the time generated narratives about permanent oversupply and structural demand destruction. Those narratives proved incorrect.
Applying the Framework to Gold's Current Cycle
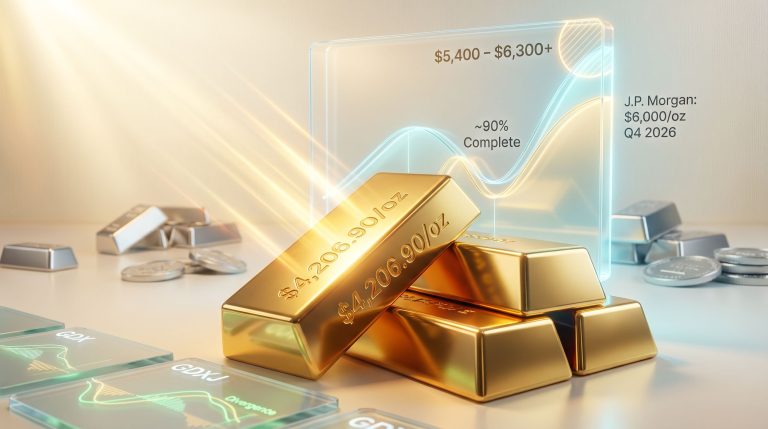
Using a conservative rally base of approximately $1,800 per ounce and a cycle high near $5,500 per ounce, the total gain in gold's most recent major advance was roughly $3,700 per ounce. A 50% retracement of that gain points to a potential floor somewhere in the $3,600 to $4,000 per ounce range. Furthermore, the gold price forecast for this period aligns closely with these mathematical retracement targets.
The previous gold bull market offers a striking precedent. Using $250 per ounce as the base (the 1999 cyclical low, often referred to as Brown's Bottom after the UK Chancellor who sold a significant portion of Britain's gold reserves near the trough) and $1,900 per ounce as the 2011 peak, a 50% retracement of the approximately $1,650 gain would have implied a floor near $1,075. The actual cycle low arrived at roughly $1,050 per ounce in December 2015, matching the mathematical model with remarkable precision.
Historical precedent strongly suggests that once a 50% retracement completes, the subsequent advance tends to be significantly more powerful than the preceding leg. The retracement is, in effect, the launch pad for the next phase of the bull market rather than evidence that the cycle has ended.
| Cycle | Base Price | Cycle Peak | 50% Retracement Level | Actual Bottom |
|---|---|---|---|---|
| 1999 to 2011 Gold Bull Market | ~$250/oz | ~$1,900/oz | ~$1,075/oz | ~$1,050/oz (Dec 2015) |
| 2020 to 2026 Gold Bull Market | ~$1,800/oz | ~$5,500/oz | ~$3,650/oz | TBD |
| 1970s to 1980s Oil Cycle | ~$4/barrel | ~$20/barrel | ~$8/barrel | ~$6/barrel (1986) |
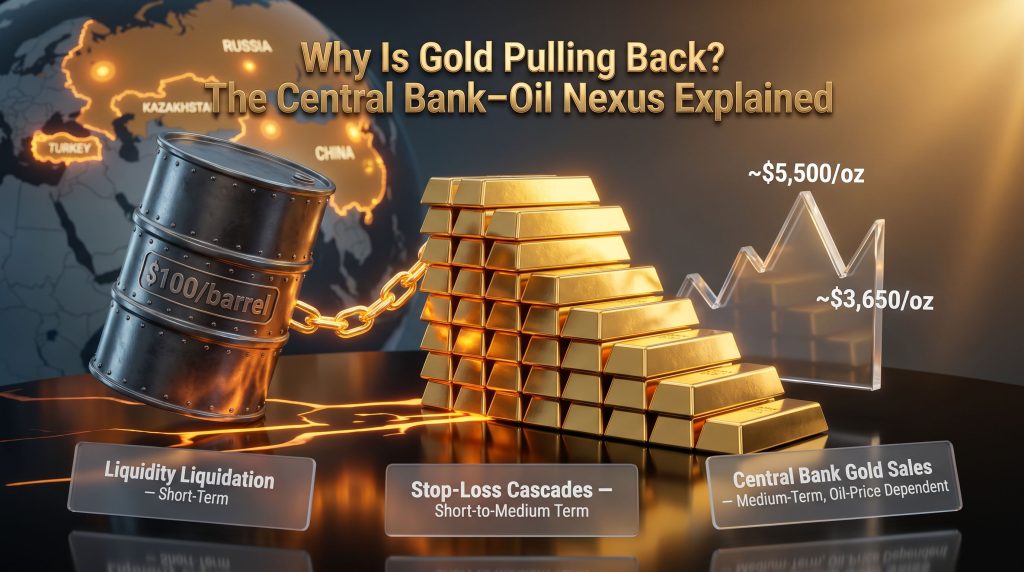
Three Forces Driving the Gold Price Pullback in 2026
Force 1: Liquidity Liquidation
When portfolios come under stress, gold is frequently the first asset sold rather than the last. This sounds counterintuitive given gold's reputation as a safe haven, but it reflects a fundamental reality: gold is one of the most liquid stores of value on the planet. When margin calls arrive and cash must be raised quickly, the asset most easily converted to cash without significant market impact becomes the natural source of funds.
This dynamic does not reflect declining long-term demand for gold. It reflects gold's role as a financial shock absorber, the asset investors reach for precisely because it can be liquidated efficiently. The short-term selling pressure this creates is a feature of gold's liquidity premium, not a structural signal. In addition, the gold and bonds dynamics during these stress periods reinforce why gold often moves counter-intuitively in the short term.
Force 2: Leveraged Trader Capitulation and Stop-Loss Cascades
Hedge funds and proprietary trading desks operating with leverage face mandatory exit thresholds when prices fall below predetermined levels. Each stop-loss trigger generates additional selling, which pushes prices lower, which activates the next tier of stop-losses below it. The mechanics are self-reinforcing.
This process is then amplified by Commodity Trading Advisors, the systematic trend-following funds that do not anticipate market direction but pile into established trends once confirmed. CTAs may have had no prior exposure to gold but will aggressively sell once a downtrend is identified, adding mechanical momentum to what began as fundamental liquidation.
The result is a selling cascade that can drive prices well below levels justified by underlying supply and demand fundamentals, creating the conditions for what experienced commodities investors describe as a weak-hand flush, where participants who bought near cycle highs are forced or frightened out of their positions before longer-term buyers step in.
Force 3: Central Bank Selling to Fund Oil Imports
This is the most structurally significant driver of the 2026 gold price pullback and central bank selling to buy oil has emerged as the dominant narrative among institutional analysts. According to recent analysis of central bank gold demand, this shift in official-sector behaviour is creating a notable valuation gap in gold equities.
The mechanics are straightforward:
- Crude oil prices have risen from approximately $60 per barrel to around $100 per barrel
- Oil is priced in US dollars under the petrodollar framework, meaning all importing nations must acquire dollars to fund purchases regardless of their domestic currency preferences
- Economists classify energy demand as inelastic, meaning nations cannot meaningfully reduce oil consumption without triggering economic contraction
- The resulting funding gap must be covered by liquidating reserve assets, and gold is the most universally accepted non-dollar reserve asset available
Turkey has been among the most prominent sellers in 2026, with analysts at firms including Natixis and BullionVault linking official-sector gold sales to currency defence pressures and elevated energy import costs. Russia has also reported gold sales consistent with the need to generate hard currency under conditions of continued sanctions pressure and elevated military expenditure.
| Driver | Mechanism | Expected Duration |
|---|---|---|
| Liquidity liquidation | Investors sell gold to raise cash | Short-term |
| Stop-loss cascades | Leveraged traders exit, CTAs amplify trend | Short to medium term |
| Central bank gold sales | Nations sell reserves to fund oil imports | Medium-term, oil-price dependent |
| Weak-hand capitulation | Retail buyers near cycle highs exit at a loss | Short-term |
The Petrodollar System: How Oil Prices Directly Suppress Gold
Dollar Demand as a Structural Gold Headwind
The petrodollar framework, under which global oil transactions are predominantly settled in US dollars, creates a structural demand for dollar liquidity that intensifies whenever oil prices rise. Nations without sufficient dollar reserves must generate them through asset sales, and gold is the most accessible and universally accepted reserve asset for this purpose.
This dynamic simultaneously strengthens the US dollar, since dollar demand rises with oil prices, and gold typically moves inversely to dollar strength. The result is a double headwind: central banks sell gold to generate dollars, and the resulting dollar strength further suppresses gold's dollar-denominated price.
When gold falls 20% in dollar terms, the reciprocal implication is that the dollar has appreciated by roughly 25% in gold terms. A declining gold price and a strengthening dollar are two sides of the same coin under the petrodollar framework.
When Does the Mechanism Reverse?
The gold recovery timeline is most directly linked to the trajectory of oil prices. Two distinct scenarios could initiate that reversal:
Scenario A: Geopolitical Resolution
- Conflicts disrupting key oil supply routes are resolved and shipping lanes reopen
- Oil prices decline as supply normalises
- Central bank pressure to liquidate gold reserves eases
- Dollar demand for oil purchases moderates, reducing the structural headwind for gold
Scenario B: Demand Destruction Through Economic Slowdown
- Persistently high energy prices suppress consumer spending and reduce industrial activity
- Reduced economic activity lowers oil consumption organically
- Oil prices fall through demand destruction rather than supply normalisation
- Central banks may pivot toward monetary easing, which is historically supportive for gold
Important caveat: Scenario B carries significantly more severe consequences for employment and consumer welfare than Scenario A. While gold may recover under either pathway, the broader economic damage associated with a demand-destruction-driven oil price decline is substantially greater. Investors should not treat a gold recovery under this scenario as an unambiguously positive outcome.
Central Banks: From Net Buyers to Selective Sellers
A Structural Shift in Official-Sector Demand
Understanding the current selling requires context about what preceded it. From 1970 to 2010, central banks globally were consistent net sellers of gold. Beginning in 2010, the official sector reversed course entirely, led by China and Russia. Indeed, central bank gold demand has been one of the defining structural forces of the modern gold cycle.
- In 2009, both China and Russia held approximately 600 metric tonnes of gold each
- Russia expanded its reserves to roughly 2,500 metric tonnes by the mid-2020s, a fourfold increase
- China's officially acknowledged reserves grew to over 3,000 metric tonnes, a fivefold increase, though credible analysis suggests actual holdings could be substantially higher, potentially reaching 6,000 to 7,000 metric tonnes
- Additional consistent buyers included Kazakhstan, Turkey, Japan, Mexico, and Vietnam
This sustained official-sector buying was one of the primary structural forces driving gold higher alongside flat mining supply. When the same central banks shift from buyers to sellers, even selectively, the supporting price dynamic weakens materially.
Supply Fundamentals Remain Intact
Global gold mining output has remained broadly flat, with exploration becoming progressively more capital-intensive and ore grades declining at many established operations. The ore density, meaning the concentration of gold within the ore body being processed, has fallen at numerous major mining operations, making each tonne of rock processed less productive than it was a decade ago.
This supply constraint has not reversed. The structural factors that supported the bull market on the supply side remain in place, even as the demand-side dynamic from central bank buying has moderated temporarily.
The Federal Reserve's Impossible Dilemma
Inflation Above 4% Eliminates Easy Policy Choices
Consumer price inflation running above 4% year-over-year, the highest reading in approximately three years, effectively removes rate cuts from the Federal Reserve's near-term toolkit. The traditional Phillips Curve framework, which posits an inverse relationship between unemployment and inflation, has demonstrated limited predictive reliability in the current environment and should not be relied upon as a guide to Fed behaviour.
Employment data complicates the picture further. A review of the past 24 months of employment reports reveals that approximately 22 out of 24 monthly readings were subsequently revised downward, in some cases dramatically, from initial headline figures. The headline employer survey relies on econometric modelling rather than direct counting, and those models may not accurately reflect an economic environment undergoing structural change.
Three Possible Fed Outcomes and Their Gold Implications
- Rate hike: Would increase the opportunity cost of holding non-yielding gold in the short term, creating additional price pressure, but risks accelerating economic deceleration that could ultimately force a policy reversal supportive of gold
- Extended pause: Maintains optionality but may be perceived as insufficiently hawkish given elevated inflation data; neutral to mildly negative for gold in the near term
- Rate cut: Effectively off the table given the current inflation trajectory; would be strongly positive for gold but is not currently a realistic scenario
The Federal Reserve has historically operated reactively rather than proactively, often arriving late to both tightening and easing cycles. This pattern of delayed response means policy errors in either direction remain a meaningful tail risk for markets.
The next major ASX story will hit our subscribers first
Does the Same Logic Apply to Silver?
Silver's Dual Identity Complicates the Analysis
Silver participates in precious metals rallies alongside gold but typically with a lag, gold tends to lead the advance before silver accelerates into its own move. However, silver's dual nature as both a monetary asset and an industrial input means its price dynamics are considerably more complex than gold's.
Silver's industrial applications include electronics manufacturing, satellite components, catalytic converters, and a growing range of clean energy technologies. This dual demand profile means silver's price trajectory is influenced by both the monetary cycle and the industrial business cycle simultaneously. Furthermore, the gold-silver ratio analysis for this period provides additional context for understanding relative value between the two metals.
| Characteristic | Gold | Silver |
|---|---|---|
| Primary demand driver | Monetary and reserve asset | Monetary plus industrial |
| Recession sensitivity | Lower | Higher (industrial demand falls) |
| Typical rally timing relative to each other | Leads | Lags gold |
| Analyst long-term price target range cited | $6,000 to $10,000/oz | $100+/oz |
A recessionary environment creates a meaningful headwind for silver that does not apply to gold in the same way. However, over the full commodity cycle, silver is expected to participate substantially in the broader precious metals advance, with long-term price targets above $100 per ounce cited by various analysts.
What Investors Should Consider During This Correction
Strong Hands Versus Weak Hands: A Framework for Staying Rational
Every major commodity correction involves a transfer of assets from participants who bought near the highs and exit during weakness (weak hands) to participants who maintain or increase their positions during price declines (strong hands). Central banks, institutional investors, and sovereign wealth funds have historically been strong-hand participants in the gold market, maintaining positions through corrections that force retail participants out.
The current correction is consistent with a weak-hand flush, a process that has historically preceded renewed accumulation by longer-term buyers. Smart money continues buying even as retail participants exit, reinforcing the structural case that this remains a cyclical correction rather than a trend reversal. Investors who acquired gold at materially lower price levels remain in a profitable position despite the drawdown.
Investors who have not yet established a position, or who wish to increase their allocation, may find current price levels represent a more favourable entry point relative to the cycle peak. This is not a recommendation to buy or sell any asset. All investment decisions carry risk, and past commodity cycle patterns do not guarantee future outcomes.
The Recovery Will Likely Be Measured in Months, Not Years
The mechanism driving the current gold price pullback, specifically central bank selling to fund oil imports at elevated prices, is inherently self-limiting. The closure of major shipping lanes and sustained supply disruptions of the scale currently affecting global energy markets cannot persist indefinitely. When the oil price headwind eases, through either geopolitical resolution or demand destruction, the structural rationale for central bank gold sales diminishes correspondingly.
Based on the historical fractal patterns described above, once a major 50% retracement completes, the subsequent rally phase has tended to be significantly more powerful than the preceding advance. The mathematical framework suggests the current correction, while significant, remains within the parameters of a normal bull market retracement rather than a structural trend reversal.
This article is intended for informational and educational purposes only. It does not constitute financial advice. Commodity markets involve significant risk, and all forecasts and projections discussed are speculative in nature. Past market patterns do not guarantee future results. Readers should seek independent financial advice before making any investment decisions.
Want to Capitalise on the Next Major Gold or Mineral Discovery Before the Broader Market Does?
Discovery Alert's proprietary Discovery IQ model scans ASX announcements in real time, instantly identifying significant mineral discoveries and turning complex data into actionable investment insights — explore the historic returns major discoveries have generated to understand the opportunity, then begin your 14-day free trial at Discovery Alert to position yourself ahead of the market.