May 11, 2026
When Market Rules Stop Working: The Case for a New Gold Price Reality
There are moments in financial markets when the rules that governed asset behaviour for decades simply stop applying. Not temporarily, not because of a single anomalous event, but because the structural foundations underpinning those rules have quietly and permanently shifted. Gold markets appear to be living through exactly such a moment, and the implications for high gold prices are enduring well beyond what short-term price forecasting would suggest.
For most of the past 25 years, gold operated on a recognisable cyclical rhythm. Prices would languish at depressed levels, gradually attract speculative interest, accelerate into a momentum-driven rally, peak at technically extreme overbought levels, and then collapse into sharp, sentiment-destroying drawdowns. This pattern was not just common — it was statistically predictable enough that professional traders built entire frameworks around it.
The pendulum mechanics were well understood: more extreme greed at a cycle peak typically produced proportionally more violent fear on the way down. Sentiment rebalancing through sharp price declines was considered a near-certainty after extreme overbought readings. Then something changed.
When big ASX news breaks, our subscribers know first
The Five Anomalies That Changed the Calculus
Between April 2024 and early 2026, gold registered extreme overbought conditions on five separate occasions — and on each occasion, the expected major drawdown either failed to materialise or arrived in a far milder form than historical precedent demanded. This is not a minor statistical curiosity. It is, as analysis published on Gold-Eagle.com by Adam Hamilton (CPA, Principal and Co-Founder of Zeal LLC) makes clear, a pattern so contrary to precedent that it demands a structural explanation rather than a cyclical one.
The five high-consolidation events are documented in detail below:
| Event Period | Rally Magnitude | Duration | Peak Overbought vs. 200DMA | Subsequent Drawdown | Classification |
|---|---|---|---|---|---|
| Mid-April 2024 | +20.0% | 2.0 months | +18.8% | -5.7% over 0.6 months | Pullback only |
| Late October 2024 | +21.9% | 4.8 months | ~+15% | -8.0% over 0.5 months | Pullback only |
| Mid-April 2025 | +33.5% | 5.2 months | +26.6% | -7.1% over 0.3 months | Pullback only |
| Mid-October 2025 | +36.8% | 5.2 months | +33.0% | -9.5% over 0.5 months | Pullback only |
| Late January 2026 | +37.1% | 2.8 months | +43.4% | -18.6% over 1.8 months | Near-correction |
Each of these episodes saw overbought readings that historically preceded corrections of 20% to 25% or more. To understand how extraordinary this is, consider that the ten largest prior gold cyclical bulls averaged drawdowns of 20.8% over 2.1 months following their peaks. The five largest averaged 26.3% over just 2.5 months. The January 2026 peak — where gold stretched a staggering 43.4% above its 200-day moving average — represented the most extreme overbought reading in 45.9 years, comparable only to the January 1980 bubble top that preceded a 43.4% collapse in just 1.9 months.
Instead, gold's January 2026 peak was followed by a turbulent but ultimately contained decline of 18.6% over 1.8 months — painful, but well short of what the historical playbook demanded. When a pattern fails not once but five consecutive times, the weight of evidence shifts from anomaly toward architecture.
"When a historically reliable market signal fails repeatedly across five consecutive episodes of increasing severity, the rational response is not to wait for the pattern to reassert itself. It is to ask what has changed in the underlying structure of the market."
Defining What a Price Regime Shift Actually Means
The distinction between a cyclical bull market and a structural price re-rating is critical to understanding the current gold environment. In a cyclical bull, prices rise on sentiment and momentum, then fully retreat when sentiment reverses. In a structural re-rating, however, prices move to a new, permanently higher equilibrium anchored by fundamental supply-demand shifts rather than speculative enthusiasm.
Historical parallels exist in other commodity markets. Oil in the early 2000s underwent a structural re-rating as Chinese industrialisation permanently lifted the demand baseline. Copper experienced a similar shift as China's infrastructure decade rewrote global demand arithmetic. In both cases, the hallmark was not an absence of price corrections but the establishment of higher correction floors — old resistance levels becoming new support zones.
This is precisely the technical signature now appearing in gold. Analysis of gold's price behaviour in recent weeks shows that bounces have occurred at what were formerly strong resistance levels during the late monster record bull run. In technical analysis, the conversion of prior resistance into support is one of the most reliable indicators of genuine price re-rating rather than speculative bubble dynamics.
Understanding the Technical Language: Pullback, Correction, Bear Market
For context, market participants use specific terminology to classify price declines by severity:
- Pullback: A price decline of less than 10% from a recent peak
- Correction: A decline of 10% to 20%, signalling meaningful sentiment rebalancing
- Bear market: A sustained decline exceeding 20%, often indicating a fundamental shift in outlook
Four of gold's five recent post-peak drawdowns qualify only as pullbacks. The fifth, at 18.6%, sits in correction territory but at the lower boundary. None have crossed into bear market territory — a fact that is historically extraordinary given the overbought extremes that preceded each.
The Supply-Demand Architecture Behind High Gold Prices Enduring
Technical analysis alone cannot explain why high gold prices are enduring at a structural level. The more compelling argument lies in the fundamental supply-demand architecture of the gold market — an architecture that has quietly but profoundly shifted in favour of sustained higher prices.
The Physical Supply Constraint: A Geological Reality
Gold is not produced on demand. The geological reality of gold mining imposes hard constraints on supply growth that no amount of capital investment can rapidly overcome. Accessible high-grade gold deposits are becoming increasingly scarce as decades of intensive exploration exhaust the most productive geological settings.
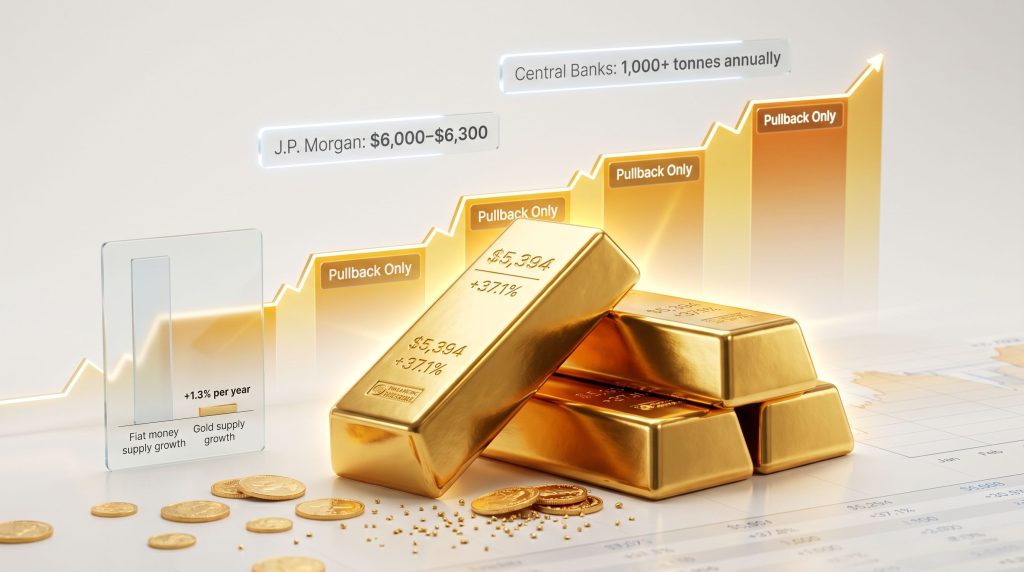
Mine development timelines typically span 10 to 15 years from initial discovery to first production. This means that even a dramatic surge in gold demand today cannot be met by new supply for well over a decade. According to World Gold Council data, global mined gold supply has grown at an average rate of just 1.3% per year over the past decade — a figure that is immovable in the short to medium term regardless of price incentives.
Furthermore, compare this to the monetary expansion occurring across major fiat currencies:
| Supply Type | Annual Growth Rate | Years to Double |
|---|---|---|
| Global mined gold supply | ~1.3% | ~70 years |
| Major fiat currency (at 10% growth) | ~10% | ~7 years |
This asymmetry is fundamental. More currency units chasing a relatively fixed stock of gold creates a persistent structural floor under prices. It is not a trading thesis — it is arithmetic.
"The World Gold Council's decade-long data confirms that global mined gold supply grows at approximately 1.3% annually. At that rate, the world's above-ground gold stock takes roughly 70 years to double, while a fiat currency supply growing at 10% annually doubles in under a decade. This divergence is a foundational argument for a permanently higher gold price equilibrium."
Are American Investors Structurally Absent from Gold?
Perhaps the most striking structural support for sustained high gold prices is the degree to which the world's largest investor base remains almost entirely uninvested in the asset. A revealing way to measure this is to compare the total bullion value held within major US-listed gold ETFs (GLD, IAU, and GLDM combined) against the aggregate market capitalisation of the S&P 500.
Even at gold's January 2026 peak near $5,394 per ounce, combined ETF gold holdings represented less than 0.5% of S&P 500 market capitalisation. American investors, who dominate global capital allocation, are essentially absent from gold as an asset class. Consequently, the demand implications of even modest reallocation are highly significant:
| Allocation Scenario | Description | Price Implication |
|---|---|---|
| Current: ~0.5% of equity cap | Baseline under-allocation | ~$4,400-$5,400 range |
| Doubles to 1.0% | Still a minimal allocation | Strong structural support above $5,000 |
| Quadruples to 2.0% | A tiny portfolio weight by historical standards | Multi-year demand-driven price extension |
This is not a speculative scenario. If equity markets enter a prolonged bear phase — a genuine risk given stretched valuations amid an AI-driven speculative cycle — even a modest defensive reallocation toward gold as a safe haven from such a low starting point represents an enormous incremental demand surge relative to physical supply availability.
Central Bank Accumulation: The Demand Floor Beneath the Market
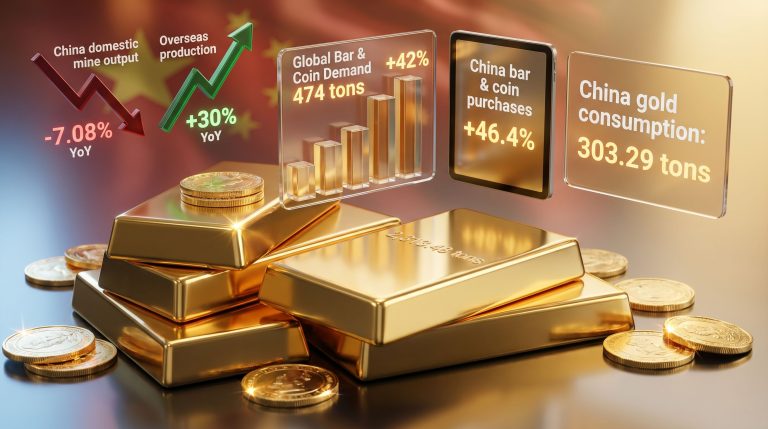
Since 2022, global central bank gold demand has exceeded 1,000 tonnes annually, a pace of accumulation that is unprecedented in the modern era. J.P. Morgan has projected central bank purchases of approximately 800 tonnes for 2026 alone, reflecting a sustained and deliberate diversification away from US dollar reserve assets.
The primary drivers include China, Poland, and India, among others, systematically rebalancing their foreign exchange reserves to reduce USD concentration risk. This is not a short-term tactical trade — it reflects long-duration geopolitical and monetary strategy that takes years to reverse.
Turkey's actions during the March 2026 conflict-related selling period illustrate an important dimension of sovereign gold that is less commonly understood. Turkey liquidated 9.5% of its total gold reserves within a short period as conflict disruptions created economic pressure. This revealed gold's dual role in sovereign reserve management: it functions simultaneously as a long-term store of value and as an emergency liquidity instrument in crisis conditions. When sovereigns sell gold under duress, it is precisely because gold is liquid and globally recognised — a quality that simultaneously validates and reinforces its reserve asset status.
Geopolitical and Inflationary Pressures: Near-Term Amplifiers
Structural supply-demand dynamics provide the foundation, but the current geopolitical environment is adding powerful near-term amplification to the case for high gold prices enduring.
The Strait of Hormuz Disruption and Inflation Transmission
The Strait of Hormuz is the world's most critical maritime chokepoint for crude oil transit, with approximately 20% of global oil trade passing through this narrow passage. Its effective closure following conflict escalation has, by mid-May 2026, resulted in the cumulative loss of approximately 1 billion barrels of crude oil supply over nearly 10 weeks of disruption.
The inflationary transmission mechanism operates across multiple channels:
- Higher crude oil prices directly increase transport and logistics costs across all physical goods
- Elevated energy costs feed into manufacturing and processing across global supply chains
- Fertiliser prices surge as natural gas (a key feedstock) becomes more expensive, pushing up agricultural input costs
- Food price inflation follows, affecting household cost-of-living calculations globally
Gold has a well-documented historical relationship with inflationary environments. During the 1970s oil shock cycles, gold performed strongly as investors sought a store of value with supply-constrained characteristics. The current environment presents an analogous dynamic: sustained energy-driven inflation is eroding purchasing power of fiat currencies at precisely the moment when gold supply cannot meaningfully respond to increased demand.
There is also a psychological mechanism at work. When investors personally experience inflation in everyday life — fuel, food, utilities — they become more likely to increase portfolio allocations toward hard assets. This retail demand impulse compounds institutional and central banks and gold purchasing, creating demand pressure across multiple buyer categories simultaneously.
Futures Positioning: A Contrarian Bullish Signal
An often-overlooked component of the near-term gold outlook is the positioning data among leveraged gold futures speculators. Current long positioning among this group remains at historically low levels — which represents a contrarian bullish indicator rather than a bearish one.
When speculative futures positioning is elevated, a market faces significant forced-selling risk if prices decline, because highly-leveraged long positions must be unwound. When positioning is depressed, however, this risk is substantially reduced: there are fewer forced sellers, and significant buying capacity remains uncommitted. The current low-positioning environment means the market has substantial latent buying power yet to be deployed.
How to Navigate Gold's Current Trading Range
For investors and traders seeking to position around the current high-consolidation thesis, the technical structure of the current range provides a practical framework.
The established consolidation zone runs from approximately $4,400 (the March 2026 closing low) to $5,400 (the January 2026 parabolic peak). Dividing this range into quartiles yields the following reference points:
- Lower quartile boundary: ~$4,641
- Mid-lower boundary: ~$4,892
- Mid-upper boundary: ~$5,143
- Upper boundary (breakout level): ~$5,400
Analysis of high-consolidation phases suggests the lower quartile (sub-$4,640) represents the highest-conviction entry zone during such phases. Prices in this region represent maximum distance from the upper resistance, providing the most asymmetric risk-reward profile for new positions.
A decisive move above $5,400 would signal a breakout to new highs and the potential end of the consolidation phase. A decisive break below $4,400 would challenge the high-consolidation thesis and warrant reassessment of the structural re-rating narrative.
Gold Miners as a Leveraged Expression
Major gold producers have historically amplified gold price moves by 2x to 3x, while smaller mid-tier and junior miners can deliver even greater leverage to directional gold moves. This amplification occurs because miners carry fixed operating costs: when the gold price rises, profit margins expand disproportionately, creating earnings leverage well beyond the percentage move in the underlying metal.
Importantly, undervalued gold stocks have lagged the gold price significantly during the current bull cycle, creating a valuation gap that represents an asymmetric opportunity for investors willing to accept the additional operational risks inherent in mining equities. The combination of structural gold price support, low current investor allocation, and miner undervaluation creates a multi-layered investment case.
Note: Investing in gold miners involves risks beyond those of gold itself, including operational, geological, and jurisdictional risks. This analysis is informational in nature and does not constitute personal financial advice.
The next major ASX story will hit our subscribers first
What Major Institutions Project for Gold
The structural bullish case is not confined to independent analysis. Several major financial institutions have published gold price forecasts that reflect similar logic, as outlined below:
| Institution | Price Target | Timeframe |
|---|---|---|
| J.P. Morgan | $6,000-$6,300/oz | 2026 base case |
| VanEck | $5,000/oz | By 2030 |
| Broad consensus range | $5,000-$5,500/oz | End of 2026 |
Common threads across institutional bullish forecasts include sustained central bank demand, structural fiat currency debasement, and the significant room available for investor allocation to increase from current near-zero levels. Bear case scenarios typically centre on sustained USD strengthening, significant geopolitical de-escalation, reversal of central bank accumulation trends, or a meaningful rise in real interest rates.
Critically, the structural supply-demand argument survives most near-term catalyst scenarios. Even if the Strait of Hormuz situation resolves, or if a geopolitical de-escalation temporarily reduces safe-haven demand, the arithmetic of 1.3% gold supply growth versus 10%+ fiat monetary expansion does not disappear.
Disclaimer: Institutional price forecasts are projections based on current available data and assumptions, not guarantees of future performance. Gold prices can and do fall significantly. Past performance is not indicative of future results.
Bubble or Re-Rating? The Diagnostic Framework
A legitimate challenge to the structural re-rating thesis is the possibility that current gold prices simply reflect a speculative bubble. The distinction matters enormously for investors, and several diagnostic criteria help differentiate the two scenarios.
Speculative bubble characteristics:
- Demand driven primarily by narrative and price momentum
- Broad retail participation driven by fear of missing out
- Fundamental valuations disconnected from observable supply-demand shifts
- Price collapses when momentum reverses, regardless of fundamentals
Structural re-rating characteristics:
- Demand anchored in measurable, durable supply-demand shifts
- Institutional and sovereign buyer participation alongside retail
- Price behaviour consistent with higher correction floors rather than full reversal
- Supply constraints that prevent rapid response to demand increases
Gold's current profile aligns substantially more with re-rating characteristics. Central bank demand exceeding 1,000 tonnes annually is not sentiment-driven — it is policy-driven and reverses slowly if at all. Investor allocation below 0.5% of equity market cap represents genuine structural under-ownership, not speculative excess. And physical supply growth at 1.3% annually is a geological reality, not a narrative.
The five consecutive high-consolidation events are perhaps the most compelling single piece of evidence: speculative bubbles do not repeatedly defy historically-reliable technical signals for correction. Structural re-ratings do. For a broader perspective on record-breaking gold prices and what is driving them, further commentary is available from financial journalists tracking these developments in real time.
Frequently Asked Questions About High Gold Prices Enduring
Why are gold prices staying elevated despite extreme overbought readings?
Structural demand from central banks purchasing over 1,000 tonnes annually, historically low investor allocation below 0.5% of equity market cap, and a fundamental divergence between fiat currency supply growth (10%+) and physical gold supply growth (1.3%) are collectively providing a price floor that technical selling pressure cannot sustainably overcome.
What would cause gold prices to fall significantly from current levels?
A sustained USD strengthening cycle, rapid and durable geopolitical de-escalation, a reversal of central bank accumulation trends, a meaningful rise in real interest rates, or a significant reduction in inflationary pressures could each exert downward pressure on gold.
How does war-driven inflation affect the gold price outlook?
Rising energy and food prices driven by supply disruptions increase inflation expectations, which erodes purchasing power confidence in fiat currencies. This drives both institutional and retail investors toward gold as a store of value with supply-constrained characteristics, increasing demand across multiple buyer categories simultaneously.
What is the difference between a gold pullback, correction, and bear market?
- Pullback: Price decline of less than 10% from a recent peak
- Correction: Decline of 10% to 20%, indicating meaningful sentiment rebalancing
- Bear market: Sustained decline exceeding 20%, often signalling fundamental trend reversal
How under-invested are American investors in gold?
Major gold ETF holdings across GLD, IAU, and GLDM combined represented less than 0.5% of S&P 500 market capitalisation even at gold's January 2026 peak. This is an extraordinarily low allocation by historical standards and implies vast latent demand capacity.
How should investors approach gold miners in this environment?
Technical analysis of the current consolidation range suggests the sub-$4,640 zone represents the highest-conviction entry area for accumulating exposure. Major miners offer 2x to 3x leverage to gold price moves; junior and mid-tier miners can offer greater leverage with correspondingly higher operational risk. Position sizing and portfolio risk management remain essential considerations.
The Structural Case in Summary
The convergence of evidence across technical, fundamental, and macroeconomic dimensions points toward the same conclusion: high gold prices are enduring not as a temporary speculative artefact but as the early expression of a genuine structural price regime shift.
Five consecutive high-consolidation episodes following extreme overbought readings constitute a statistically remarkable pattern that demands a structural rather than cyclical explanation. The supply-demand architecture supporting this conclusion is built on three interlocking pillars:
- Physical gold supply constrained to 1.3% annual growth by irreducible geological realities
- Investor allocation to gold below 0.5% of equity market cap, leaving vast demand capacity uncommitted
- Central bank accumulation exceeding 1,000 tonnes annually as de-dollarisation accelerates
Near-term amplifiers including war-driven commodity inflation, low futures speculator positioning, and the latent risk of an equity market bear cycle add additional demand pressure on top of structural foundations.
For investors and traders, the practical framework is clear: monitor gold's behaviour within the $4,400 to $5,400 consolidation range, treat the sub-$4,640 zone as the highest-conviction accumulation window, watch central bank purchase data through quarterly World Gold Council reports, and track futures positioning as a contrarian sentiment indicator.
Whether gold next breaks above $5,400 or first tests the lower boundary of its range, the structural argument for sustained elevated prices remains intact unless the fundamental supply-demand architecture demonstrably shifts. At present, there is little evidence that it will.
"Readers seeking further independent analysis on gold market cycles, structural demand drivers, and long-term price dynamics can explore additional perspectives at Gold-Eagle.com, which publishes ongoing technical and fundamental commentary from a range of independent market analysts."
This article is informational in nature and does not constitute financial advice. Gold and gold-related investments carry risk, including the potential for significant capital loss. All forecasts and price targets referenced are third-party projections and are not guarantees of future performance. Readers should seek independent financial advice before making any investment decisions.
Want to Capitalise on the Next Major Gold Discovery Before the Market Moves?
Discovery Alert's proprietary Discovery IQ model scans ASX announcements in real time, instantly identifying significant mineral discoveries — including gold — and delivering actionable alerts before the broader market catches on. Explore how historic discoveries have generated extraordinary returns on Discovery Alert's dedicated discoveries page, and begin your 14-day free trial today to position yourself at the forefront of the next major find.