
July 28, 2026
When Confidence Becomes a Liability: The Behavioral Finance Behind Gold's June 2026 Collapse
Investor psychology operates on a cruel irony: the stronger the preceding rally, the more dangerous the asset becomes. After gold surged approximately 60% over the twelve months leading into mid-2026, climbing to historic highs above $5,000 per ounce, the metal had quietly transformed from a refuge into a target. Every long-position holder sitting on substantial unrealized gains represented a potential seller waiting for a catalyst. On June 23, 2026, that catalyst arrived in the form of a technology stock rout that rippled outward from semiconductor markets and landed squarely in the precious metals complex — a moment that crystallised exactly how gold price slumps as tech selloff reverberates through global markets, amplifying a drawdown that had already been building for months.
When big ASX news breaks, our subscribers know first
The Liquidity Cascade: Understanding Why Gold Sells Off When Markets Panic
Most retail investors carry a mental model of gold as the asset that rises when everything else falls. This assumption is partially true across long time horizons, but it breaks down spectacularly during acute cross-market stress events. The mechanism behind this failure is known as a liquidity cascade, and it is one of the most misunderstood dynamics in financial markets.
When equity losses mount rapidly, institutional portfolio managers face margin calls, redemption pressure, and regulatory requirements to maintain defined asset ratios. In these moments, they do not sell what they want to sell. They sell what they can sell — which means liquid assets with recent gains. Gold, after a 60% rally, fit that profile precisely.
This pattern has historical precedent across multiple market stress events:
- March 2020 (COVID crash): Gold initially dropped over 12% in the acute selloff phase before recovering sharply once the Federal Reserve signalled emergency intervention.
- September 2008 (GFC peak): Gold fell alongside equities in the immediate crisis period as institutions liquidated everything to meet margin requirements.
- June 2013 (Taper Tantrum): The mere suggestion of Fed tapering triggered a gold decline exceeding 20% as real yield expectations shifted dramatically.
Gold's role as a defensive asset is conditional, not structural. During systemic sell-everything events, the metal's high liquidity and recent price appreciation make it one of the first assets institutional managers sacrifice to plug losses elsewhere in their books.
Furthermore, the gold safe-haven role that many investors rely upon is frequently misunderstood — it functions over cycles, not necessarily over individual crisis days. The June 2026 episode followed this exact template. The trigger was a second consecutive session of sharp selling in AI-exposed technology stocks, with Micron declining approximately 11% and South Korea's SK Hynix falling around 13%. The Nasdaq Composite dropped roughly 2% while the South Korean KOSPI index fell near 10%, creating a contagion that spread across asset classes within hours.
Mapping the Damage: Gold and Silver Price Data in Context
The scale of the June 23 move, while significant on an intraday basis, needs to be understood within the larger drawdown that had been unfolding since late February 2026.
| Metric | Data Point |
|---|---|
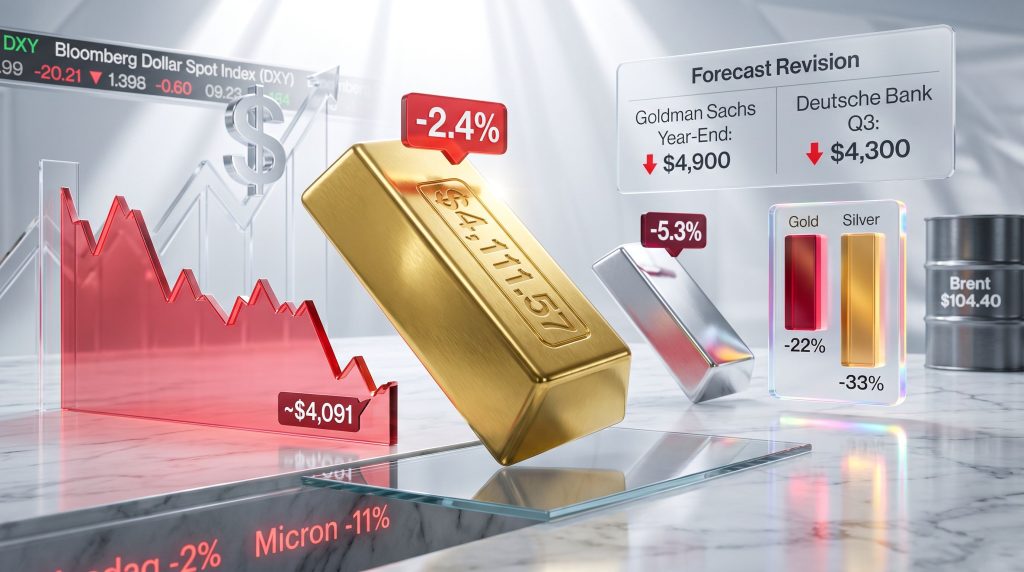
| Gold spot price (June 23, 2026) | $4,111.57 per ounce |
| Intraday low (June 23, 2026) | ~$4,091 per ounce |
| Intraday decline from session high | -2.4% |
| Last time gold traded below $4,000 | November 2025 |
| Gold decline since Iran conflict began (late Feb 2026) | -22%+ |
| Silver decline over same period | -33%+ |
| Silver spot price (June 23, 2026) | $61.63 per ounce |
| Silver intraday decline | -5.3% (peak intraday: -5.8%) |
A 22%+ retreat from peak places gold firmly within technical bear market territory by conventional definition, which requires a sustained decline exceeding 20% from a prior high. For longer-term perspective, the 2011 to 2015 gold bear cycle saw prices fall approximately 45% from their peak, so the current drawdown, while painful, does not yet approach that magnitude.
Why Silver's Losses Were Disproportionately Severe
Silver's -33% decline from the same late-February starting point compared to gold's -22% reflects something structural about the metal's dual identity. Silver operates simultaneously as a monetary asset and an industrial commodity. During risk-off environments, both narratives fail at the same time: the safe-haven bid collapses alongside the industrial demand story as growth concerns rise.
This double vulnerability creates an amplification effect that consistently produces larger percentage drawdowns in silver than in gold during the same stress period. Reviewing the gold-silver ratio analysis across prior cycles makes this structural asymmetry particularly clear. This silver-to-gold amplification ratio is well-documented and is not an anomaly. Traders who understand this dynamic often use silver's relative performance as a leading indicator of the severity of precious metals corrections.
The Federal Reserve Factor: How Kevin Warsh's Hawkish Stance Reshaped the Gold Equation
Beyond the equity market contagion, the deeper structural pressure on gold in mid-2026 originated in a fundamental repricing of interest rate expectations. The appointment of Kevin Warsh as Federal Reserve Chair introduced a decisively more hawkish policy framework, and markets have been absorbing that shift progressively since his first communications.
The mechanics by which rising rate expectations suppress gold prices involve three interconnected channels:
- Yield competition: Gold generates no income. When US Treasury yields rise, capital rotates from zero-yield gold into yield-bearing government securities. This rotation is both rational and accelerating.
- Dollar strengthening: The Bloomberg Dollar Spot Index gained 0.4% on June 23 alone, while the broader dollar gauge had risen 0.8% since the Fed's last policy meeting. A stronger dollar makes gold more expensive for non-US buyers, reducing global demand volumes.
- Real yield expansion: As nominal yields rise and inflation expectations stabilise, real yields climb. Higher real yields are historically the single most reliable negative driver of gold prices over medium-term horizons.
The relationship between gold and bond dynamics is consequently central to understanding how the current rate environment is reshaping gold's medium-term trajectory. Michael Hsueh, an analyst at Deutsche Bank, noted in research published around this period that Federal Reserve repricing, combined with resilient US macroeconomic data, had been the primary mechanism driving gold lower.
Institutional Forecast Revisions: Reading Between the Lines
When major investment banks revise forecasts dramatically in a short window, it signals more than a change in price targets. It reflects a shift in the underlying narrative framework that was supporting those targets.
| Institution | Revised Q3 2026 Target | Revised Year-End 2026 Target | Change from Prior |
|---|---|---|---|
| Deutsche Bank | $4,300 | $4,800 | Q3 cut of ~22% |
| Goldman Sachs | N/A | $4,900 | -$500 from prior year-end |
Goldman Sachs' accompanying projection of zero rate cuts from the Fed across all of 2026 represented a dramatic reversal from earlier market consensus, which had anticipated one or two cuts before year-end. This single assumption change has cascading implications for gold: every eliminated rate cut expectation strengthens the dollar and raises the relative attractiveness of yield-bearing alternatives.
There is also a reflexive dimension to institutional forecast revisions that is rarely discussed openly. Bearish analyst revisions published by systemically important banks influence the behaviour of fund managers who use those forecasts as input to their own models. The revision creates the very selling it anticipates, producing a self-validating cycle that can extend price declines beyond what fundamentals alone would justify. For broader context, the gold price forecast heading into 2025 had been considerably more optimistic, underscoring how rapidly macro conditions can shift underlying assumptions.
Macro Crosscurrents: Oil Prices, the Iran Deal, and the PCE Inflation Wildcard
The broader commodity complex on June 23 reflected a market navigating conflicting macro forces simultaneously.
| Commodity | Price (June 23, 2026) | Day Change |
|---|---|---|
| Brent Crude | $104.40/bbl | -4.21% |
| WTI Crude | $101.85/bbl | -3.06% |
| Copper | $5.6358/lb | +2.72% |
| Platinum | $1,973.85/ozt | +4.22% |
| Palladium | $1,496.50/ozt | +5.39% |
| Gold Futures | $4,713.30/ozt | +3.84% |
| Silver Futures | $75.495/ozt | +7.47% |
Note: Futures contract pricing reflects forward market expectations and diverges from spot prices due to contango and backwardation dynamics. Day changes for futures reflect forward-period repricing rather than spot-equivalent moves.
An interim US-Iran peace deal signed the week prior had injected brief optimism into risk sentiment, but its limited scope meant it could not offset the weight of hawkish Fed commentary. Structurally elevated oil prices, with Brent remaining above $100 per barrel despite the day's decline, continued to feed into personal consumption expenditure (PCE) inflation expectations. This created a self-reinforcing logic: higher energy costs support persistent inflation, which supports a hawkish Fed, which suppresses gold. According to reporting from the SMH, gold and silver had shown tentative signs of stabilisation in early February 2026, however that recovery proved short-lived as macro headwinds reasserted themselves.
The US PCE price index release scheduled for Thursday, June 26, 2026 therefore became the most significant near-term catalyst for the metal's direction.
| PCE Outcome | Likely Gold Market Response |
|---|---|
| Accelerates above consensus | Further selling; dollar strengthens; rate cut hopes diminish |
| In-line with expectations | Modest stabilisation; short-covering possible |
| Undershoots consensus | Relief rally; dollar softens; rate cut narrative partially restored |
Technical Positioning and the Psychology of Profit-Taking
Rhona O'Connell, head of market analysis for EMEA and Asia at StoneX Group Inc., characterised the technical positioning in both gold and silver as unfavourable in analysis published around this period, noting that while certain flow dynamics were showing modest improvement, external forces continued to dominate price discovery for both metals.
This observation points to something important about the current market structure. When technical signals are negative and macro drivers are adverse simultaneously, the normal support mechanisms that arrest declines tend to be overwhelmed. The $4,000 per ounce psychological level represents a major threshold last breached in November 2025, and its proximity during the June 23 session created additional anxiety in the market.
A sustained break below that level would likely trigger algorithmic selling programmes calibrated to momentum signals, potentially accelerating the decline. The preceding 60% rally is central to understanding why profit-taking pressure was so intense. A core principle of behavioural finance holds that investors systematically underweight the probability of mean reversion following extended rallies, causing position sizes to grow relative to underlying risk tolerance.
The next major ASX story will hit our subscribers first
The Structural Bull Case: What Survives the Correction
Despite the severity of the current drawdown, several long-duration demand drivers remain structurally intact and are worth separating from near-term price noise.
- Central bank accumulation: The ongoing central bank gold demand from emerging market institutions, particularly in Asia and the Middle East, provides a demand floor that does not respond to short-term price volatility in the way speculative positions do.
- Geopolitical fragmentation: The Iran conflict, even in its current ceasefire phase, underscores a broader pattern of geopolitical fragmentation that structurally elevates the premium investors assign to non-sovereign stores of value.
- De-dollarisation momentum: The long-term trend toward reducing USD concentration in global reserve portfolios has not reversed. Gold remains the primary beneficiary of this structural reallocation, and that dynamic operates over multi-year, not multi-month, time horizons.
- 200-day moving average positioning: Long-term institutional buyers with mandate-driven allocation models often use the 200-day moving average as a re-entry signal, creating a natural support mechanism absent from shorter-term price action.
In addition, analysis from AFR highlighted that even as prices corrected sharply, retail investors poured a record $1 billion into gold ETFs — a sign that underlying conviction in the metal's long-term value proposition remains robust.
Key Triggers to Monitor Through Q3 2026
Three macro catalysts will determine whether the current correction deepens or stabilises:
- PCE Inflation Data (June 26, 2026): A reading above consensus would reinforce the zero rate cut thesis and extend selling pressure on gold.
- Federal Reserve Forward Guidance: Any moderation in Kevin Warsh's hawkish rhetoric, whether driven by softening data or financial stability concerns, would represent a meaningful positive catalyst for bullion.
- Iran Deal Durability: A breakdown in the interim peace framework would reintroduce acute geopolitical risk premiums, historically one of the most reliable drivers of safe-haven demand.
| Scenario | Key Assumption | Gold Price Range (Q3 2026) |
|---|---|---|
| Hawkish Fed + Strong PCE | No rate cuts; dollar strengthens | $3,800 to $4,100 |
| Base Case (Deutsche Bank) | Modest macro softening | ~$4,300 |
| Dovish Pivot | Fed signals rate cut; dollar weakens | $4,500 to $4,800 |
| Geopolitical Escalation | Iran deal collapses; oil spikes | $4,600+ |
Key Takeaways
- Gold dropped as much as 2.4% intraday to approximately $4,091 per ounce on June 23, 2026, its lowest point since November 2025 — a clear instance of how gold price slumps as tech selloff reverberates through global markets.
- The immediate trigger was a technology stock rout centred on AI chipmakers, with broader equity market losses forcing institutional liquidation of liquid assets including gold.
- Silver's -5.3% spot decline (-5.8% intraday peak) reflected its amplified dual vulnerability as both a monetary and industrial metal.
- Gold has declined more than 22% since the Iran conflict began in late February 2026, meeting conventional bear market criteria.
- Deutsche Bank cut its Q3 2026 gold forecast by approximately 22% to $4,300, while Goldman Sachs reduced its year-end target by $500 to $4,900 and now projects zero Fed rate cuts in 2026.
- The structural long-term bull case, anchored in central bank demand, de-dollarisation, and geopolitical fragmentation, remains intact despite the near-term correction.
- The June 26 PCE inflation release is the most critical near-term data point for determining gold's next directional move.
This article contains forward-looking analysis, scenario projections, and references to institutional price forecasts. These are not financial advice, and past performance of gold or any commodity does not guarantee future results. All price targets and scenario projections are subject to material revision as macroeconomic conditions evolve.
Want to Know When the Next Major Mineral Discovery Hits the ASX?
Discovery Alert's proprietary Discovery IQ model scans ASX announcements in real time, instantly identifying significant mineral discoveries and turning complex data into actionable investment insights — ensuring subscribers are positioned ahead of the broader market. Explore historic discovery returns on Discovery Alert's discoveries page and begin your 14-day free trial today.