The current precious metals market presents compelling structural momentum patterns that suggest significant trend developments are emerging. Following an extended consolidation period, precious metals have broken above decade-long resistance levels, with the gold price surge demonstrating substantial upward momentum. Technical analysis reveals that the completion of an 11-year base formation indicates potential for sustained outperformance against traditional financial assets.
Understanding the Gold Silver Ratio Framework
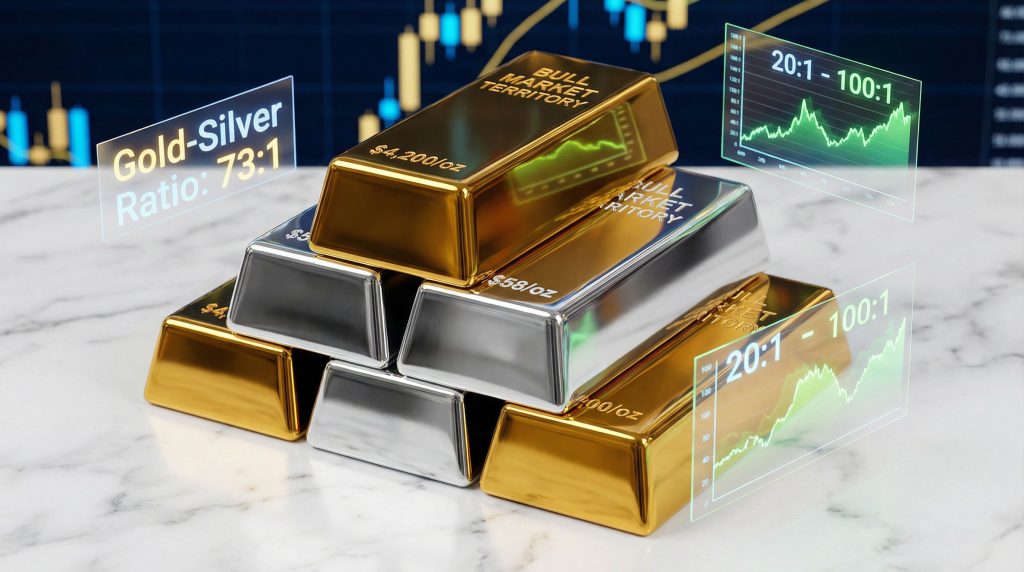
The gold silver ratio serves as a critical barometer for precious metals relative valuation, calculated by dividing the current gold price by the silver price. This metric provides insights beyond individual metal performance, revealing structural shifts in monetary metals markets that precede major price movements. Current gold‑silver ratio insights demonstrate significant analytical value for strategic positioning.
Historical Ratio Patterns and Significance
Throughout financial history, the gold silver ratio has fluctuated dramatically based on economic conditions and monetary policy environments. Ancient civilisations typically maintained ratios between 12:1 and 16:1, reflecting natural occurrence ratios in the earth's crust. Modern markets have witnessed extreme readings ranging from 20:1 during inflationary periods to over 100:1 during economic uncertainty phases.
Historical Gold Silver Ratio Extremes:
• 1979-1980 Bull Market: Ratio compressed from approximately 30:1 to 16:1 as silver experienced an eightfold price increase
• 2010-2011 Cycle: Movement from 65:1 to 32:1 during silver's surge to $50 per ounce
• 2020 COVID Crisis: Extreme reading of 125:1 before rapid compression as monetary metals rallied
• Current Position: Trading around 73:1 with gold at $4,200 and silver near $58
Structural Analysis of Current Market Position
Technical momentum studies reveal that precious metals have recently broken above decade-long resistance levels against traditional equity benchmarks. This structural shift represents the completion of an 11-year consolidation base, suggesting sustained outperformance for monetary metals relative to paper assets may be beginning.
The breakout pattern demonstrates several critical characteristics:
• Momentum confirmation across multiple timeframes indicating trend persistence
• Cross-asset correlation changes between precious metals and equity markets
• Volume expansion supporting price movement sustainability
Why Silver Demonstrates Superior Leverage Characteristics
Silver's unique dual role as both monetary metal and industrial commodity creates distinct leverage dynamics unavailable in gold markets. Unlike gold, where central bank reserves provide supply stability, silver faces increasing industrial consumption while maintaining monetary demand characteristics during currency debasement periods. Furthermore, the silver market squeeze potential creates additional upside leverage opportunities.
Industrial Demand Factors
Modern technological applications consume substantial silver quantities across expanding sectors:
• Solar panel manufacturing requiring approximately 20 grams per panel
• Electronic component production utilising silver's superior conductivity properties
• Medical applications leveraging antimicrobial characteristics
• Automotive technology incorporating silver in electric vehicle components
Mining Production Constraints
Approximately 70% of silver production occurs as byproduct from base metal operations, creating supply inelasticity when silver prices rise rapidly. Primary silver miners represent a concentrated sector with significant operational leverage to price movements, but limited ability to quickly expand production capacity.
This supply structure creates amplified price sensitivity during demand surges, as base metal miners optimise for copper, lead, or zinc rather than silver recovery rates.
Strategic Positioning Through Ratio Analysis
Advanced momentum analysis suggests silver's relative performance versus gold has broken above multi-year resistance levels, historically preceding periods of significant silver outperformance. Ratio compression patterns from previous bull markets provide framework for potential price targets. Additionally, current gold price forecast models support continued strength across precious metals sectors.
Historical Precedent Analysis
| Period | Starting Ratio | Ending Ratio | Silver Performance | Duration |
|---|---|---|---|---|
| 1979-1980 | ~30:1 | ~16:1 | 800% increase | 18 months |
| 2010-2011 | ~65:1 | ~32:1 | 500% increase | 24 months |
| Current Cycle | 104:1 | 73:1 | In progress | Ongoing |
Momentum Breakout Confirmation
Technical indicators across precious metals demonstrate coordinated breakout patterns:
• Gold versus S&P 500 spread breaking above 11-year resistance trend line
• Silver miners versus gold miners ratio approaching breakout levels
• Annual momentum metrics confirming structural trend changes
The completion of massive consolidation bases typically generates proportional price movements, suggesting current breakouts may produce sustained trending behaviour lasting multiple years rather than months.
Federal Reserve Policy Impact on Precious Metals Dynamics
Current monetary policy trajectories indicate continued accommodation despite periodic hawkish rhetoric. Market pricing reflects 90% probability of Federal Reserve rate cuts, creating favourable conditions for non-yielding assets regardless of economic outcomes. However, investors must consider how these policies align with gold strategic investment approaches for optimal positioning.
Interest Rate Environment Analysis
Historical analysis reveals precious metals performance often accelerates during rate cutting cycles, contrary to popular assumptions about monetary tightening effects. The 2001 recession saw gold begin its bull market despite aggressive rate cuts, while the 2008 financial crisis ultimately produced sustained precious metals outperformance.
Key Policy Considerations:
• Zero interest rate policy implemented in 10 of the last 15 years
• M2 money supply expansion creating long-term currency debasement pressure
• Federal debt servicing costs limiting monetary policy flexibility
• International currency competition driving global monetary accommodation
Currency Debasement Mechanics
Long-term dollar index analysis reveals structural weakness patterns despite short-term relative strength against other fiat currencies. Since the 1980s, the dollar index has exhibited a staircase decline pattern with each rally peak reaching lower highs than previous cycles.
The March 2025 high of 104.21 represented a momentum structure breakdown, with subsequent trading in the 98 range suggesting continued weakness ahead.
Investment Implementation Strategies
Professional portfolio construction for precious metals exposure requires understanding leverage characteristics across different investment vehicles. Direct metal ownership provides foundational exposure, while derivative instruments and mining equities offer amplified participation in price movements.
Direct Metal Allocation Approaches
Physical precious metals ownership eliminates counterparty risk while providing portfolio insurance characteristics. Strategic allocation between gold and silver should consider ratio positioning and individual risk tolerance parameters.
Allocation Framework:
• Conservative approach: 70% gold, 30% silver reflecting volatility differences
• Aggressive positioning: 40% gold, 60% silver capitalising on ratio compression potential
• Tactical allocation: Dynamic rebalancing based on ratio movements and momentum signals
Leveraged Exposure Mechanisms
Options strategies provide defined-risk exposure to precious metals volatility:
• Long-dated call options on silver ETFs (SLV) offering time value advantages
• Leveraged ETF positioning through AGQ (2x silver exposure) for amplified participation
• Spread strategies capturing relative performance between gold and silver
Mining Sector Concentration Opportunities
Silver mining companies demonstrate operational leverage coefficients typically ranging from 2:1 to 5:1 relative to underlying metal price movements. Pure-play silver miners offer concentrated exposure to ratio compression dynamics.
Investment Considerations:
• Production cost analysis determining operational leverage at various silver price levels
• Reserve quality assessment evaluating long-term production sustainability
• Management execution track record in previous commodity cycles
• Geographic diversification across mining jurisdictions
Risk Management and Portfolio Considerations
Silver exhibits significantly higher volatility than gold, with standard deviation measurements typically 2-3x greater than gold during trending periods. This volatility profile requires appropriate position sizing and risk management protocols.
Volatility Profile Management
Historical analysis demonstrates silver can experience extreme price movements during momentum phases:
• 1979-1980: Silver increased from $6 to $50 in five months
• 2010-2011: Price doubled from $18 to $48 in seven months
• 2020 surge: Movement from $12 to $30 during monetary policy response
Correlation Breakdown Scenarios
During extreme market stress, traditional correlations between precious metals and other assets can break down completely. The 2008 financial crisis initially saw gold and silver decline alongside equities before decoupling and outperforming during the recovery phase.
Risk Mitigation Strategies:
• Position sizing limiting precious metals exposure to 5-20% of total portfolio
• Diversification across physical metals, ETFs, and mining equities
• Rebalancing protocols capturing ratio compression opportunities
• Hedging mechanisms protecting against extreme volatility through options strategies
Market Structure Evolution and Future Outlook
Institutional adoption of precious metals as portfolio diversifiers continues expanding, with central banks accumulating gold reserves at accelerated rates. This institutional validation supports long-term demand fundamentals beyond retail investment flows. Moreover, comprehensive analysis from Investopedia's historical guide provides additional context for ratio interpretation and timing strategies.
Central Bank Accumulation Patterns
Global central banks have transitioned from net sellers to aggressive buyers of gold reserves, reflecting concerns about fiat currency stability and geopolitical tensions. This institutional demand provides price floor support during market corrections.
Technology-Driven Silver Demand
Expanding industrial applications create structural demand growth independent of monetary considerations:
• Electric vehicle production scaling globally with government mandates
• 5G infrastructure deployment requiring enhanced connectivity components
• Solar energy expansion driven by climate policy initiatives
• Medical technology advancement utilising silver's unique properties
Timing and Entry Point Optimisation
Current technical patterns suggest early stages of major trend development rather than late-cycle positioning. Multiple timeframe momentum confirmation provides higher probability entry opportunities for strategic positioning. Additionally, real-time data from Trading View offers valuable insights for tactical entry timing decisions.
Technical Signal Confirmation
Momentum structure analysis indicates precious metals breakouts have occurred after extended consolidation periods, suggesting sustained trending behaviour rather than short-term speculation. The 11-year base completion in gold versus equity markets represents significant technical development.
Dollar Weakness Correlation Timeline
Precious metals performance often correlates with extended dollar weakness periods. Current dollar index technical patterns suggest potential for multi-year decline phase, supporting metals positioning through various economic scenarios.
Entry Timing Considerations:
• Momentum confirmation across multiple precious metals simultaneously
• Ratio positioning at historically attractive levels for silver relative to gold
• Policy environment supporting continued monetary accommodation
• Industrial demand trends creating structural silver supply deficits
Advanced Ratio Trading Strategies
Professional traders utilise gold silver ratio movements for tactical allocation adjustments, capitalising on extreme readings for enhanced portfolio performance. These strategies require understanding historical ratio ranges and momentum patterns.
Mean Reversion versus Trending Behaviour
The gold silver ratio exhibits both mean-reverting characteristics during stable periods and trending behaviour during monetary crises. Current technical analysis suggests trending phase initiation rather than mean reversion opportunity.
Spread Trading Implementation
Advanced investors can implement spread positions capturing ratio movements while maintaining precious metals exposure:
• Long silver, short gold positions during ratio compression phases
• Options spread strategies defining maximum risk while participating in ratio changes
• Mining stock pairs trading leveraging operational leverage differences between gold and silver producers
Economic Scenario Analysis
Precious metals positioning provides portfolio protection across multiple economic outcomes, from deflationary deleveraging to inflationary currency debasement. This versatility explains institutional adoption trends and central bank accumulation patterns.
Inflationary Environment Response
During inflationary periods, precious metals typically outperform financial assets as investors seek inflation hedges. Silver's industrial demand component provides additional support during economic growth phases accompanied by currency debasement.
Deflationary Scenario Considerations
Even during deflationary environments, precious metals can outperform if currency confidence deteriorates. The 1930s Depression saw gold outperform equities despite deflationary pressure, while modern examples include Japanese precious metals performance during their extended deflation period.
Implementation Timeline and Action Steps
Strategic precious metals positioning requires phased implementation considering market volatility and personal risk tolerance. Professional portfolio managers typically implement precious metals exposure through systematic accumulation rather than concentrated purchases.
Immediate Considerations (0-30 days)
• Portfolio assessment determining appropriate precious metals allocation percentages
• Ratio evaluation considering current 73:1 level relative to historical ranges
• Risk tolerance analysis establishing position sizing parameters
• Implementation vehicle selection between physical metals, ETFs, and mining equities
Medium-term Strategy (1-6 months)
• Momentum monitoring tracking technical breakout sustainability across precious metals
• Gradual position building implementing dollar-cost averaging during volatility
• Federal Reserve policy tracking adjusting positioning based on monetary policy shifts
• Ratio compression monitoring capitalising on silver outperformance opportunities
Long-term Positioning (6+ months)
• Strategic allocation maintenance through market volatility and economic cycles
• Rebalancing protocols based on ratio movements and momentum signal changes
• Structural market monitoring tracking institutional adoption and central bank policies
• Industrial demand assessment evaluating technology-driven silver consumption trends
Disclaimer: This analysis presents educational information regarding precious metals markets and investment strategies. All investment decisions involve substantial risk, and individuals should conduct independent research and consult qualified financial advisors before implementing any investment strategies. Past performance does not guarantee future results, and precious metals investments can experience significant volatility and potential losses.
Ready to capitalise on the next precious metals opportunity?
Discovery Alert's proprietary Discovery IQ model delivers real-time notifications on significant ASX mineral discoveries, instantly turning complex geological data into actionable investment opportunities for both short-term traders and long-term investors. Discover why major mineral discoveries can generate substantial returns by exploring Discovery Alert's dedicated discoveries page and begin your 30-day free trial today to position yourself ahead of the market.