July 28, 2026
The Hidden Mechanics Behind Gold's Sensitivity to Maritime Conflict
Few investors fully appreciate how a narrow waterway connecting the Persian Gulf to the Gulf of Oman can hold global commodity markets in a headlock. The Strait of Hormuz, at its narrowest point just 33 kilometres wide, is the world's most consequential oil transit corridor. Approximately 20% of all globally traded oil moves through this single passage, making it not merely a geographic feature but a systemic risk variable embedded in the pricing of energy, inflation expectations, interest rates, and ultimately, precious metals.
When the conflict that erupted in late February disrupted transit through the strait, the commodity market consequences were not linear. They were compounding. Rising crude prices fed into consumer price indices, which prompted central banks to sustain hawkish rate postures, which in turn depressed demand for non-yielding assets like gold. Understanding the gold price after the US and Iran deal to reopen Hormuz Strait requires first understanding the full mechanical chain that the conflict set in motion.
When big ASX news breaks, our subscribers know first
The Gold-Oil Inverse Relationship: A Framework That Defined the Conflict Period
The relationship between crude oil and gold during the Hormuz conflict period was not incidental. It was structural. When oil prices rise sharply, they inject inflationary pressure into the broader economy. Central banks, mandated to control inflation, respond by maintaining or escalating interest rates. Higher nominal rates, particularly when they outpace inflation expectations, translate into rising real yields. And rising real yields are gold's principal adversary, since gold generates no income and becomes comparatively less attractive against yield-bearing assets such as US Treasuries.
The data from this conflict period confirms that relationship with striking clarity. From the conflict's onset, bullion declined approximately 18% from its peak, with spot prices touching their lowest level since November in the week immediately preceding the deal announcement. This was not a market reacting to gold-specific news. It was a market processing the full chain of consequences flowing from a disrupted maritime chokepoint. Furthermore, gold and bond dynamics during this period reinforced just how mechanically linked real yield movements are to bullion pricing.
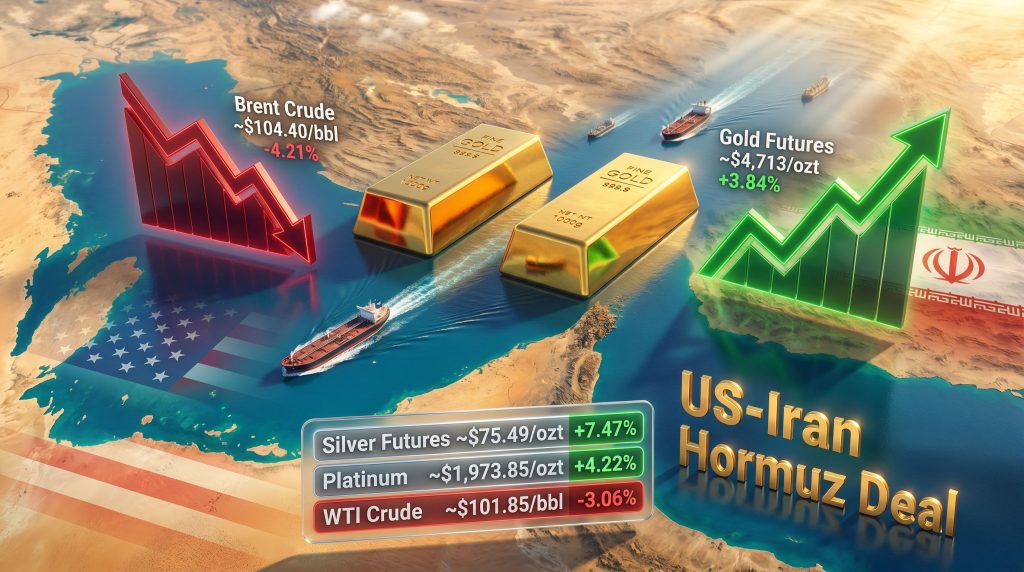
The reversal on June 15, 2026 therefore needs to be understood as the mirror image of that compression. As Brent crude dropped 4.21% to approximately $104.40 per barrel and WTI fell 3.06% to approximately $101.85 per barrel, the inflationary premium embedded in rate expectations began unwinding. Gold responded immediately.
Commodity Market Snapshot: June 15, 2026
| Commodity | Price | Session Change |
|---|---|---|
| Gold Futures | ~$4,713.30/ozt | +3.84% |
| Spot Gold | ~$4,322.91/ozt | +2.50% |
| Silver Futures | ~$75.495/ozt | +7.47% |
| Micro Silver Futures | ~$75.48/ozt | +7.54% |
| Platinum | ~$1,973.85/ozt | +4.22% |
| Palladium | ~$1,496.50/ozt | +5.39% |
| Brent Crude | ~$104.40/bbl | -4.21% |
| WTI Crude | ~$101.85/bbl | -3.06% |
| Copper | ~$5.6358/lb | +2.72% |
| Aluminum Futures | ~$3,314.25/ton | -1.21% |
The breadth of the precious metals advance is significant. Silver's intraday surge of up to 4.9%, alongside platinum climbing 4.22% and palladium gaining 5.39%, signals a sector-wide re-rating rather than a gold-specific technical bounce. Silver's dual role as both a monetary asset and an industrial input gives it a particularly sensitive response to shifting inflation and growth expectations simultaneously.
What the US-Iran Memorandum of Understanding Actually Represents
The agreement announced on June 15, 2026 is best characterised as an interim framework rather than a completed diplomatic instrument. Washington and Tehran described the document as a memorandum of understanding, with a formal signing anticipated in Switzerland. As of the announcement date, critical components remained under active negotiation, including the architecture of sanctions relief and the specific parameters governing Iran's nuclear programme.
President Trump publicly stated that oil tankers were already transiting the strait, a claim that carries significant market implications regardless of its precise verification status. Markets priced the statement as directionally credible, which is sufficient to generate the kind of sentiment shift observed in commodity prices on June 15. According to reporting from Yahoo Finance, gold rose meaningfully as the US and Iran reached the agreement, confirming broad market sensitivity to the announcement.
Key Risk: The incomplete nature of the agreement introduces a meaningful volatility premium. Traders cannot treat a memorandum of understanding as equivalent to a formalised treaty. Until the Switzerland signing occurs and key terms are resolved, the deal remains subject to collapse, renegotiation, or material modification.
The Three-Scenario Framework for Gold Investors
Gold's near-term trajectory is not a single-path outcome. The deal's progression through distinct phases creates materially different price environments for bullion holders and mining equity investors.
| Scenario | Deal Status | Expected Gold Behaviour | Key Drivers |
|---|---|---|---|
| Scenario A | Deal confirmed and formally signed | Initial safe-haven premium unwind; medium-term support from dollar softness | Lower real yields, reduced inflation expectations |
| Scenario B | Deal stalls or faces significant delay | Choppy, range-bound trading with elevated intraday volatility | Uncertainty repricing, oil price oscillation |
| Scenario C | Negotiations collapse | Sharp downside risk, potential safe-haven re-entry at lower levels | Renewed conflict risk, oil spike, accelerated rate hike expectations |
Christopher Wong, FX strategist at Oversea-Chinese Banking Corp., noted that for gold to build genuine upside momentum, the external environment needs to deliver a convergence of softer yields, lower oil prices, and clear evidence that the Federal Reserve's hawkish repricing cycle has reached its ceiling. His assessment underscores a critical point: the Hormuz deal is a necessary but insufficient condition for a sustained bullion recovery.
The Four Structural Pillars Required for a Durable Gold Recovery
Pillar 1: US Treasury Yield Trajectory
Real yields remain the dominant mechanical driver of gold pricing over medium-term horizons. For bullion to sustain gains beyond the initial relief-trade, US Treasury yields need to demonstrably soften. The Federal Reserve's rate posture under incoming Chair Kevin Warsh is a critical variable. Market expectations as of mid-June 2026 remain geared toward at least one additional rate hike later in the year, which functionally caps gold's ceiling until those expectations shift.
Pillar 2: Oil Price Normalisation at Scale
A single session's decline in crude prices does not constitute a structural energy price reset. Historical analysis of prior energy price corrections suggests that the transmission from lower crude prices into consumer price indices typically lags by six to nine months. This means that even a confirmed strait reopening will not produce immediate CPI relief. Investors should therefore be cautious about conflating a directional shift in oil with a rapid unwinding of inflation expectations. The oil market disruption impacts that preceded this deal have embedded inflationary expectations that will take time to fully unwind.
Pillar 3: Dollar Dynamics
The US dollar functions as the primary transmission mechanism between geopolitical risk and gold pricing. On June 15, the Bloomberg Dollar Spot Index declined 0.1%, a modest but directionally consistent signal. A more pronounced weakening of the dollar would amplify gold's upside even within a de-escalation environment, since gold is priced in dollars and inversely sensitive to the currency's purchasing power.
Pillar 4: Confirmation of the Federal Reserve's Hawkish Peak
This is arguably the most consequential variable for gold's medium-term trajectory, and it is entirely independent of the Hormuz deal. The hawkish repricing peak occurs when markets collectively stop pricing in additional rate hikes and begin positioning for a plateau or reversal in the tightening cycle. A shift in the Fed's forward guidance language at its next meeting under Chair Warsh, even without an immediate rate cut, could be sufficient to trigger a more sustained gold rally. The Hormuz deal creates conditions that make this pivot more plausible, but it cannot deliver the pivot itself. In this context, central banks influencing gold remain a defining force in determining how durable any recovery ultimately proves to be.
Gold Mining Equities: The Leverage Effect in Action
One of the most instructive dimensions of June 15's market action was the performance gap between spot gold and gold producer equities. While spot gold advanced approximately 2.5%, major mining stocks dramatically outperformed.
- Newmont Corp. and Agnico Eagle Mines Ltd., the world's top two gold producers by output, each rose more than 7.5% in New York trading.
- Barrick Mining Corp., ranked third globally, advanced more than 6.5%.
- The gap between spot performance and equity performance reflects embedded operational leverage.
Gold mining equity leverage is worth understanding in mechanical terms. Gold producers carry largely fixed operating costs. When the gold price rises, revenue increases while costs remain relatively stable, meaning incremental price gains flow disproportionately to earnings and margins. A 3% rise in spot gold can translate into a 7–8% improvement in producer earnings sensitivity, which explains the equity outperformance observed.
However, this leverage operates symmetrically. During price declines, producer equities typically fall harder than spot gold. Investors considering mining equities as a leveraged play on bullion recovery should also account for:
- Hedging book exposure: producers with substantial forward sales contracts may not capture the full benefit of spot price gains.
- Jurisdictional risk: operations in conflict-adjacent regions carry elevated disruption risk that spot gold does not.
- Production cost inflation: energy is a significant input cost for mining operations, meaning oil price movements affect the cost side of the equation simultaneously.
Unwinding the War Premium: How Inflation Dynamics Actually Shift
The Hormuz conflict injected what traders refer to as a war premium into energy prices. This premium is not simply the cost of current supply disruption but also the insurance value markets assign to ongoing uncertainty about future supply. As the deal removes the risk of prolonged strait closure, the war premium begins deflating.
What is less commonly appreciated is that the inflation consequences of this premium operate on entirely different timescales across the economic system. Energy price spikes appear almost immediately in producer price indices and fuel costs. They take longer to transmit into core services inflation. The Federal Reserve cannot credibly pivot away from a hawkish posture until core inflation shows sustained deceleration, not just a one-session decline in crude prices.
This lag structure explains why Christopher Wong's framework requiring softer yields, lower oil prices, and clear evidence of a Fed hawkish peak represents three distinct conditions that can only converge over weeks or months, not days. Consequently, gold's safe-haven role does not simply evaporate with a single diplomatic announcement — it recalibrates gradually as the macro environment shifts.
The next major ASX story will hit our subscribers first
Is This a Relief Trade or the Beginning of a Bull Market Resumption?
The analytical distinction between a geopolitical relief rally and a structurally-driven bull market resumption is not merely academic. It has direct consequences for position sizing, time horizon, and risk management.
Characteristics of a relief trade:
- Sharp, immediate move on a single catalyst.
- Reverses partially once the initial sentiment shift is priced in.
- Not confirmed by sustained improvement in underlying macro drivers.
Characteristics of a structural bull market resumption:
- Sustained price appreciation across multiple sessions.
- Confirmed by improving real yield dynamics, dollar weakness, and institutional net-long positioning in futures markets.
- Supported by a shift in central bank forward guidance.
Gold's 18% drawdown since the conflict began creates a significant technical base for recovery. However, that same drawdown means the asset remains in a structurally compromised position relative to its conflict-era highs. Speculative futures positioning data will be a key indicator to monitor in the days following the announcement. A meaningful increase in managed money net-long positions would suggest institutional conviction behind the move, rather than short-covering alone.
As analysts at GoldSilver have noted, Iran-related news has historically sent gold in both directions, and the underlying driver is rarely Iran itself — it is the broader macro repricing that geopolitical events trigger.
What Would Invalidate the Bullish Case
- A collapse in the memorandum of understanding before formal signing.
- Oil prices failing to sustain their decline, potentially reversing on supply-side developments unrelated to the strait.
- The Federal Reserve delivering a rate hike more aggressive than currently priced at its upcoming meeting.
- A renewed safe-haven bid for the US dollar, which would mechanically suppress gold's dollar-denominated price.
Frequently Asked Questions: Gold Price After the US and Iran Deal to Reopen Hormuz Strait
Why did gold rally on the Hormuz strait deal announcement?
The prospect of lower oil prices reduces inflationary pressure, which softens expectations for further central bank rate hikes. Since gold pays no yield, falling real rate expectations improve its relative attractiveness. The deal also modestly weakened the US dollar, providing an additional tailwind.
Why has gold fallen roughly 18% since the conflict began?
The strait's disruption drove energy prices higher, feeding inflation, which prompted central banks to maintain hawkish rate postures. Rising real yields made yield-bearing assets more attractive relative to gold, suppressing bullion demand and prices.
Is the US-Iran agreement fully binding?
No. As of June 15, 2026, the document is a memorandum of understanding with a formal signing anticipated in Switzerland. Significant elements including sanctions relief structure and nuclear programme parameters remain under negotiation.
Why did silver outperform gold on June 15?
Silver functions as both a monetary metal and an industrial commodity. A de-escalation environment simultaneously reduces safe-haven demand for the dollar and improves industrial activity expectations, compressing two separate bearish pressures on silver at once. This dual sensitivity explains silver's amplified percentage response.
What needs to happen for gold to sustain its recovery?
Analysts point to a convergence of conditions: formal confirmation of the peace agreement, a sustained decline in oil prices, evidence that the Federal Reserve's rate hike cycle has peaked, and a durable softening in US Treasury yields.
Why do gold mining stocks outperform spot gold during price rallies?
Operational leverage. Fixed production costs mean rising gold prices disproportionately benefit producer margins, amplifying the earnings impact of spot price gains. This same leverage works in reverse during price declines.
Disclaimer: This article contains forward-looking analysis, price commentary, and scenario projections based on publicly available market data as of June 15, 2026. It does not constitute financial advice. Commodity and equity markets are subject to rapid change, and past price relationships do not guarantee future outcomes. Investors should conduct their own research and consult qualified financial advisers before making investment decisions.
Want to Identify the Next Major ASX Mineral Discovery Before the Broader Market?
Discovery Alert's proprietary Discovery IQ model delivers real-time alerts on significant ASX mineral discoveries, transforming complex geological and market data into actionable investment insights for traders and investors at every experience level — start your 14-day free trial today, or explore Discovery Alert's discoveries page to understand how historic mineral discoveries have generated substantial market returns.