
August 14, 2026
When Geopolitical Fear Meets Monetary Reality: The Forces Holding Gold in Check
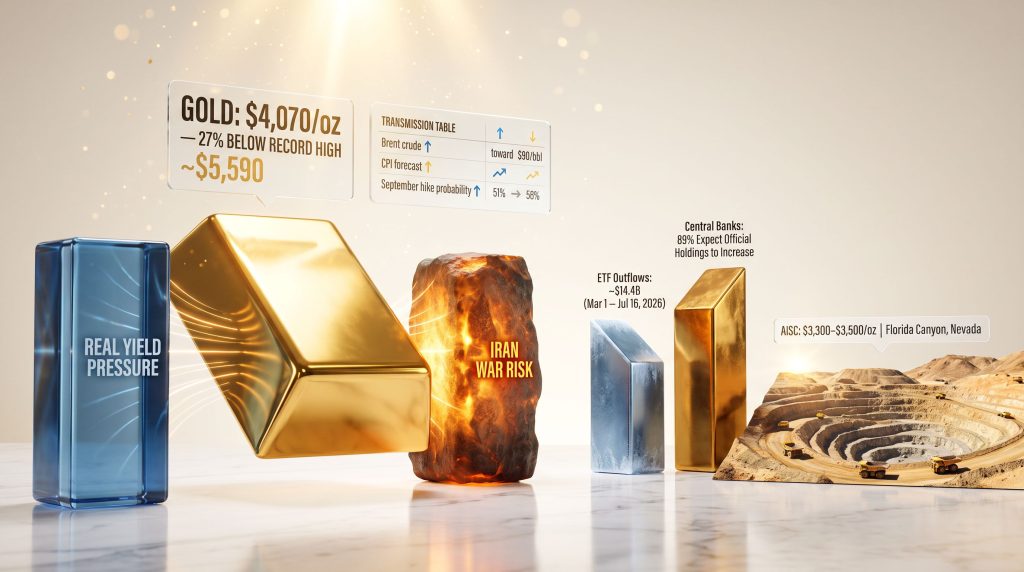
Few asset classes carry as much psychological weight as gold. For centuries, the metal has functioned as the instinctive destination for capital when the world feels unstable, a reflex so deeply embedded in market behaviour that it has become almost axiomatic. Yet in mid-2026, with active military conflict reshaping the Middle East and oil markets lurching toward multi-year highs, gold is doing something unusual: almost nothing. The metal that investors reflexively reach for during times of crisis is sitting roughly 27% below its January 2026 record peak of approximately $5,590 per ounce, trading near $4,070 on July 21, 2026, even as geopolitical tension escalates.
Understanding why gold range-bound despite Iran war risk has become such a pressing question is not simply an exercise in market curiosity. It exposes a fundamental tension at the heart of modern macro investing, where the same catalyst that generates safe-haven demand can simultaneously build the case against the very conditions that make gold attractive.
When big ASX news breaks, our subscribers know first
The Iran Conflict's Contradictory Effect on Gold Pricing
Why the Strait of Hormuz Is Both a Tailwind and a Headwind
After a 60-day ceasefire collapsed on July 8, 2026, Iran resumed targeting commercial vessels in the Strait of Hormuz, triggering a renewed US military response. The consequences for energy markets were immediate. According to Rystad Energy, Houthi threats to Saudi Arabian oil export infrastructure placed approximately 2.5 million barrels per day of crude supply at risk, pushing Brent crude toward $90 per barrel.
Under conventional market logic, this sequence should have produced a meaningful gold rally. Conflict in one of the world's most critical shipping chokepoints historically triggers a rush toward non-sovereign stores of value. However, what happened instead reveals how the macro environment of 2026 has fundamentally altered that transmission mechanism.
Higher oil prices feed directly into headline inflation expectations. Elevated inflation expectations, in turn, reduce the probability of near-term Federal Reserve rate cuts and increase the probability of additional tightening. Higher rates lift real yields, which represent the opportunity cost of holding a non-yielding asset like gold. Furthermore, the result is a self-cancelling loop: the war creates safe-haven demand while simultaneously building the monetary policy case that suppresses it. As the AFR noted, gold's failure to behave like a safe haven in this environment has surprised many market participants. Gold in geopolitical stress scenarios has historically been a reliable driver of bullion demand, yet 2026 has challenged that assumption at its core.
The Oil-Inflation-Rate Transmission Model
The table below maps out how each stage of this transmission affects gold's net price outcome:
| Transmission Stage | Market Variable | Direction | Net Gold Impact |
|---|---|---|---|
| Iran conflict escalation | Brent crude price | Up toward $90/bbl | Initially positive |
| Oil-driven inflation expectations | CPI forecast | Rising | Negative (rate pressure) |
| Fed reaction function repricing | September hike probability | Up from 51% to 55% | Strongly negative |
| Real yield adjustment | 10-year TIPS yield | Rising | Negative (opportunity cost) |
| Net safe-haven demand | Gold spot price | Muted/range-bound | Neutral to negative |
The conclusion is that gold is not ignoring geopolitical risk. It is pricing both the risk and its monetary policy consequences simultaneously, and in the current environment, the latter is winning.
Federal Reserve Policy Repricing: The Dominant Price Driver
Kevin Warsh's Chairmanship and the Shift in Market Expectations
Kevin Warsh assumed the Federal Reserve chairmanship on May 22, 2026, and markets have broadly interpreted his appointment as signalling a more hawkish policy orientation. Ahead of his first major policy meeting on July 28-29, 2026, CME Group data assigned an 85.6% probability to the Fed holding rates steady within the 3.50% to 3.75% target range. That itself was not the market-moving signal.
The more significant development for gold was the movement in forward rate expectations. September rate-hike odds climbed from 51% to 55% in a single trading session, a rapid repricing that had immediate implications for real yields and by extension, gold's opportunity cost calculus.
"Why Real Yields Matter More Than Headlines: Gold produces no income. When real interest rates rise, investors can earn positive, inflation-adjusted returns from government securities without accepting commodity price risk. This makes gold comparatively less attractive at the margin, reducing institutional demand even during periods of genuine geopolitical stress."
This mechanism explains the scale of gold's Q2 2026 correction. The metal fell from approximately $4,700 per ounce at the start of Q2 2026 to roughly $4,015 by quarter-end, a quarterly decline that analysts compared in severity to the 2013 taper tantrum, when gold collapsed following Ben Bernanke's first public suggestion that the Fed might begin tapering its bond-buying programme. Consequently, understanding these gold safe-haven dynamics is essential for investors trying to navigate this unusual macro environment.
Incoming Data as a Real-Time Catalyst
With rate expectations so finely balanced, each economic data release carries outsized market significance. Private payrolls figures, weekly jobless claims, and flash Purchasing Managers' Index readings are all functioning as real-time inputs into the Fed's reaction function, and by extension, into gold's near-term trading range. A string of stronger-than-expected readings would likely validate the hawkish repricing, while any softness in labour market or activity data could prompt a partial reversal that reopens upside for bullion.
Institutional Investor Positioning: The ETF Signal
Outflows, Stabilisation, and Diverging Bank Forecasts
Institutional repositioning has tracked the rate repricing narrative closely. SPDR Gold Shares (GLD), the largest US-listed gold ETF, recorded approximately $14.4 billion in outflows between March 1 and July 16, 2026. The pace of selling moderated into mid-July, with total July outflows running at roughly $46 million alongside a notable mid-July weekly inflow of approximately $447 million, suggesting some early signs of stabilisation at current price levels.
Major bank forecasts have adjusted accordingly, and the driver behind those revisions is instructive:
| Institution | Previous 2026 Year-End Target | Revised Target | Key Revision Driver |
|---|---|---|---|
| Goldman Sachs | $5,400/oz | $4,900/oz | Removal of all remaining 2026 rate cut expectations |
| J.P. Morgan | Not revised | ~$5,000/oz (Q4) | Maintained; reflects rate path uncertainty |
Both institutions framed their outlooks around Federal Reserve expectations rather than any reassessment of geopolitical risk, reinforcing the conclusion that monetary policy, not conflict escalation, is the primary variable institutional analysts are modelling. For additional context on how gold price and mining equities interact during range-bound periods, the relationship between bullion pricing and producer margins is equally instructive.
Central Banks: The Structural Demand That Rate Cycles Cannot Displace
The World Gold Council's 2026 Reserve Survey
While ETF investors and futures traders have reduced exposure in response to rising real yields, central banks have moved emphatically in the opposite direction. The World Gold Council's 2026 Central Bank Gold Reserves Survey, published June 16, 2026, revealed that 89% of reserve managers expect global official-sector gold holdings to increase over the following 12 months. More significantly, a record 45% of reserve managers indicated plans to expand their own institutions' gold reserves, the highest reading ever recorded in the survey's history.
"The Structural vs. Cyclical Split: Central bank gold accumulation is driven by long-term reserve diversification, currency risk management, and sovereign balance sheet objectives. These motivations are largely insensitive to short-term real yield movements, creating a demand base that functions independently of the rate environment."
This is why gold has held support in the high $3,900s to low $4,000s even as hawkish Fed expectations have intensified. It is structural demand acting as a price floor, not speculation. Furthermore, central bank gold demand has been a defining feature of the market since 2022, and 2026 data suggests that trend is accelerating rather than abating. In addition, the broader context of central bank gold reserves confirms that official-sector accumulation is now a structural pillar of the gold market rather than a cyclical phenomenon.
This bifurcation between rate-sensitive cyclical demand and rate-insensitive structural demand is one of the most important and least discussed features of the 2026 gold market. Any material shift toward a more dovish Fed stance could release significant pent-up institutional demand on top of the existing central bank accumulation trend, potentially producing a sharp upside re-rating from current levels.
From Bullion to Balance Sheets: How Mining Producers Are Navigating the Range
Why All-In Sustaining Cost Has Become the Critical Metric
When gold trades within a defined range, the primary driver of free cash flow and equity performance is not the gold price itself but the spread between that price and a producer's all-in sustaining cost (AISC). AISC is the fully loaded cost of producing and maintaining an ounce of gold output, encompassing mine-site operating costs, sustaining capital expenditure, and reclamation provisions. It is the most comprehensive single metric for assessing producer profitability and margin resilience.
In a range-bound gold market, AISC efficiency becomes a more powerful differentiator than gold price leverage. Four producers illustrate four distinct approaches to protecting margin in the current environment.
Integra Resources: When Energy Inflation Hits the Cost Curve Directly
Integra Resources (TSXV: ITR) operates the Florida Canyon heap-leach mine in Nevada, and its 2026 experience provides the clearest direct evidence of how the Iran-driven oil price shock is flowing into producer cost structures. The company's 2026 site-level AISC guidance was revised upward to $3,300 to $3,500 per ounce from a prior range of $2,750 to $2,950 per ounce, a substantial increase driven primarily by higher diesel fuel and explosives costs, both of which are directly linked to crude oil pricing.
George Salamis, President and CEO of Integra Resources, has publicly attributed the cost increase to sector-wide energy inflation rather than company-specific operational issues, noting that elevated fuel and explosives prices are affecting AISC across the gold mining industry.
Despite the near-term cost pressure, an updated feasibility study effective June 25, 2026 increased Florida Canyon's proven and probable reserves by 74% to 1.19 million ounces and extended mine life to eight years. The life-of-mine AISC target remains $2,331 per ounce, meaning the near-term cost spike reflects higher mining volumes and input cost inflation rather than any deterioration in the underlying resource quality.
West Red Lake Gold Mines: Grade as a Margin Lever
West Red Lake Gold Mines (TSXV: WRLG), operator of the restarted Madsen mine in Ontario's Red Lake district, demonstrated in Q2 2026 how operational execution can expand margins independently of gold price movements. Second-quarter production rose 51% to 8,576 ounces, supported by a 23% improvement in average mined grade to 4.3 grams per tonne, mined tonnage growth of 46% to 75,524 tonnes, and a 73% increase in total mined ounces to 10,459 ounces.
These gains reflect access to higher-grade mineralised zones within the Madsen complex. In underground gold mining, grade improvement is one of the most powerful available margin levers because it reduces the cost per recovered ounce without requiring higher throughput or additional capital. Higher grade means more gold from the same volume of rock processed, lowering the denominator of the AISC calculation.
Shane Williams, President and CEO of West Red Lake Gold Mines, has noted that the combination of stronger operational performance and a significantly higher gold price environment compared to the mine's previous operator creates considerably more financial headroom. Furthermore, the prior operator required approximately 4,000 ounces of monthly production to reach breakeven, a threshold the current team operates well below at today's gold price.
Serabi Gold: Debt Elimination as a Rate Environment Hedge
Serabi Gold (LSE: SRB), which operates the Palito and Coringa underground mines in Brazil's Pará state, adopted a different but equally deliberate strategy. The company eliminated its remaining debt in Q1 2026 after repaying its final $5.3 million loan facility, ending the quarter with a cash balance of $64.4 million. In an environment where elevated interest rates increase the cost of external financing, the ability to self-fund growth entirely from internally generated cash flow is a meaningful competitive advantage.
Serabi's three-phase expansion plan targets approximately 100,000 ounces of annual gold production from current guidance of 53,000 to 57,000 ounces, with all capital requirements intended to be met from operating cash flow. Mike Hodgson, CEO of Serabi Gold, has publicly described the company's operating margin in terms of approximately $2,000 per ounce above AISC at current gold prices, which at the guided production range implies potential operating cash generation in the range of $80 million to $100 million for the year.
i-80 Gold: Sacrificing Near-Term Revenue to Protect Future Recovery Rates
i-80 Gold, operating exclusively across Nevada, is pursuing perhaps the most technically nuanced margin protection strategy of the four producers. The company is stockpiling approximately 4,000 recoverable ounces of refractory sulphide ore rather than processing it through third-party facilities at a 55% to 60% payability factor.
The term refractory ore refers to mineralisation where gold is physically encapsulated within sulphide minerals such as pyrite or arsenopyrite. Conventional cyanide leaching cannot efficiently dissolve gold locked in this way, resulting in low recovery rates. The solution is pre-treatment through a process such as pressure oxidation (POX), which breaks down the sulphide matrix and exposes the gold to leaching solutions.
i-80's Lone Tree POX circuit is scheduled for construction commencement in H2 2026, with first gold production targeted for late 2027. The circuit is designed to lift sulphide ore recovery to approximately 92%, compared to the 55-60% payability currently available through third-party processing. By holding ore in stockpile rather than processing it at suboptimal recovery rates, i-80 is deliberately deferring revenue to protect future margins, a capital allocation decision that creates value independent of near-term gold price movements. According to WisdomTree's analysis, the Iran conflict has introduced a new structural catalyst for gold that extends well beyond short-term price volatility.
The next major ASX story will hit our subscribers first
Scenario Pathways: What Could Break Gold Out of Its Range?
The July 28-29 FOMC meeting represents the clearest near-term decision point for gold's directional trajectory. Four scenarios bracket the range of plausible outcomes:
-
Hawkish Fed confirmation: September rate-hike odds rise further; real yields increase; gold tests support in the mid-$3,900s and Goldman Sachs' $4,900 year-end target faces downward pressure.
-
Dovish Fed tone or neutral messaging: September hike expectations recede; gold reclaims the early July high near $4,203, with the 55-day moving average around $4,323 as the next technical target.
-
Sustained Iran ceasefire: Reduced oil price pressure eases inflation expectations; the Fed's reaction function softens; gold may benefit even as direct safe-haven demand fades, because the rate expectation shift outweighs the geopolitical risk reduction.
-
Major conflict escalation: Strait of Hormuz disruption or direct Saudi infrastructure damage pushes oil materially above $90 per barrel; an inflationary shock forces a reassessment of the Fed's path; however, safe-haven demand surges, though the self-reinforcing inflation loop could ultimately limit the net gold upside.
Investors should also monitor the scheduled expiration of the 10% Section 122 tariff around July 24, as any consequent shift in US dollar positioning and cross-asset flows could influence gold's near-term trading range independently of both Iran and the Fed.
Key Takeaways for Gold Investors in H2 2026
The analytical framework that best explains gold's current behaviour is not safe-haven theory. It is a real yield model, modified by structural central bank demand acting as a persistent price floor. Investors who focus exclusively on geopolitical headlines risk systematically misreading the signal that is actually driving prices.
The fact that gold range-bound despite Iran war risk persists is, consequently, one of the clearest demonstrations of how monetary policy has supplanted geopolitics as the primary price driver in 2026. For those evaluating gold mining equities in a range-bound environment, four operational and financial metrics carry the most analytical weight:
- AISC relative to prevailing gold price (margin resilience under current conditions)
- Balance sheet leverage (vulnerability to the high-cost-of-capital environment)
- Grade trajectory (the most powerful cost-reduction lever available to underground operators)
- Processing recovery infrastructure (particularly relevant for assets containing refractory ore)
Until Federal Reserve expectations shift materially in a more accommodative direction, company-specific fundamentals are likely to drive relative equity performance more decisively than movements in the underlying gold price. The July 28-29 FOMC decision is, by that logic, as important to gold equity investors as it is to bullion holders.
This article is intended for informational purposes only and does not constitute financial advice. All forecasts, price targets, and probability estimates cited reflect market data and analyst views as of July 2026 and are subject to change. Investors should conduct their own due diligence before making investment decisions.
Want to Identify the Next Major ASX Gold Discovery Before the Market Moves?
Discovery Alert's proprietary Discovery IQ model delivers real-time alerts on significant ASX mineral discoveries, instantly cutting through the complexity of gold market dynamics to surface actionable opportunities — explore the historic returns major discoveries have generated and begin your 14-day free trial to position yourself ahead of the broader market.