
July 23, 2026
The Hidden Cost of Sitting Out a Precious Metals Correction
Every investor who has lived through a meaningful asset class drawdown knows the feeling intimately: the price falls, uncertainty mounts, and the instinct to wait for clarity before committing fresh capital grows stronger by the day. In precious metals markets, this psychological response has historically been one of the most expensive mistakes a long-term investor can make. Not because the instinct is irrational, but because it fundamentally misframes the decision being made.
A gold and silver market correction strategy is not primarily about price prediction. It is about understanding the difference between a paper market positioning event and a genuine shift in the structural forces that drive long-term demand. When investors confuse the two, they tend to make decisions that optimise for short-term comfort at the direct expense of long-term wealth accumulation.
The 2026 precious metals correction provides a textbook environment for testing this distinction. Both gold and silver have pulled back sharply from January 2026 peaks. Both remain structurally supported by forces that have not changed. And yet the behavioural response from many investors has been the familiar one: wait, watch, and hold fiat currency while the situation becomes clearer.
That waiting position carries its own risk. One that rarely appears in the analysis.
When big ASX news breaks, our subscribers know first
Why the Timing Question Is Structurally the Wrong One to Ask
The framing that dominates investor psychology during corrections is almost always the same: should I buy now, or wait for a lower price? This question feels analytical. In practice, it is a trap built from behavioural biases rather than investment logic.
The primary error embedded in that question is the implicit assumption that the alternative to buying is a neutral, costless position. It is not. Holding fiat currency during a precious metals correction means retaining exposure to the very force that makes gold and silver structurally attractive in the first place: the ongoing erosion of purchasing power through currency debasement.
With U.S. national debt exceeding $39.4 trillion as of July 2026 and annual debt-service costs crossing the $1 trillion threshold, the compounding pressure on the dollar's purchasing power is not a hypothetical future risk. It is an arithmetic reality operating continuously. Every day spent waiting for a lower gold price in fiat currency is a day that fiat currency loses ground to the fiscal forces driving precious metals demand.
A price correction and a structural reversal are two fundamentally different events. The former reflects short-term futures market positioning. The latter requires a genuine shift in the forces driving long-term demand. Evaluating which is occurring demands analysis of mechanism, not price charts alone.
The more useful reframe is to move from when should I buy? to has anything changed in the fundamental thesis? That question has a data-driven answer. The timing question does not.
Diagnosing a Real Correction Versus a Structural Breakdown
Not every price decline is equal. A disciplined gold and silver market correction strategy begins by separating paper market liquidation events from genuine demand destruction. The two look identical on a price chart but represent entirely different investment environments.
Paper liquidation events occur when institutional players are forced to sell futures contracts to cover margin calls arising from losses in unrelated markets. These forced sales can move paper prices sharply in short periods, but they carry no information about changes in the physical supply-demand balance. When the margin pressure clears, prices historically recover.
A structural breakdown, by contrast, requires actual deterioration in the long-term demand drivers: central banks reversing their accumulation, fiscal deficits narrowing materially, or industrial demand falling permanently. None of those conditions are present in mid-2026. Furthermore, analysts expect consolidation rather than structural reversal following recent record rallies.
The diagnostic checklist for any correction period should address three questions:
- Are the demand drivers that originally justified the position still intact?
- Has the physical supply-demand balance changed, or only the paper price?
- Are the buyers who drove the preceding move still active in the market?
If the answers to all three are favourable, the thesis has not changed. Only the price has.
What the 2026 Numbers Actually Show
| Metal | All-Time High (Jan 2026) | Price at Correction Low | Drawdown % |
|---|---|---|---|
| Gold | $5,589.38 | ~$4,135 | ~26% |
| Silver | $121.64 | ~$59.87 | ~51% |
Source: GoldSilver.com price charts, as of July 22, 2026
Silver's correction is roughly twice the magnitude of gold's on a percentage basis. This is not unusual. Silver operates as both a monetary metal and an industrial commodity, and its market is significantly smaller than gold's by total value. That combination produces characteristically higher volatility in both directions.
A deeper correction from a silver all-time high does not automatically indicate a weaker structural case. Historically, it has often indicated the opposite: more compressed valuations, greater potential recovery leverage, and stronger relative value against gold as measured by the gold-silver ratio analysis.
For context, silver's 2026 drawdown is severe but not without precedent. The metal declined approximately 50% from its 2011 peak during the subsequent consolidation phase. In 2008, both metals fell sharply during the global financial crisis before recovering to new highs. In 2020, silver declined nearly 35% in a matter of weeks before staging a powerful recovery. In each case, the paper price corrected while the physical fundamentals remained intact.
Three Structural Pillars Supporting the Gold Thesis
Central Bank Accumulation at Historically Elevated Rates
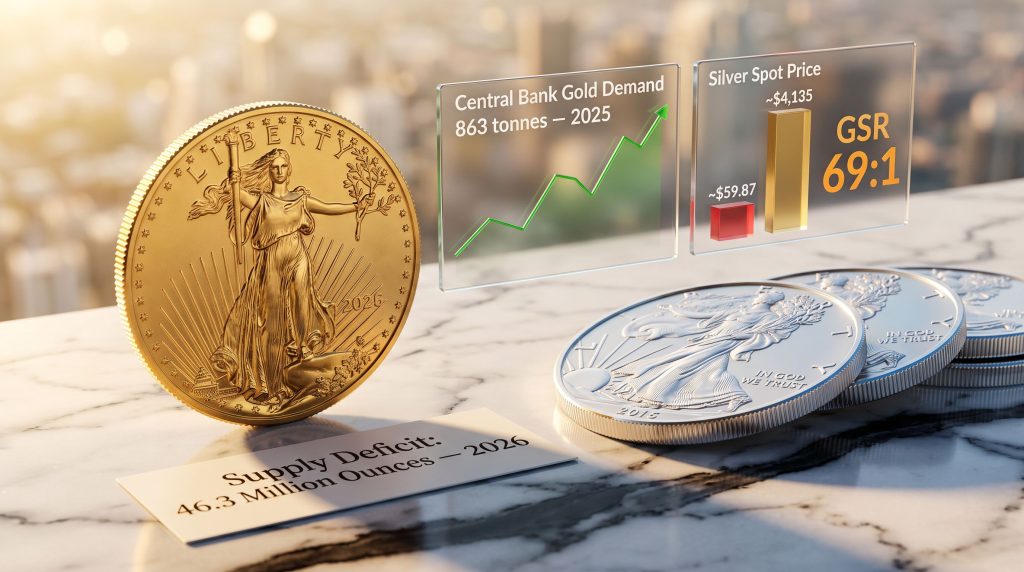
The most consequential structural development in the gold market over the past several years has been the shift in central bank behaviour. Central bank gold demand reached 863 tonnes in 2025, according to the World Gold Council. That figure is nearly double the 2010-2021 annual average of 473 tonnes. The 2022 calendar year recorded the highest single-year purchase volume since 1950, at 1,136 tonnes (World Gold Council).
Twenty-two individual central banks each added at least one tonne to their gold reserves in 2025 alone. The motivation behind this accumulation is strategic rather than speculative. The 2022 decision to freeze Russia's dollar-denominated foreign reserves accelerated a structural reassessment among emerging market central banks about the risks of holding reserve assets that can be frozen or defaulted upon by a counterparty.
Gold cannot be frozen. It carries no counterparty risk. That reality has not changed because the paper price has pulled back. By late 2025, gold had surpassed U.S. Treasuries as the world's largest reserve asset by value, according to the World Gold Council's Gold Demand Trends Full Year 2025 report. Central banks that have spent years building these positions do not exit on a 10% or even a 26% price correction. Their accumulation horizon is measured in decades.
U.S. Fiscal Trajectory as a Hard Asset Catalyst
The structural fiscal argument for gold has strengthened consistently as U.S. debt levels have risen. The mechanics are straightforward: as debt expands faster than the productive economy can service it, the long-term pressure to monetise that debt through currency creation increases. Assets that cannot be created on demand, and that carry no default risk, become structurally more attractive against that backdrop.
With U.S. national debt above $39.4 trillion and annual interest expenses exceeding $1 trillion, the fiscal math is not moving in a direction that reduces gold's long-run relevance. These are not projections. They are current figures drawn from U.S. Treasury Fiscal Data as of July 2026. Gold's safe-haven role becomes increasingly relevant precisely in these conditions.
Paper Market Mechanics: Understanding Futures Liquidations
One of the least appreciated dynamics in precious metals corrections is the role played by futures market mechanics. When institutional investors face margin calls in unrelated markets, they frequently liquidate liquid assets to raise cash. Gold futures are among the most liquid instruments available.
A forced liquidation wave in gold futures can move the paper price sharply in a short timeframe, even when nothing has changed in the physical supply-demand balance. These events are temporary by nature. Once the margin pressure clears and forced selling exhausts itself, prices historically recover toward levels supported by physical fundamentals. Investors who understand this mechanism view sharp futures-driven declines very differently from investors who interpret every price move as new information about intrinsic value.
Silver's Supply Problem Is More Severe Than Most Investors Appreciate
Six Consecutive Years of Structural Deficit
The silver supply deficits are entering their sixth consecutive year of structural shortfall in 2026. According to the Silver Institute's World Silver Survey 2026, global demand is projected to exceed total supply by 46.3 million ounces this year. The 2025 deficit was 40.3 million ounces, representing the fifth consecutive annual shortfall.
The cumulative drawdown from above-ground silver inventories since 2021 has reached approximately 762 million ounces (Silver Institute, World Silver Survey 2026). To put that number in perspective: global mine production runs roughly 820 to 850 million ounces annually. In five years, the market has consumed nearly the equivalent of one full year of total global mine output from existing above-ground stockpiles.
Scale Perspective: Five consecutive years of supply deficits have drawn down above-ground silver inventories by approximately 762 million ounces, nearly equivalent to an entire year of global mine production. Physical inventories are materially tighter today than at the start of this cycle. (Silver Institute, World Silver Survey 2026)
Why Silver Production Cannot Respond Quickly to Price Signals
This is one of the least commonly understood dynamics in the silver market. Approximately 70% of global silver production is extracted as a byproduct of lead, zinc, copper, and gold mining operations (Silver Institute). Silver is not the primary economic target of those mining operations. Production decisions are made based on the economics of the primary metal, not silver.
This creates a fundamental production inelasticity that distinguishes silver from most other commodities. When silver prices rise, primary metal miners do not automatically increase output to capture silver revenues. A silver price spike cannot trigger a meaningful supply response on its own. This structural asymmetry means demand can accelerate rapidly while supply remains constrained, creating the conditions for persistent deficit.
Industrial Demand: The Price-Insensitive Foundation
Silver's industrial demand base provides a structural floor that is largely independent of investor sentiment. Solar photovoltaic manufacturing accounted for approximately 29% of all industrial silver demand in 2024, according to the Silver Institute and Oxford Economics research published in December 2025. Additional demand vectors include electric vehicles, data centre infrastructure, semiconductor manufacturing, and grid modernisation programmes.
Total industrial applications represent approximately 58% of global silver demand (Silver Institute, World Silver Survey 2026). This is a critical distinction: the majority of silver demand comes from buyers who need the metal regardless of its price. A solar panel manufacturer requiring silver paste to conduct electricity does not reduce its purchasing because spot silver is at $90 rather than $60. The demand is largely price-insensitive over the medium term.
| Demand Category | Share of Total Silver Demand |
|---|---|
| Industrial (total) | ~58% |
| Solar PV (subset of industrial) | ~29% of industrial demand |
| Investment and jewellery | ~42% |
Source: Silver Institute, World Silver Survey 2026; Oxford Economics, December 2025
Using the Gold-Silver Ratio as a Strategic Allocation Compass
How the GSR Works and What It Signals Today
The gold-silver ratio (GSR) is calculated by dividing the gold spot price by the silver spot price. The result represents how many ounces of silver are required to purchase one ounce of gold at prevailing market prices. As of July 22, 2026, with gold trading near $4,135 and silver near $59.87, the GSR sits at approximately 69:1.
The 50-year post-gold-standard average for the GSR is approximately 65:1. When the ratio trades above that long-run average, silver is historically undervalued relative to gold. When it compresses below, silver has outperformed and gold represents relatively better value on a historical basis. According to BlackRock's insights on gold and silver volatility, these ratio dynamics are well-recognised among institutional investors when assessing relative precious metals value.
| Market Event | GSR Reading | Signal |
|---|---|---|
| COVID-19 dislocation (March 2020) | ~127:1 | Maximum silver undervaluation |
| Iran conflict peak | ~90:1 | Elevated silver undervaluation |
| 50-year post-1971 average | ~65:1 | Neutral baseline |
| Prior bull cycle compression low | ~55:1 | Silver historically expensive vs. gold |
| Current (July 2026) | ~69:1 | Silver moderately undervalued |
Sources: GoldSilver.com price charts; Silver Institute; historical market data
The current reading of 69:1 places silver in the moderately undervalued zone relative to gold. It is not at the extreme readings of 90:1 or 127:1 that have historically signalled maximum silver undervaluation, but it sits above the long-run average in a position that has historically preceded silver outperformance relative to gold.
A Practical GSR-Guided Allocation Framework
- GSR above 65:1 (current condition): Prioritise silver accumulation within the overall metals allocation; silver is historically cheap relative to gold
- GSR between 55:1 and 65:1: Maintain balanced allocation; neither metal is significantly mispriced relative to the other
- GSR below 55:1: Consider rotating a portion of silver holdings back into gold, accumulating more ounces of the yellow metal at a relatively lower cost
Investors who shifted toward silver during the March 2020 peak of 127:1 and rebalanced toward gold when the ratio compressed toward 55-60:1 captured significant additional ounce accumulation across that cycle. Importantly, GSR-guided allocation is not market timing. It is systematic rebalancing based on a six-decade valuation signal that reflects relative pricing, not absolute price prediction.
The next major ASX story will hit our subscribers first
Dollar-Cost Averaging: The Mechanical Solution to the Timing Problem
How DCA Works in Practice
Dollar-cost averaging removes the timing problem from the investment decision entirely. The principle is straightforward:
- Commit a fixed dollar amount to physical metals purchases on a predetermined schedule, most commonly monthly
- Execute each purchase regardless of the current spot price
- Allow the arithmetic to work: lower prices automatically produce more physical weight per dollar allocated
- Maintain the schedule consistently through periods of volatility without attempting to identify a precise bottom
Illustrative DCA Scenario: $500 Monthly Silver Allocation
| Month | Silver Spot Price | Ounces Purchased |
|---|---|---|
| Month 1 | $70.00 | 7.14 oz |
| Month 2 | $60.00 | 8.33 oz |
| Month 3 | $50.00 | 10.00 oz |
| Month 4 | $55.00 | 9.09 oz |
| Total | Avg ~$58.75 | 34.56 oz |
The resulting cost basis reflects the cycle average rather than any single price point, without requiring a single accurate bottom call. This structure converts volatility from a source of anxiety into a mathematical advantage.
The Physical Premium Problem: Why Spot Price Is Not the Full Story
One dimension of physical precious metals accumulation that many investors overlook is the relationship between paper spot prices and physical dealer premiums. The spot price reflects the pricing of paper contracts traded on futures exchanges, not the cost of acquiring physical metal in your hand or in a vault.
Physical price equals spot price plus the dealer premium, which encompasses minting costs, distribution, inventory carrying costs, and dealer margin. During periods of high demand or constrained supply, premiums can widen dramatically even as the paper spot price falls. Decisions around physical gold vs ETFs hinge partly on understanding these premium dynamics.
Key Insight: An investor waiting for paper gold to reach a specific price target may find that physical supply is constrained and premiums are significantly elevated at precisely that moment. A lower spot price with a wide premium can offer no real cost advantage over a higher spot price with a tighter premium. Monitoring both metrics is an essential component of disciplined accumulation strategy.
Selecting the Right Physical Products During a Correction
Gold Bullion: Liquidity and Authenticity First
Recommended gold products for correction-period accumulation:
- American Gold Eagle (1 oz): U.S. Mint issued, legal tender status, widest dealer recognition in the U.S. retail market, consistently tight bid-ask spreads for retail-size purchases
- American Gold Buffalo (1 oz): .9999 fine gold, U.S. Mint issued, strong nationwide liquidity, universally verifiable authenticity without third-party assay
Silver Bullion: Divisibility and Practical Flexibility
Recommended silver products for correction-period accumulation:
- American Silver Eagle (1 oz): The highest-liquidity retail silver product in the U.S. market, instantly recognisable, government-minted and universally accepted by dealers
- Pre-1965 U.S. 90% silver coins (junk silver): Dimes, quarters, and half-dollars containing 90% silver by composition; typically carry lower premiums per ounce than modern bullion coins; highly divisible for smaller practical transactions; verifiable government authenticity without requiring assay
Portfolio Allocation Benchmarks
A frequently referenced framework allocates 5 to 15% of a diversified portfolio to combined precious metals exposure. Within that metals allocation:
- Conservative starting point: 60-70% gold by value, 30-40% silver by value
- GSR-adjusted tilt: With the GSR currently above 65:1, the analytical case for increasing the silver share within the allocation is stronger than it would be at a neutral or below-average ratio
- Risk tolerance consideration: Silver requires meaningfully greater price swing tolerance than gold given its characteristically higher volatility
Tax Implications: What Every Precious Metals Investor Needs to Know
IRS Classification and Capital Gains Treatment
The IRS classifies physical gold and silver bullion as collectibles. This classification has meaningful tax consequences:
- Long-term capital gains (positions held more than one year): subject to a maximum rate of 28%, which is a ceiling rather than a flat rate (IRS Topic No. 409)
- Short-term gains (positions held one year or less): taxed as ordinary income at the investor's applicable marginal tax rate
GSR-based rotation strategies require careful tax planning. Rotating from silver into gold when the ratio compresses may trigger a taxable event that reduces the net benefit of the rebalancing exercise. Self-directed IRAs that permit physical bullion holdings allow rotation between metals without triggering an immediate tax consequence.
- Traditional self-directed IRA: gains are deferred until withdrawal
- Roth self-directed IRA: gains are potentially tax-free on qualified distributions, eliminating the 28% collectibles rate entirely for eligible investors
State Sales Tax Considerations
Many U.S. states exempt physical precious metals purchases from state sales tax when transaction totals exceed defined thresholds, commonly in the $1,000 to $1,500 range. Structuring purchases to clear applicable state thresholds where relevant reduces the effective all-in cost of accumulation and improves the net position from the first purchase.
A Five-Step Decision Framework for the Current Correction
Step 1: Validate the thesis, not the price
- Are central banks still accumulating gold at historically elevated rates? Yes: 863 tonnes in 2025 (World Gold Council)
- Is silver's physical supply deficit still widening? Yes: 46.3 million ounce projected shortfall in 2026 (Silver Institute)
- Is the U.S. fiscal trajectory still structurally supportive of hard assets? Yes: $39.4 trillion in national debt with $1 trillion+ in annual interest expense
If all three answers remain affirmative, the correction is a positioning event, not a thesis event.
Step 2: Assess your current allocation relative to targets
| Current Position | Recommended Action |
|---|---|
| Metals below target allocation | Add in tranches via DCA schedule |
| Metals at target allocation | Hold; rebalance if weights drift materially |
| Metals above target allocation | Trim toward target; avoid averaging down blindly |
| No existing position | Initiate DCA; establish gold before adding silver |
Step 3: Read the GSR before deciding between metals
- GSR above 65:1: favour silver additions within the metals allocation
- GSR below 65:1: favour gold additions; silver has likely outperformed
Step 4: Check physical premium conditions before executing
- Wide premiums during volatility spikes can eliminate the price advantage of a lower spot price
- Compare the all-in physical price across products before committing
Step 5: Assess tax position before any rotation
- Determine whether a planned rotation triggers a taxable event
- Favour execution inside a tax-advantaged account where possible to preserve the full benefit of the rebalancing
Frequently Asked Questions
Does a 50% silver correction mean the structural bull market has ended?
Not on its own. Silver is structurally more volatile than gold due to its smaller market size and dual industrial-monetary role. A 51% drawdown from an all-time high is significant, but the relevant diagnostic is whether the underlying supply-demand fundamentals have deteriorated, not the magnitude of the price move. Six consecutive years of supply deficit, structurally inelastic production, and growing industrial demand represent conditions that a paper market correction does not erase.
What would actually end the structural bull market in gold and silver?
A genuine structural reversal would require central banks to become net sellers of gold at scale, the U.S. fiscal deficit to narrow materially and on a sustained basis, and silver's industrial supply deficit to close through a significant production response. None of those conditions is present as of mid-2026. Distinguishing a cyclical price correction from a structural trend reversal is the most important analytical discipline for a long-term gold and silver market correction strategy.
Is it better to buy gold or silver first during a correction?
Most allocation frameworks recommend establishing or reinforcing a gold position first, given gold's lower volatility and its role as the more stable monetary anchor in a metals portfolio. Silver additions make stronger analytical sense when the gold-silver ratio is elevated above its long-run average, indicating silver is historically inexpensive relative to gold, and when the investor has sufficient risk tolerance to absorb silver's characteristically larger price swings and potentially longer recovery timelines. However, recent sell-off dynamics in both metals have created compelling entry conditions that are worth assessing carefully.
Can I hold physical gold and silver in an IRA?
Yes. A self-directed IRA can hold physical gold and silver bullion meeting IRS fineness standards. American Gold Eagles and American Silver Eagles both qualify under those standards. The metal must be held by an IRS-approved custodian. The tax advantage is substantial: gains inside a Traditional self-directed IRA are deferred until withdrawal, while gains inside a Roth self-directed IRA may be tax-free on qualified distributions, avoiding the 28% collectibles capital gains rate that applies to taxable accounts.
Disclaimer: This article is for informational and educational purposes only and does not constitute financial or investment advice. All investments, including precious metals, involve risk and may result in partial or total loss. Past performance is not a guarantee of future results. Consult a qualified financial adviser before making any investment decisions.
Want to Know When the Next Major Mineral Discovery Hits the ASX?
While precious metals corrections demand careful strategy, the real wealth-building opportunities often emerge from significant new mineral discoveries — and timing is everything. Discovery Alert's proprietary Discovery IQ model scans ASX announcements in real time, delivering instant alerts on high-potential discoveries across gold, silver, and more than 30 other commodities, so subscribers can act before the broader market reacts. Explore historic discoveries and their returns to see what's possible, then begin a 14-day free trial at Discovery Alert to secure your market-leading edge.