August 5, 2026
The Counterintuitive Response: When Geopolitical Fear Pushes Gold Lower
Most investors operate on a simple mental model: when the world becomes more dangerous, gold goes up. Wars, sanctions, supply shocks, and military escalations are supposed to drive capital into the yellow metal as a refuge from uncertainty. However, commodity markets are rarely that tidy, and July 2026 offered a sharp reminder of why that assumption can fail at precisely the moment it feels most intuitive.
As fears intensified around the Strait of Hormuz and crude oil staged a dramatic single-session surge, gold did the opposite of what conventional safe-haven logic would predict. Rather than climbing alongside oil, the precious metal sold off sharply, dragging silver, platinum, and palladium down with it. Understanding why gold slides as Strait of Hormuz closure fears surge oil prices requires looking past surface-level narratives and into the deeper mechanics of how energy shocks interact with monetary policy, real yields, and cross-asset capital flows.
When big ASX news breaks, our subscribers know first
What Is the Strait of Hormuz and Why Does It Command Global Commodity Markets?
The Strait of Hormuz is a narrow maritime corridor connecting the Persian Gulf to the Gulf of Oman, functioning as the single most critical energy chokepoint on the planet. An estimated 20 to 25% of all globally traded oil flows through this passage, along with significant volumes of liquefied natural gas. No other maritime route carries this concentration of energy supply, which is precisely why any credible disruption reverberates across every major asset class simultaneously.
The strategic logic of the chokepoint is straightforward: nations or non-state actors with the capacity to threaten this passage effectively hold leverage over global energy pricing, inflation dynamics, and by extension, central bank policy paths in economies as far removed as the United States, Japan, and the European Union.
Strait of Hormuz: Market Impact Snapshot (July 2026)
| Metric | Data Point |
|---|---|
| Share of Global Oil Trade | 20–25% |
| Brent Crude Price Level (July 2026) | ~$110–$111 per barrel |
| Single-Session Oil Price Surge | ~4% |
| Estimated Duration of Disruption | ~8 weeks by July 2026 |
| Recessionary Oil Price Threshold | ~$150 per barrel |
What differentiates the 2026 disruption from previous Hormuz tension episodes is its duration and the military escalation underpinning it. U.S. and Iranian forces exchanged heavy missile and drone strikes, with Tehran directly targeting U.S. facilities across Gulf states and announcing the closure of the strait. Prior Hormuz crises tended to be brief, threat-driven events that resolved before supply disruptions became structural. By mid-July 2026, the situation had persisted long enough to shift market participants from pricing in tail risk to pricing in baseline disruption.
Historical Comparison: Hormuz Threats vs. Actual Market Dislocations
| Episode | Duration | Oil Price Impact | Gold Reaction |
|---|---|---|---|
| 2011–2012 Iran Nuclear Tensions | Months | Brent above $125/bbl | Moved higher initially |
| 2019 Tanker Attacks | Weeks | Modest spike (~3–5%) | Brief safe-haven lift |
| 2026 U.S.-Iran Military Exchange | 8+ weeks (ongoing) | ~4% surge, sustained | Declined 1.5% |
The 2026 episode stands apart because it arrived during an environment already characterised by elevated inflation concerns, an active rate-hiking cycle, and a Federal Reserve that had signalled willingness to prioritise price stability over growth protection. Furthermore, the gold-bond relationship during this period highlighted how fixed-income repricing was amplifying downward pressure on the precious metal.
Precious Metals on July 14, 2026: A Broad Selloff Across the Complex
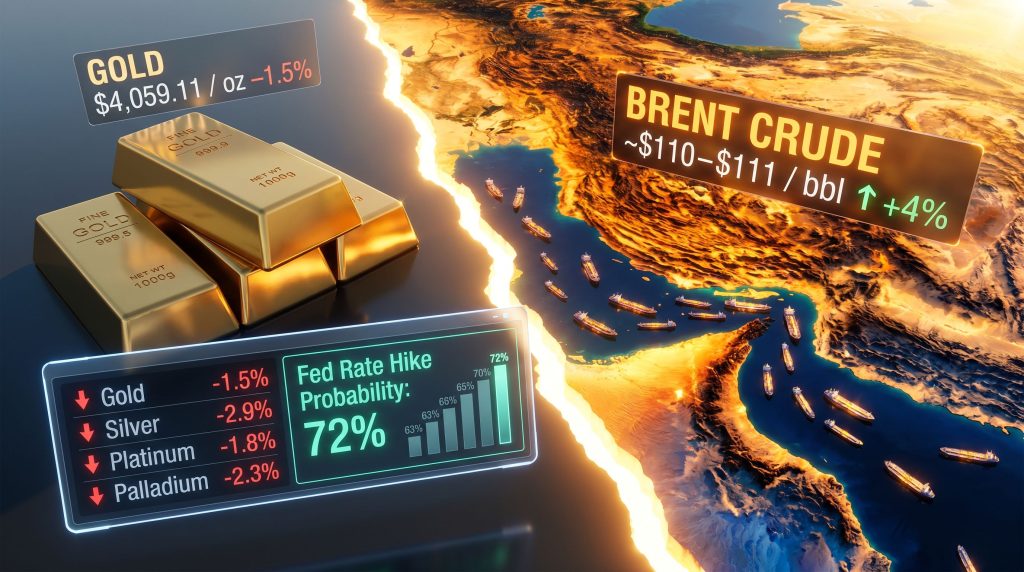
The trading session on July 14, 2026 produced a synchronised decline across the entire precious metals market. Spot gold fell 1.5% to $4,059.11 per ounce, while U.S. gold futures for August delivery dropped 1.1% to $4,067.10. The weakness extended well beyond gold itself. According to Reuters reporting on TradingView, the session represented one of the more significant single-day precious metals declines of the year.
Precious Metals Price Movements: July 14, 2026
| Metal | Price Change | Closing Level |
|---|---|---|
| Gold (Spot) | -1.5% | $4,059.11/oz |
| Gold (Futures – August) | -1.1% | $4,067.10 |
| Silver | -2.9% | $58.14/oz |
| Platinum | -1.8% | $1,598.48/oz |
| Palladium | -2.3% | $1,247.27/oz |
Silver's decline of 2.9% was notably steeper than gold's, which reflects the metal's dual exposure to both monetary dynamics and industrial demand. Silver's industrial consumption accounts for more than half of annual demand globally, meaning that fears of economic slowdown compound its sensitivity to the same rate-expectation pressures affecting gold. Platinum and palladium, which carry significant exposure to automotive manufacturing demand, similarly declined as growth concerns crept into market pricing.
The synchronised nature of the selloff indicates that this was not a metal-specific liquidity event but a broad repricing of the precious metals complex driven by a common macro variable: the expectation that rising oil prices would force the Federal Reserve to maintain or accelerate its tightening posture.
The Inflation-Rate-Gold Triangle: Why Energy Shocks Can Be Bearish for Precious Metals
The mechanism through which an oil price shock can suppress gold is not immediately obvious, but it follows a traceable logic chain that experienced macro investors recognise well. In addition, understanding gold safe-haven dynamics helps clarify why the metal sometimes fails to behave as a traditional refuge during certain types of crisis.
How an Oil Shock Transmits Into Gold Weakness
- Oil prices surge on supply disruption fears, in this case driven by Strait of Hormuz closure risk.
- Energy-driven inflation expectations accelerate, as oil is embedded across transportation, manufacturing, and food production costs.
- Central banks signal tighter monetary policy, prioritising inflation control over economic support.
- Real interest rates rise, increasing the opportunity cost of holding non-yielding assets like gold.
- Rate-sensitive capital rotates out of gold and into interest-bearing instruments including Treasuries and cash equivalents.
- Gold pricing adjusts downward as the rate premium thesis overwhelms the fear premium.
Gold's safe-haven bid activates most powerfully when geopolitical risk translates into a flight toward capital preservation and liquidity. When that same geopolitical risk instead generates inflationary monetary policy responses, the rate dynamic can override the fear premium entirely. The Strait of Hormuz scenario in July 2026 is a textbook case of the latter.
This framework explains why gold and oil, which are often assumed to move together during crises, can diverge dramatically when monetary policy is the operative transmission mechanism. The key variable is not the nature of the shock itself, but how that shock is interpreted by central banks and rate markets. Consequently, the interplay between gold and bonds becomes especially critical during episodes where inflation expectations are rapidly repriced.
Federal Reserve Rate Expectations: The Single Most Important Variable for Gold
At the core of gold's July 2026 weakness was a sharp repricing of Federal Reserve rate hike probabilities. According to CME FedWatch data, traders moved the probability of a September rate hike from approximately 63% the prior week to 72% on July 14, a shift of nine percentage points driven almost entirely by the oil-induced inflation signal.
CME FedWatch Probability Shift
| Timeframe | September Hike Probability |
|---|---|
| Prior Week | ~63% |
| July 14, 2026 | ~72% |
| Net Change | +9 percentage points |
This shift carries direct implications for gold. Real yields, which represent the return on Treasury instruments after adjusting for inflation expectations, are the single most reliable short-term driver of gold pricing. When real yields rise, the cost of holding gold relative to bonds increases, and institutional capital tends to rebalance accordingly.
Adding further pressure to gold's near-term outlook, Federal Reserve Chair Kevin Warsh was scheduled to deliver his first semiannual Congressional testimony that week. A dense calendar of U.S. economic data including June CPI, PPI, and retail sales figures was also anticipated. Commentary from Vice Chair Michelle Bowman and Governor Christopher Waller was closely watched for signals about how the Fed was interpreting the inflationary implications of sustained Middle East escalation.
Why Dollar Strength Compounded Gold's Weakness
Alongside rising yields, the U.S. dollar climbed during the session, adding a second layer of pressure on gold. Because gold is priced globally in dollars, a stronger greenback makes the metal more expensive for holders of other currencies, suppressing demand at the margin. The simultaneous rise in the dollar and Treasury yields created a dual headwind that amplified the session's losses across precious metals.
Cross-Asset Behaviour During the July 2026 Hormuz Shock
The July 14 session illustrated how a single geopolitical trigger can produce dramatically different responses across asset classes depending on their underlying sensitivities.
| Asset Class | Typical Hormuz Reaction | July 2026 Behaviour |
|---|---|---|
| Crude Oil (Brent) | Sharp spike | +~4%, ~$110–$111/bbl |
| U.S. Dollar | Strengthens on safe-haven flows | Climbed |
| U.S. Treasury Yields | Rise on inflation expectations | Rose |
| Asian Equity Markets | Weaken on growth concerns | Declined broadly |
| Gold | Context-dependent | -1.5% (rate fears dominated) |
| Silver / Platinum / Palladium | Typically follow gold | Declined 1.8%–2.9% |
Asian equity markets slipping broadly was notable as a leading indicator of deteriorating global risk appetite. Equity weakness in Asia often precedes similar moves in European and U.S. markets, suggesting that growth concerns were beginning to overlay the initial inflationary impulse from higher oil prices. Furthermore, central bank influence on gold pricing was clearly visible in how quickly rate expectations transmitted into precious metals positioning.
The next major ASX story will hit our subscribers first
Could a Prolonged Closure Eventually Become Bullish for Gold?
One of the more nuanced analytical questions emerging from this episode is whether a sustained Hormuz closure might ultimately reverse gold's weakness through a very different mechanism: demand destruction.
Market commentary has raised the possibility that if oil prices remain elevated long enough to meaningfully constrain global economic activity, the resulting slowdown could suppress aggregate demand to the point where inflationary pressures actually decline. In that scenario, central banks might face a very different policy calculus, one that favours easing rather than tightening. Consequently, the pressure on gold from rising rate expectations could reverse sharply.
Two Divergent Scenarios for Gold Investors
Scenario A: Sustained Closure Triggering Recessionary Conditions
- Oil approaches $150 per barrel
- Global demand contracts sharply
- Inflation peaks and then collapses as economic activity falls
- Central banks pivot toward easing
- Real yields decline, gold recovers its safe-haven bid
Scenario B: Partial Reopening With Persistent Inflation
- Oil stabilises between $100 and $115 per barrel
- Inflation remains elevated but does not force a recession
- Fed maintains higher-for-longer rate stance
- Gold remains range-bound or under moderate pressure
- Precious metals complex stays weak in aggregate
The $150 per barrel threshold is significant because historically, oil at that level has been associated with meaningful demand destruction and recessionary conditions in import-dependent economies. However, the relationship between recession and gold prices is rarely linear, and the path to any gold recovery through this channel would likely be volatile and uneven.
It is important to note that these scenarios represent analytical frameworks, not predictions. Commodity markets, particularly those exposed to geopolitical variables, carry substantial uncertainty, and investors should not treat either scenario as a probable outcome without conducting their own due diligence.
What the Gold-Oil Divergence Signals About 2026 Market Conditions
The session of July 14, 2026 encapsulates a broader truth about how mature market participants are currently pricing geopolitical risk. Rather than applying a blanket safe-haven premium to gold whenever conflict erupts, institutional capital is making rapid, granular assessments about how specific types of risk transmit through inflation, central bank behaviour, and real yield curves.
This represents a more sophisticated market environment than existed in prior cycles, where gold's safe-haven premium was more reflexive and less conditional. Investors watching gold in this environment need to monitor rate expectations as closely as they monitor geopolitical headlines, because in a world where central bank credibility is anchored to inflation control, the policy response to a supply shock can matter more than the shock itself. For instance, analysis from Investing.com on gold bearish pressure reinforces how rising oil prices in this environment sustained downward momentum rather than triggering any traditional safe-haven relief.
The $4,059 spot price level may represent a technically meaningful support zone if liquidity pressures ease and rate repricing stabilises. However, any recovery in gold's near-term outlook will likely depend less on the situation in the Gulf and more on what incoming U.S. inflation data communicates to the Federal Reserve about the pace of its policy path. Notably, gold slides as Strait of Hormuz closure fears surge oil prices serves as a reminder that in the current macro regime, the commodity complex and the monetary policy complex are deeply intertwined.
FAQ: Gold, Oil, and the Strait of Hormuz
Why did gold fall when oil prices surged on July 14, 2026?
Rising oil prices intensified inflation expectations, which caused traders to increase the probability of Federal Reserve rate hikes. Higher anticipated rates raise the opportunity cost of holding non-yielding gold, prompting capital rotation out of precious metals and into interest-bearing assets.
What share of global oil trade passes through the Strait of Hormuz?
Approximately 20 to 25% of globally traded oil flows through the strait, making it the world's most consequential energy chokepoint. Disruption to this passage has direct and immediate implications for global inflation dynamics.
How high could oil go if the strait remains effectively closed?
Analysts have modelled scenarios where a sustained closure pushes Brent crude toward $150 per barrel, a level historically linked to demand destruction and recessionary conditions in energy-importing economies.
Could prolonged disruption eventually support gold?
Yes, under a demand destruction scenario. If sustained high oil prices trigger a deep economic slowdown that causes inflation to fall, central banks could pivot toward easing, reducing real yields and reigniting gold's safe-haven appeal.
Why did silver fall more than gold in this session?
Silver carries both monetary sensitivity and significant industrial demand exposure. The combination of rate-expectation pressure and fears of economic slowdown affecting industrial output made silver more vulnerable than gold in this specific trading environment.
What economic data should gold investors monitor in the near term?
Key releases include June CPI, PPI, and retail sales data. Federal Reserve Chair Kevin Warsh's Congressional testimony and remarks from Vice Chair Michelle Bowman and Governor Christopher Waller are also critical inputs for assessing the near-term rate path and its implications for precious metals pricing.
Want to Stay Ahead of the Next Major Precious Metals Market Move?
Discovery Alert's proprietary Discovery IQ model delivers real-time alerts on significant ASX mineral discoveries the moment they hit the market, cutting through the macro noise to surface actionable opportunities — explore historic discoveries and the returns they generated, then begin your 14-day free trial to position yourself ahead of the broader market.