
July 20, 2026
The Cognitive Trap That Costs Precious Metals Investors the Most
There is a well-documented pattern in financial markets where investors respond to institutional forecast revisions in a way that is almost precisely wrong. When a major bank publishes a number reduction, the instinct is to treat it as uniformly negative. Sell the news. Reduce exposure. Wait for clarity. This behavioural reflex, sometimes called anchoring bias, causes investors to fixate on the single figure that changed while ignoring the broader architecture of signals that remained intact.
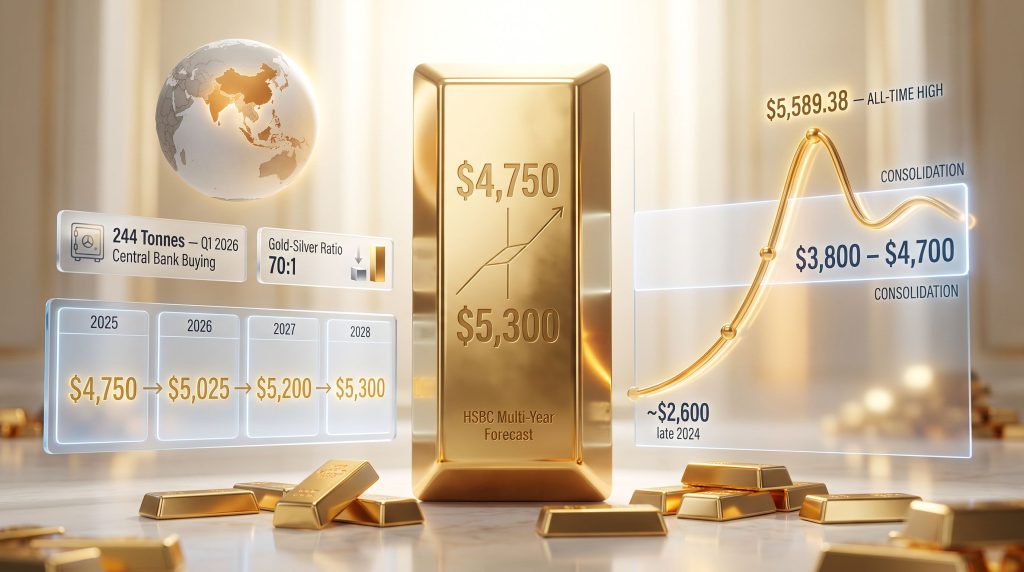
The HSBC gold price forecast $4,750 by year-end revision, published on 9 July 2026, is a textbook example of this dynamic. HSBC's Chief Precious Metals Analyst James Steel reduced the bank's 2026 full-year average gold estimate from $4,864/oz to $4,560/oz, a downward revision of $304. That number made headlines. What did not make comparable headlines is that HSBC simultaneously left its year-end 2026 target unchanged at $4,750/oz, and left every single long-dated forecast from 2027 through 2029 untouched.
For investors who understand what each of those figures actually measures, the two readings are not contradictory. For investors who do not, the revision looked like a retreat.
When big ASX news breaks, our subscribers know first
Full-Year Average vs. Year-End Target: Why the Distinction Changes Everything
These two metrics are not interchangeable, and most market commentary treated them as if they were.
A full-year average price represents the mean of daily gold prices across all 365 days of the calendar year. It is backward-looking by construction, heavily influenced by whatever prices existed in January through June. When gold spent much of the first half of 2026 correcting from its January all-time high of $5,589.38, a lower full-year average was arithmetically inevitable. The revised $4,560 figure is largely a reflection of realised price history, not a forecast about direction.
A year-end target is a directional conviction statement about where price will be at a specific future moment. HSBC held that figure at $4,750, unchanged.
Critical distinction: A lower full-year average combined with an unchanged year-end target means HSBC believes gold spent more time at lower levels during H1 2026 than previously modelled, but that the destination remains the same. This is a path recalibration, not a thesis reversal.
At gold's approximate $4,000 trading level at the time of the revision, the unchanged $4,750 year-end target represented roughly 16% upside through December 2026, according to Reuters reporting on the July 9 publication.
What Was Actually Revised in HSBC's Complete Forecast Architecture?
The table below captures what changed and what did not in HSBC's 9 July revision:
| Forecast Metric | Revised Figure | Prior Estimate | Status |
|---|---|---|---|
| 2026 Full-Year Average | $4,560/oz | $4,864/oz | Revised Down |
| 2026 Year-End Target | $4,750/oz | $4,750/oz | Unchanged |
| 2026 H2 Trading Range | $3,800 to $4,700 | Not previously specified | New Guidance |
| 2027 Year-End Target | $5,025/oz | $5,025/oz | Unchanged |
| 2028 Year-End Target | $5,200/oz | $5,200/oz | Unchanged |
| 2029 Year-End Target | $5,300/oz | $5,300/oz | Unchanged |
| 2026 Central Bank Demand | 680 tonnes | 680 tonnes | Unchanged |
The unbroken upward sequence from $4,750 to $5,025 to $5,200 to $5,300 across successive year-end targets is the core message. Not a single element of the multi-year directional framework was revised when the near-term average was cut.
The Real Yield Mechanism: Why Gold Is Under Near-Term Pressure
Understanding what HSBC is actually acknowledging requires a working understanding of how Treasury yields interact with gold prices.
Gold generates no income. It pays no dividend and no coupon. Consequently, when the yield available on US Treasury bonds rises meaningfully, investors who hold gold face an increasing opportunity cost. Every percentage point of real yield represents returns foregone by choosing a non-yielding asset over a government bond.
As of 20 July 2026, the 10-year US Treasury yield sat at approximately 4.57%, according to MacroMicro and US Treasury data. With inflation expectations near 2.3%, the implied real yield exceeded 2%. That is a genuine and measurable headwind for gold in the near term.
The dollar compounds this pressure through a separate channel. Higher US rate expectations attract global capital into dollar-denominated instruments, strengthening the currency. A stronger dollar raises the effective cost of gold for buyers operating in non-USD currencies, suppressing overseas demand. By mid-July 2026, the US dollar was trading near 13-month highs.
HSBC analysts Willem Sels and Lucia Ku addressed this dynamic directly in their July 2026 client note, identifying US yields as the primary driver of gold price movements and noting that gold could remain range-bound while elevated real yields and dollar strength persisted, according to Reuters.
The critical qualifier in HSBC's analysis is that the bank views these forces as cyclical, not structural. They reflect a specific moment in the rate cycle, not a permanent reordering of the monetary framework that drove gold from approximately $2,600 in late 2024 to its January 2026 record. Furthermore, the broader case for gold as a safe haven remains structurally intact despite these near-term pressures.
The 2022 Historical Precedent
The most instructive parallel sits four years in the past. During the Federal Reserve's most aggressive tightening campaign in four decades throughout 2022, real yields swung from deeply negative to meaningfully positive. By conventional gold market logic, that environment should have been devastating for gold prices.
Gold held above $1,800/oz for the entire calendar year.
The mechanism that absorbed institutional selling during that cycle was sovereign accumulation. Central banks purchased a 70-year record volume of gold in 2022 and have sustained purchases above 800 tonnes per year every year since, which is more than double the pre-2022 historical average, according to World Gold Council data. The same structural dynamic appears to be operating in mid-2026.
Central Bank Accumulation: The Variable That Changes the Entire Analysis
The most consequential data point in the current gold market environment receives the least attention in mainstream coverage.
Global central banks added a net 244 tonnes of gold in Q1 2026 alone, according to the World Gold Council's Gold Demand Trends Q1 2026 report published 29 April 2026. That figure exceeded both the prior quarter and the five-year quarterly average. These are sovereign institutions accumulating gold through some of the highest price levels in recorded history, which demonstrates that their buying is driven by structural reserve diversification strategy rather than tactical price chasing.
A record 45% of central banks surveyed by the World Gold Council in June 2026 indicated plans to increase gold reserves over the following 12 months. This is not a marginal or speculative data point. These are the institutions that create fiat currency professionally. Their decision to exchange that currency for gold is an institutional vote on the long-term architecture of the monetary system. Indeed, central bank gold demand has been one of the defining forces sustaining the structural bull case.
HSBC's response to this data is instructive: when Steel cut the 2026 average price forecast, he did not revise the central bank demand projection. The bank maintained its forecast of 680 tonnes for 2026 and 850 tonnes for 2027. The demand floor was treated as a separate analytical variable from near-term price trajectory.
The table below illustrates why different buyer types respond differently to rate cycle pressure:
| Buyer Type | Primary Motivation | Rate Cycle Sensitivity | Time Horizon |
|---|---|---|---|
| Central Banks | Reserve diversification, de-dollarisation | Low | Multi-decade |
| ETF Investors | Tactical inflation hedge | High | Months to years |
| Asian Retail Buyers | Wealth preservation, cultural demand | Moderate | Years |
| Paper-Gold Traders | Short-term price speculation | Very High | Days to weeks |
The East-West Demand Divergence
One structural dynamic that receives insufficient coverage is the geographic divergence between buying and selling activity in the gold market. China's gold ETF inflows led global demand in the first half of 2026, with Asian funds accounting for the dominant share of $8 billion in net global gold ETF inflows during H1 2026, even as North American funds recorded outflows, according to World Gold Council ETF Flows data for June 2026.
This divergence has a mechanical consequence that extends beyond simple demand arithmetic. As physical gold migrates from Western exchange vaults into Asian domestic reserves and retail storage channels, the quantity of metal available to the paper trading market structurally contracts over time. The implication is that Western ETF outflows do not simply reduce demand. They progressively tighten the physical supply available to future paper market operations, which creates a compounding tension that does not resolve when Western sentiment stabilises.
Silver's Structural Undervaluation: Why the 70:1 Ratio Is a Setup, Not a Warning
The gold-silver ratio analysis shows this measure expanded from approximately 55:1 in May 2026 to roughly 70:1 by mid-July 2026. At face value, this looks like silver is broken. The reality requires more analytical precision.
Silver's demand composition creates a dual vulnerability that gold does not share. Approximately 58% of total silver demand is industrial, according to the Silver Institute's World Silver Survey 2026. Solar panels, electric vehicles, advanced semiconductors, and data centre infrastructure all consume silver in quantities and applications that are not readily substituted.
When investors reprice growth expectations downward in response to elevated interest rates, silver faces simultaneous pressure from two separate channels:
- The monetary channel: elevated real yields raise the opportunity cost of holding non-yielding precious metals
- The industrial channel: growth slowdown fears reduce expectations for industrial silver consumption
Gold only faces the monetary channel. This explains why silver underperforms gold so sharply during tightening cycles, and why the gold-silver ratio typically expands precisely when rate pressure peaks.
Six Consecutive Years of Silver Supply Deficit
| Year | Annual Silver Supply Deficit |
|---|---|
| 2021 | Deficit begins |
| 2022 | Deficit widens |
| 2023 | Deficit continues |
| 2024 | Deficit continues |
| 2025 | 40.3 million oz |
| 2026 (projected) | 46.3 million oz |
The Silver Institute confirmed the sixth consecutive annual silver supply deficits for 2026 at 46.3 million ounces, wider than the 40.3 million ounce shortfall recorded in 2025. Since 2021, cumulative above-ground stock drawdowns have reached 762 million troy ounces, which represents nearly nine months of total global mine production absorbed without a corresponding supply response, according to the Silver Institute's World Silver Survey 2026, published 15 April 2026.
The 50-year historical average gold-silver ratio sits near 65:1. Ratios above 70:1 have historically corresponded to periods of relative silver undervaluation. Silver is currently pricing in a degree of permanent industrial slowdown that a six-year and widening supply deficit structure does not support. When monetary conditions eventually ease and industrial demand expectations stabilise, the ratio compression that follows tends to be sharp.
What does a gold-silver ratio above 70:1 actually mean? It indicates silver is historically cheap relative to gold. Based on the 50-year average of approximately 65:1, silver would need to outperform gold by roughly 7–8% simply to return to long-run norms, independent of any absolute price movement in either metal. A catalyst such as a Fed policy pivot or industrial demand recovery typically triggers this compression.
Institutional Forecast Divergence: HSBC vs. Peer Banks
HSBC's conservatism stands out against the broader institutional landscape, which provides useful context for interpreting the July 9 revision.
- HSBC projects a 2026 H2 trading range of $3,800 to $4,700, with a year-end target of $4,750
- J.P. Morgan and Wells Fargo have projected year-end 2026 gold prices above $6,000/oz
- State Street's July 2026 Monthly Gold Monitor targets $5,000 into early 2027 with a baseline probability range of $4,750 to $5,500
The wide dispersion among major institutional forecasts is itself informative. It signals genuine macro uncertainty rather than consensus bearishness. More critically, no major institution in the current landscape has abandoned the structural bull case for gold. HSBC's conservative range exists within a peer group that broadly retains upside conviction. The debate is about magnitude and trajectory speed, not direction.
HSBC's revised gold price forecast saw Steel specifically identify rising global fiscal deficits and sovereign debt market pressures as the structural forces expected to drive gold's second-half 2026 recovery. This framing points to a ceiling on how aggressively the Federal Reserve can sustain tightening. Expanding sovereign debt loads progressively consume the fiscal space required to maintain elevated rates, as rising interest servicing costs become self-defeating for governments carrying record debt burdens. This dynamic does not eliminate near-term yield pressure, but it defines a structural boundary beyond which further tightening becomes arithmetically counterproductive.
Furthermore, HSBC noted in a late-June communication that gold was increasingly bordering on looking undervalued at prevailing levels, according to ExchangeRates.org.uk, reporting from 30 June 2026. That language, paired with the unchanged year-end target, frames the current correction as an accumulation environment rather than a structural breakdown. However, the gold price forecast trajectory across multiple institutions consistently points to sustained upside potential across the medium term.
The next major ASX story will hit our subscribers first
A Practical Framework for Accumulating Through a Structural Correction
The appropriate response to this environment depends almost entirely on investment horizon. For short-term paper-gold traders calibrating positions to the 28–29 July FOMC meeting or monthly PCE prints, the tactical calculus remains genuinely uncertain and is beyond the scope of structural analysis.
For long-term physical metals holders, the following step-by-step framework applies to the current consolidation phase:
-
Clarify your investment horizon. A three-to-five-year purchasing power protection strategy operates on fundamentally different logic than a six-month tactical position. Structural bull markets routinely include corrections of 20–30% without invalidating the primary trend.
-
Separate cyclical headwinds from structural drivers. Elevated real yields are a cyclical phenomenon constrained by fiscal arithmetic. Sovereign de-dollarisation, central bank reserve diversification, and industrial silver supply deficits are structural and continue independently of rate cycles.
-
Establish a regular accumulation schedule. Spreading purchases across Q3 2026 rather than attempting to identify a single entry point reduces timing risk while maintaining exposure to the structural recovery HSBC's unchanged year-end target anticipates.
-
Use the gold-silver ratio as a relative value indicator. Ratios above the 50-year average have historically preceded periods of silver outperformance when monetary conditions ease. Current readings above 70:1 represent a historically elevated relative value setup for silver.
-
Monitor FOMC language for the policy ceiling signal. A single rate hold does not change the structural thesis. A sustained shift in Federal Reserve language toward easing, however, would directly remove the primary cyclical headwind from both gold and silver simultaneously.
HSBC's analysts Willem Sels and Lucia Ku articulated the medium-term case in their July 2026 client communication, noting that demand for portfolio diversification, central bank buying, and ETF inflows should support gold prices over the medium term, and reaffirming the bank's view of gold as an effective diversifier against broader portfolio risks, as reported by Reuters.
Key Takeaways: What the HSBC Gold Price Forecast Revision Actually Communicates
- The HSBC gold price forecast $4,750 by year-end was never revised. Only the full-year average, which reflects already-realised H1 prices, was reduced
- Every long-dated HSBC target from 2027 through 2029 remained unchanged, preserving an unbroken upward trajectory of $5,025, $5,200, and $5,300
- 244 tonnes of central bank gold purchases in Q1 2026 alone exceeded the five-year quarterly average, demonstrating sovereign demand persists through historically elevated price levels
- The gold-silver ratio at 70:1 sits above the 50-year historical average, with silver's sixth consecutive and widening supply deficit providing structural foundation beneath current underperformance
- Near-term headwinds from real yields and dollar strength are cyclical and fiscally constrained. The forces that drove gold from $2,600 in late 2024 to a January 2026 record of $5,589.38 remain structurally intact
- Forecast divergence among major banks, with competing projections ranging above $6,000, signals that no major institution has abandoned gold's directional bull case
Disclaimer: This article is for informational and educational purposes only and does not constitute financial or investment advice. Precious metals investing involves risk, including the potential loss of principal. Past performance is not indicative of future results. Always consult a qualified financial adviser before making investment decisions.
Want to Capitalise on the Next Major Mineral Discovery Before the Market Does?
Discovery Alert's proprietary Discovery IQ model delivers real-time alerts on significant ASX mineral discoveries, instantly translating complex data into actionable opportunities for investors at every experience level — explore the historic returns major discoveries have generated and begin your 14-day free trial at Discovery Alert to position yourself ahead of the broader market.