
July 17, 2026
Reading a Mine the Right Way: What the Hycroft Technical Report Actually Reveals
Most investors approach a mining technical report the way they approach a company press release — scanning for big numbers and moving on. That instinct misses most of the value embedded in these documents. A technical report prepared under SEC Subpart 1300 regulations is a legally accountable engineering study, not a promotional tool. Every resource figure, recovery assumption, and cost estimate within it must be certified by independent qualified persons who stake their professional credibility on its accuracy. Understanding how to interpret drill results is arguably the most important skill a precious metals investor can develop.
The 2026 Hycroft Mine technical report, prepared by a multi-firm team including Ausenco, IMC, and WestLand, represents one of the most comprehensive engineering assessments of a large-scale U.S. precious metals deposit in recent memory. What it reveals about the deposit's geometry, processing requirements, cost structure, and valuation sensitivity offers a far richer picture than any headline figure can convey.
When big ASX news breaks, our subscribers know first
The Drilling Database Underpinning the 2026 Resource Model
A mineral resource estimate is only as reliable as the data it is built from. The 2026 Hycroft Mine technical report draws on a drilling database comprising 5,813 drillholes representing a cumulative 2.67 million feet of subsurface sampling. That scale of geological interrogation places this among the most thoroughly characterised large-scale deposits in the western United States.
The density and spatial distribution of that drilling record directly determine how resources are classified under the SEC Subpart 1300 framework:
- Measured resources require closely spaced drilling with high geological continuity confidence
- Indicated resources are supported by sufficient drill coverage to assume continuity between sample points
- Inferred resources reflect geological inference with limited drill confirmation and cannot be included in economic mine plans
The cumulative effect of systematic infill and extensional drilling conducted between 2021 and 2025 produced a 55% increase in measured and indicated gold and silver resources relative to prior estimates. Resource growth of that magnitude at an advanced-stage project is genuinely uncommon and implies the deposit was previously under-drilled relative to its actual extent.
Total Resource Inventory: What the Numbers Show
The January 2026 mineral resource estimate established the following measured and indicated inventory:
| Resource Category | Gold (Moz) | Silver (Moz) |
|---|---|---|
| Measured and Indicated (Open Pit) | 16.4 | 562.6 |
| High-Grade Underground Silver | — | 90.2 |
| Inferred (Excluded from Mine Plan) | Not disclosed | Not disclosed |
Resource classification was anchored to a 2 oz/ton (68.57 g/t) silver-equivalent cut-off grade. Cut-off grades are not arbitrary — they represent the minimum grade at which ore can be economically processed given assumed metal prices and processing costs. A change in either variable shifts the economic boundary of the deposit and alters the tonnage and grade of material that qualifies as a resource.
Importantly, inferred mineral resources, recent exploration drilling results, and run-of-mine stockpiles accumulated during prior operations were deliberately excluded from the economic model. This conservative approach, mandated by SEC Subpart 1300, means the reported $4.3 billion after-tax NPV at planning-level prices does not capture value that may exist within these excluded categories.
Deposit Geometry: Why Physical Shape Drives Processing Strategy
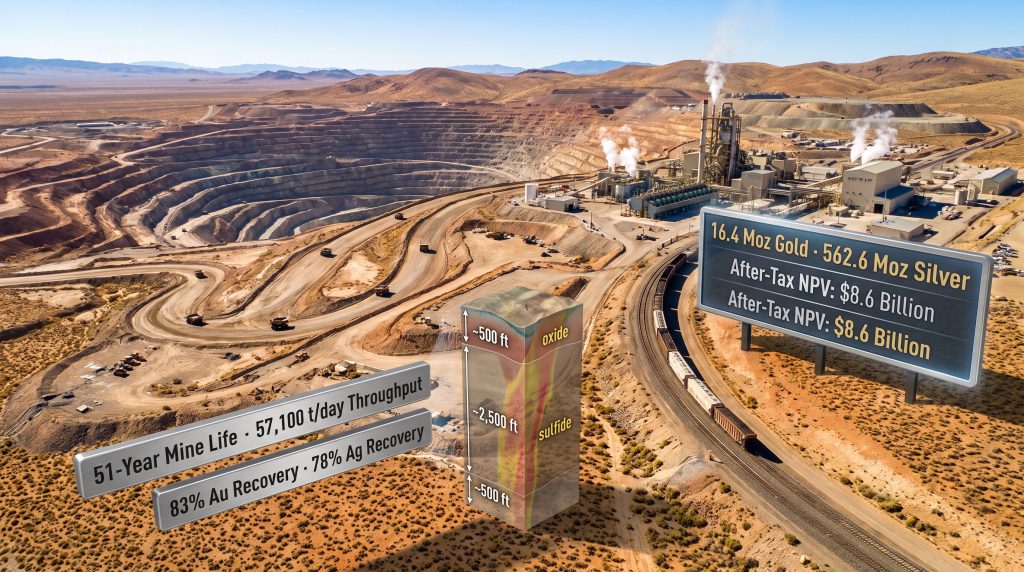
Hycroft's mineralisation follows a vertical zonation pattern that directly governs which processing technologies apply to each domain:
- Oxide mineralisation occurs at approximately 500 feet below surface
- Sulfide mineralisation extends to depths of approximately 2,500 feet
- True deposit width ranges from 1,000 to 1,800 feet, a critical parameter for open pit slope engineering and underground feasibility assessment
Furthermore, this vertical sequence from oxide through transition to sulfide ore is not merely a geological curiosity. It determines capital allocation, processing plant design, and the sequencing of ore feed across the mine's operating life. When true widths versus apparent widths are considered alongside this geometry, the engineering implications become even more pronounced.
Dual-Flowsheet Architecture: Matching Processing Technology to Ore Chemistry
One of the most technically significant aspects of the Hycroft Mine technical report is the decision to deploy two fundamentally different processing pathways rather than a single unified flowsheet. That choice reflects the realities of the deposit's mineralogy.
Run-of-Mine cyanide heap leaching is applied to oxide and transition zone material near the surface. This approach carries lower capital intensity and suits the more chemically accessible oxide ore where gold and silver are not physically locked within sulfide mineral matrices.
Conventional flotation followed by Pressure Oxidation (POX) is applied to sulfide and transition zone material. This is where the technical complexity, and the capital cost, escalates significantly.
Why Pressure Oxidation Is Not Optional for Refractory Ore
The majority of Hycroft's ore inventory is classified as refractory sulfide material. In refractory deposits, gold and silver particles are physically encapsulated within iron sulfide minerals, most commonly pyrite and arsenopyrite. Conventional cyanide leaching cannot dissolve these sulfide hosts at economically meaningful rates, meaning the metal remains locked regardless of how long the ore sits in a leach pad.
Pressure oxidation resolves this by exposing ore to high-temperature, high-pressure, oxygen-rich conditions that chemically break down the sulfide matrix before cyanidation. The process is energy-intensive and operationally demanding, but it unlocks metal recoveries that heap leaching simply cannot achieve on refractory material.
Metallurgical testwork conducted between 2021 and 2025 underpins the following recovery assumptions for the sulfide flowsheet:
- 83% gold recovery via milling and POX
- 78% silver recovery via milling and POX
These recovery rates are competitive within the refractory gold-silver processing sector, where achieving above 80% gold recovery through POX is considered strong performance. The quality of the flotation concentrate feeding the POX circuit, particularly its sulfide mineral grade, is a critical determinant of downstream efficiency and operating cost per tonne treated.
Throughput, Production Profile, and Mine Scale
The sulfide and transition ore processing circuit is designed to handle approximately 57,100 tons per day. Translating that daily throughput into economic output yields an average annual production of approximately 295,000 gold equivalent ounces, with a cumulative life-of-mine production target of 15.1 million gold equivalent ounces across a 51-year operating period.
The production profile is not uniform across that span. Output is structured to be front-loaded, with the strongest years concentrated in the first decade of operation before settling into a lower steady-state rate. This shape matters for NPV calculations, since cash flows generated in years one through ten carry far more present value weight than those produced in years thirty through fifty at any reasonable discount rate.
Capital Structure and Cost Economics
All-In Sustaining Cost Framework
The all-in sustaining cost to produce one gold equivalent ounce is estimated at approximately $2,150. AISC is the most comprehensive single cost metric available for mine-level economic assessment, incorporating:
- Direct mining costs (drilling, blasting, loading, haulage)
- Processing consumables (reagents, energy, water treatment)
- Site-level general and administrative expenses
- Sustaining capital expenditure for equipment replacement and infrastructure maintenance
- Royalty obligations
The POX flowsheet structurally elevates operating costs compared to simpler heap leach configurations, but that trade-off is justified by the step-change improvement in metal recovery that pressure oxidation delivers on refractory ore. A heap leach operation processing the same sulfide material would recover a fraction of the metal at a lower cost per tonne treated, but at dramatically lower total revenue per tonne of ore mined.
Capital Expenditure and Payback Period
The mine plan requires substantial upfront construction capital followed by ongoing sustaining investment across the 51-year operating life. New infrastructure commitments embedded in the plan include:
- Tailings storage facility construction
- Waste rock storage facility development
- New processing plant installation
- Limestone processing facility for reagent supply management
- Rail line extension connecting to existing transport infrastructure
Despite these requirements, the capital payback period is estimated at under five years at planning-level metal prices, compressing further at current spot prices, which exceed the conservative assumptions used in the base case model.
NPV Sensitivity: Why Silver Matters More Than Gold at Hycroft
The price sensitivity of the project's after-tax NPV reveals something structurally distinctive about Hycroft that separates it from conventional Nevada gold operations. Silver's dual role as both a precious and industrial metal, as explored in analyses of silver's commodity dynamics, contributes meaningfully to this asymmetric price sensitivity:
| Metal Price Change | Incremental After-Tax NPV Impact |
|---|---|
| +$100/oz gold | +approximately $300 million |
| +$5.00/oz silver | +approximately $460 million |
The silver price sensitivity exceeding the gold sensitivity on a per-dollar basis is not an anomaly — it directly reflects the extraordinary size of Hycroft's silver inventory relative to its gold base. With 562.6 million ounces of measured and indicated silver in the open pit resource alone, even modest silver price appreciation translates into substantial value creation at the project level.
At planning-level prices, the after-tax NPV stands at $4.3 billion. At mid-2026 spot market prices, that figure exceeds $8.6 billion — more than double the base case. When the full resource base is incorporated into the calculation, independent research places the potential NPV in the vicinity of $10 billion. These are wide brackets, and investors should treat them as a sensitivity range rather than a point estimate, recognising that 51-year NPV calculations are inherently sensitive to discount rate assumptions and long-dated metal price forecasts.
Brownfield Advantage and Remaining Infrastructure Requirements
Hycroft's location west of Winnemucca, Nevada, and its history of prior mining operations create a meaningful economic advantage that is easy to undervalue when reviewing a capital cost summary in isolation. Decades of historical production activity have left functional infrastructure in place:
- Rock-breaking and materials handling equipment
- Ore treatment ponds from prior operations
- Metal recovery processing facilities
- Administrative and support infrastructure
- Proximate rail connection to the existing network
This brownfield base reduces the scope of greenfield capital required to reach first production. However, it does not eliminate the need for substantial new construction. The mine plan still requires the full infrastructure list noted above, and permitting for new facility construction within Nevada's regulatory framework carries execution risk that should be factored into any development timeline assessment.
What Lies Outside the Economic Boundary of the Current Study
Excluded Resources and Their Implications
Three categories of potential value are deliberately excluded from the current technical study's economics, in compliance with SEC Subpart 1300 requirements:
- Inferred mineral resources — classified as too geologically uncertain for inclusion in a mine plan under current regulations
- Run-of-mine stockpiles — lower-grade material accumulated during prior operations that could serve as early-stage heap leach feed
- Recent exploration drilling results — data generated after the resource model cut-off date that has not yet been incorporated into a formal estimate
The company's current land position covers only a fraction of its total tenement footprint, meaning the deposit system remains substantially open to further definition drilling in multiple directions.
Brimstone and Vortex: High-Grade Silver Targets With Open Drill Extents
Two silver-dominant systems discovered since 2023, named Brimstone and Vortex, represent the most immediately compelling exploration upside vectors within the existing land package. Both targets are characterised by high-grade silver mineralisation, and critically, neither has been drilled to its lateral or depth limits, meaning the full dimensions of each system remain undefined.
Active drilling programs were underway at both targets as of mid-2026, with program expansion planned for subsequent months. The significance of these targets to project economics is potentially substantial. Furthermore, the company has publicly communicated the transformative potential of these high-grade silver discoveries in the context of the broader project NPV:
- Higher-grade silver ore introduced earlier in the mine sequence would improve the front-loaded cash flow profile that drives NPV
- A sufficiently large Brimstone or Vortex discovery could support an underground mining component positioned alongside the existing open pit plan
- Near-surface high-grade targets at either system could potentially support lower-cost initial processing through heap leach methods before the POX circuit reaches full operational capacity
Sulfuric Acid as a Third Revenue Stream
An often-overlooked aspect of the POX flowsheet is the potential to generate sulfuric acid as a saleable by-product of the oxidation process. Hycroft is actively evaluating a processing configuration that would capture and market this output. Sulfuric acid is a high-volume industrial commodity consumed across fertiliser production, battery materials processing, and chemical manufacturing, meaning demand pathways are diverse and well-established. A functioning acid sales programme would partially offset POX operating costs, improving the project's overall unit economics.
The next major ASX story will hit our subscribers first
Benchmarking Hycroft Against Nevada Peers
| Metric | Hycroft Mine | Typical Nevada Gold Operation |
|---|---|---|
| Mine Life | 51 years | 10–20 years |
| Primary Processing | Flotation plus POX | Heap Leach or Carbon-in-Leach |
| Gold Recovery (Sulfide Ore) | 83% | 75–88% (varies by ore type) |
| Silver Recovery | 78% | Often incidental by-product |
| Resource Base | 16.4 Moz Au + 562.6 Moz Ag M&I | Predominantly gold-focused |
| Regulatory Framework | SEC Subpart 1300 | SEC Subpart 1300 |
| Jurisdiction | Nevada, USA | Nevada, USA |
The 51-year mine life stands out immediately. Most Nevada gold operations are designed around 10 to 20-year reserve lives, with resource conversion providing optionality beyond the initial mine plan. A five-decade operating horizon creates a categorically different investment profile — one where the asset's value is concentrated in the first 15 to 20 years of cash flow, and where the long tail of production contributes relatively little to present value at standard discount rates.
Frequently Asked Questions: Hycroft Mine Technical Report
What Regulatory Standard Governs the Hycroft Mine Technical Report?
The 2026 technical report was prepared in accordance with SEC Subpart 1300, the U.S. Securities and Exchange Commission's mineral resource and reserve disclosure framework that replaced the older Industry Guide 7 standard. This regulation requires independent qualified persons to certify all resource and reserve estimates, creating legal accountability for every figure disclosed.
What Is the Total Gold and Silver Resource at the Hycroft Mine?
The January 2026 mineral resource estimate confirms 16.4 million ounces of gold and 562.6 million ounces of silver in measured and indicated categories for the open pit resource, plus an additional 90.2 million ounces of high-grade underground silver resource.
Why Does the Hycroft Mine Require Pressure Oxidation Rather Than Simple Cyanide Leaching?
The majority of Hycroft's ore is classified as refractory sulfide material, in which gold and silver are physically encapsulated within iron sulfide minerals. Conventional cyanide solutions cannot access this locked metal without first oxidising the sulfide host, a function performed by the pressure oxidation circuit operating at elevated temperature and pressure.
What Is the Significance of the 55% Resource Growth Reported in the 2026 Mineral Resource Estimate?
A 55% increase in measured and indicated resources relative to prior estimates reflects the cumulative impact of systematic infill and extensional drilling conducted between 2021 and 2025. Growth of this magnitude at an advanced-stage project is uncommon and strongly suggests the deposit system was previously incompletely defined. Consequently, when interpreting these drill results, investors should consider the full context of the geological programme rather than individual intercepts in isolation.
How Does Silver Price Sensitivity Compare to Gold Price Sensitivity at Hycroft?
A $5.00 per ounce increase in silver price adds approximately $460 million to after-tax NPV, while a $100 per ounce increase in gold adds approximately $300 million. This asymmetry reflects the enormous scale of Hycroft's silver inventory relative to its gold endowment and positions the project as structurally more responsive to silver market movements than most Nevada precious metals operations.
Key Takeaways for Investors Evaluating the Hycroft Mine Technical Report
The 2026 Hycroft Mine technical report delivers a genuinely complex picture that rewards careful reading. Several structural characteristics of this project differentiate it from conventional Nevada gold developments:
- A drilling database of 5,813 holes and 2.67 million feet provides an unusually robust geological foundation for the resource model
- The dual-flowsheet design is technically appropriate for vertically zoned oxide and sulfide mineralisation but carries higher capital and operating cost requirements than heap-leach-only operations
- The $4.3 billion base-case and $10 billion spot-price NPV estimates bracket a wide range of outcomes that are highly sensitive to gold and silver price trajectories over a multi-decade horizon
- Three distinct value vectors — excluded inferred resources, active exploration at Brimstone and Vortex, and potential sulfuric acid by-product revenue — are entirely absent from the current study's reported economics
- Silver price leverage, where a $5.00/oz silver move generates more NPV uplift than a $100/oz gold move, positions this as a structurally differentiated asset within the Nevada precious metals development landscape
Disclaimer: This article is intended for informational and educational purposes only and does not constitute financial advice. All NPV figures, production estimates, cost projections, and exploration targets referenced herein are sourced from Hycroft Mining Holding Corporation's publicly disclosed technical documentation. Mineral resource estimates, NPV projections, and exploration targets involve inherent uncertainty. Readers should conduct their own independent due diligence and consult a qualified financial adviser before making any investment decisions. Past performance and geological estimates are not guarantees of future outcomes.
Want to Know When the Next Major Precious Metals Discovery Hits the ASX?
Discovery Alert's proprietary Discovery IQ model delivers real-time notifications on significant ASX mineral discoveries — turning complex geological data into actionable investment insights the moment they are announced. Explore historic examples of extraordinary discovery returns and begin your 14-day free trial at Discovery Alert to position yourself ahead of the broader market.