
July 22, 2026
The Global Monetary Order Was Already Fracturing Before the First Strike
For decades, economists and strategists debated whether the U.S. dollar's dominance was structural or merely historical accident. That debate has become suddenly urgent. The Iran war and dollar hegemony are inextricably linked, as the Iran conflict — now stretching well past its originally projected four-to-six-week timeline — has placed the mechanics of global monetary power under a stress test unlike anything seen since the Nixon shock of 1971. But to understand what is actually happening, the starting point cannot be the war itself. It must be the financial architecture the war is fighting to preserve.
The petrodollar system, constructed in the early 1970s through agreements between the United States and Gulf oil producers, made the dollar the default settlement currency for global energy transactions. This was not incidental. It created a self-reinforcing cycle: nations needed dollars to buy oil, which meant holding dollar reserves, which meant recycling those reserves into U.S. Treasury bonds, which funded American deficits at artificially low borrowing costs. The entire architecture of U.S. financial power rests on this foundation.
When big ASX news breaks, our subscribers know first
Why the Iran Conflict Cannot Be Separated from Dollar Defence
The Yuan Oil Pattern No One Wants to Name
A striking geopolitical pattern has emerged across the past decade, one that deserves far more analytical attention than mainstream financial media has given it. Nations that have moved to price or settle energy transactions in yuan have consistently faced significant external pressure. Venezuela transitioned to yuan-denominated oil sales and faced severe economic sanctions and political destabilisation. Russia pursued yuan settlement for energy exports and subsequently encountered a colour revolution on its western border in Ukraine, followed by attempts to position adversarial military infrastructure near Russian territory. Iran's yuan-denominated oil transactions preceded direct military strikes.
The pattern is not conclusive proof of intent, but it is analytically impossible to dismiss. It suggests that geopolitical pressure and dollar defence may be more structurally connected than official rationales acknowledge. The stated reasons for each intervention differ; the underlying financial commonality does not.
The Strategic Logic and Its Failures
Breaking down the possible strategic rationale for the Iran conflict reveals at least four distinct threads:
-
Misjudging the operational difficulty, with early projections of a four-to-six-week resolution proving dramatically wrong as the conflict extended past five months.
-
Disrupting China's energy and supply chain access, specifically targeting helium, a critical input for semiconductor manufacturing. The United States and Qatar dominate global helium supply; after those two, production drops off sharply. The strategic logic of degrading Gulf helium availability to constrain Chinese chip manufacturing had a coherent internal rationale, though it appears to be accelerating Chinese domestic helium production rather than creating dependency.
-
A "let the dog catch the car" calculation, allowing certain policy factions to overextend themselves and face the consequences of a conflict that cannot be resolved on the timeline promised, thereby recalibrating domestic political and strategic alliances.
-
Incentivising domestic industrial reshoring within the United States through the pressure created by supply chain vulnerability.
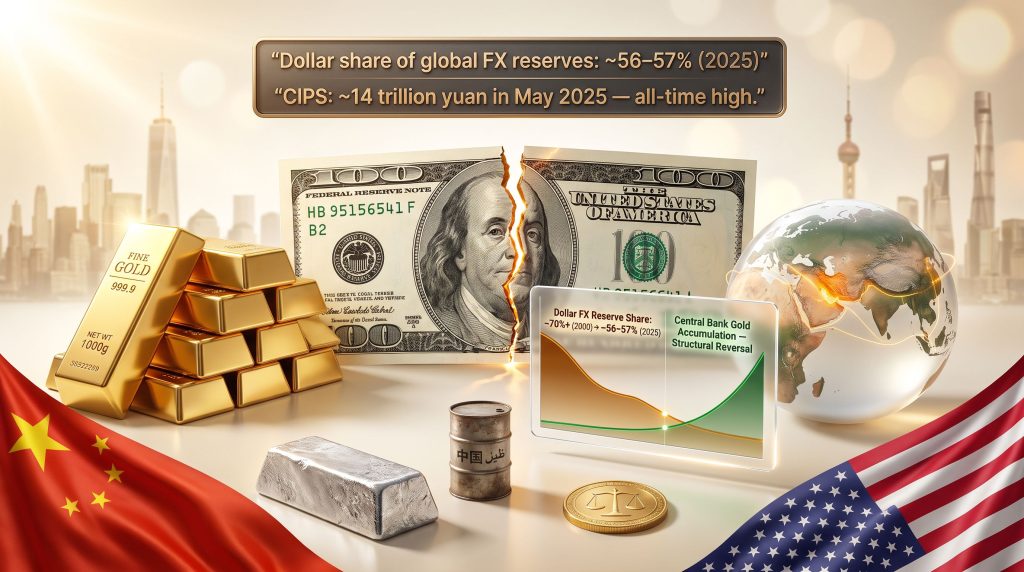
What has actually happened tells a different story. Yuan-denominated payments through China's Cross-Border Interbank Payment System (CIPS) hit all-time highs in May 2025, processing approximately 14 trillion yuan (roughly $2 trillion USD) in a single month. Chinese corporate profits rose approximately 20% during the conflict period. Export volumes climbed approximately 27% in the most recent reporting month. China's structural shift toward electric vehicles has reduced its oil consumption by approximately 1.4 million barrels per day, meaningfully reducing its energy vulnerability to Gulf disruption. The strategy, to the extent it targeted Chinese economic resilience, does not appear to be working.
| Strategic Goal | Intended Outcome | Observed Outcome (2025) |
|---|---|---|
| Disrupt yuan oil payments | Slow petroyuan development | CIPS hit all-time highs in May 2025 |
| Restrict Gulf helium to China | Interrupt semiconductor supply chain | China accelerating domestic helium capacity |
| Weaken China's energy security | Increase vulnerability | EV shift cut oil demand by ~1.4M bpd |
| Reinforce dollar oil settlement | Reassert petrodollar dominance | Iran demanding yuan/crypto Hormuz transit fees |
What Dollar Hegemony Actually Means in 2025
Measuring Dominance Across Three Dimensions
Dollar hegemony operates across three distinct channels, each of which tells a slightly different story about the pace of structural change:
-
Foreign exchange reserves: The dollar's share of global FX reserves has declined from over 70% in 2000 to approximately 56–57% as of 2025, a meaningful erosion across a quarter century.
-
FX transactions: The dollar remains involved in approximately 89% of all global foreign exchange transactions, showing only marginal decline from prior decades.
-
Global trade settlement: The dollar's share of trade settlement has contracted from over 90% to approximately 85%, a gradual but directionally consistent shift.
| Metric | 2000 Level | 2025 Level | Change |
|---|---|---|---|
| Dollar share of global FX reserves | ~70%+ | ~56–57% | Down ~13–14 percentage points |
| Dollar share of FX transactions | ~90%+ | ~89% | Marginal decline |
| Dollar share of global trade settlement | ~90%+ | ~85% | Down ~5 percentage points |
| Central bank gold reserves (trend) | Declining | Rising meaningfully | Structural reversal |
Is the Twelve-Year Shift Hiding in Plain Sight?
Perhaps the most important data point in this entire analysis is one that receives almost no coverage in mainstream Western financial media. Over the past 12 years, global central banks have not grown their holdings of U.S. Treasury bonds. Treasury reserves have been essentially flat while Treasury supply has grown exponentially. What has grown, consistently and deliberately, is central bank gold demand. This is not a recent phenomenon triggered by the Iran conflict. It is a structural reorientation that has been underway for over a decade, and the Iran war has accelerated rather than created it.
How the Conflict Is Reshaping Financial Markets
Short-Term Dollar Dynamics: Strength With a Caveat
When military strikes began, the dollar strengthened by approximately 2.2% on safe-haven capital flows. This is consistent with historical patterns: during periods of acute geopolitical stress, the dollar benefits from its liquidity premium and its role as the world's emergency funding currency. The United States is also now a net hydrocarbon exporter, meaning rising oil prices provide a terms-of-trade benefit rather than the cost shock they would deliver to an oil-importing nation.
Gold's behaviour was counterintuitive for many observers. The precious metal experienced its worst weekly performance since 1983, declining approximately 14% in a brief period. The primary driver was reserve liquidation, most notably Turkey's significant gold sales, widely attributed to the need to finance energy imports amid Strait of Hormuz disruption. Central banks under energy stress simultaneously sold Treasury bonds and gold to raise dollar liquidity, creating the unusual dual-liquidation dynamic that suppressed gold prices during an active conflict.
Furthermore, gold as a safe haven has historically displayed complex behaviour during acute conflicts, and this episode reinforces the importance of distinguishing between short-term liquidation pressures and long-term structural demand.
Bond Market Signals: The Warning Nobody Acted On
U.S. 10-year Treasury yields moved from approximately 3.95% to 4.65% within five weeks of the conflict's escalation, a 70-basis-point surge that defied the predictions of analysts who expected yields to fall on safe-haven demand. The MOVE Index, which measures implied volatility in U.S. Treasury markets, reached approximately 118 in late March 2025, approaching levels associated with near-dysfunctional conditions.
"What is the MOVE Index? It measures implied volatility in U.S. Treasury markets. When it approaches or exceeds 100, it signals significant stress in the world's most critical bond market. A reading near 118 is historically associated with conditions where normal market functioning begins to break down."
Bond and equity volatility peaked within 12 hours of each other in early April 2025, a rare co-movement that reflects the systemic interconnection between Treasury market stability and equity valuations. Shortly thereafter, a significant and aggressive sale of both bond and equity volatility appeared to arrest the dysfunction, and markets rebounded. The complacency that followed may be misreading the structural situation.
Equities: Two Completely Different Stories Depending on Your Unit of Account
Evaluating U.S. equity markets through a dollar lens versus a gold lens produces dramatically different conclusions:
-
In nominal dollar terms: U.S. equities remain near all-time highs, supported by dollar liquidity injections and the reflexive "buy the dip" mentality reinforced by years of Fed backstopping.
-
In gold terms: U.S. equities remain approximately 30% below late 2021 highs and roughly 30–40% below January 2000 levels, suggesting that much of the nominal gain represents currency debasement rather than genuine real-economy growth.
The Warren Buffett Indicator — total equity market capitalisation as a percentage of GDP — when adjusted to account for U.S. federal debt monetisation, has now exceeded its January 2000 reading, historically the most extreme valuation level ever recorded. The analytical implication is straightforward: at valuations this extended, there is essentially zero tolerance for negative surprises, and the current environment is generating multiple simultaneous headwinds.
The scenario most consistent with historical patterns at this valuation level is a "Nike swoosh" shape: a sharp 10–20% nominal decline that creates Treasury market dysfunction, which then triggers liquidity injection by the Fed or Treasury, which restores equity markets to new highs. The critical distinction is that the gold-denominated correction, already underway since 2021, would continue regardless of the nominal dollar trajectory.
Gold's Paradox and Its Coming Inflection Point
Why Gold Sold Off During a War
The "war on, gold down" pattern observed throughout the Iran conflict has a structural explanation: when sovereign nations face acute energy import costs under conditions of supply disruption, they liquidate whatever liquid reserves they hold, including gold. Turkey's substantial gold sales during this period serve as a case study in this dynamic. The selling is not a vote against gold's monetary role; it is a forced liquidity event.
The more significant observation is what happens when this pattern breaks. Analysts and institutional investors are specifically watching for the transition from "war on, gold down" to "war on, gold up." That transition would signal something qualitatively different: a market consensus that the conflict represents a permanent structural shift in how global trade is settled, not a temporary disruption. At that point, participants who conduct business in yuan begin systematically recycling yuan surpluses into gold through the offshore clearing infrastructure China has established in London, Zurich, Dubai, Singapore, Hong Kong, and Shanghai. This architecture has been deliberately constructed over the past decade to enable exactly this kind of recycling.
China's Gold Infrastructure: The System Already Built
China's approach to yuan internationalisation has been consistently misread in Western financial analysis. Rather than pursuing full capital account liberalisation — which carries political risks Beijing has been unwilling to accept — China has established a parallel architecture: offshore yuan clearing banks in every major global gold trading centre. The mechanism is elegant in its simplicity. Nations that run trade surpluses with China and accumulate yuan have a direct pathway to convert those surpluses into gold, making yuan a viable trade currency even without full convertibility.
The PBOC articulated this direction as early as 2009, calling for a reserve asset not issued by any single nation. The IMF followed in 2011 with a report suggesting a transition away from dollar monopoly toward SDR-priced energy and gold. Former World Bank President Robert Zoellick proposed in 2010 that major currencies including the yuan should form a new monetary framework with gold as a reference point for inflation and growth expectations. These were not fringe views. They were the expressed positions of the major multilateral institutions, and they speak directly to the evolving role of gold in the monetary system.
The Hamiltonian Signal: Washington's Quiet Acknowledgement
What "Hamiltonian Economics" Tells Markets
U.S. Treasury Secretary Scott Bessent's speech at the New York Economic Club, delivered approximately four weeks prior to this analysis, paired with a simultaneous Wall Street Journal op-ed, explicitly framed Hamiltonian economics as the foundation of current U.S. economic statecraft. U.S. Trade Representative Jameson Greer stated at Davos in January 2025 that the United States is done with the old system. Vice President Vance and President Trump have both alluded to the same framework.
The critical analytical point — almost entirely missed by mainstream commentary that celebrated Bessent as a stabilising voice — is that Hamiltonian economics is structurally incompatible with the post-1971 dollar system. Hamiltonian economics centres on tariffs, industrial policy, and domestic production prioritisation. When a nation pursues these policies, it does not emit the volume of dollars required to sustain global reserve demand. The logical consequence, historically, is that the world moves toward gold as the neutral settlement asset.
"When a senior U.S. Treasury Secretary explicitly endorses a framework that cannot coexist with the petrodollar architecture, that is not a subtle signal. It is a declaration that the monetary transition is already in progress."
According to analysis from Chatham House, dollar dominance may be surviving the Iran war — but only just about — reinforcing the view that the structural foundations of U.S. monetary supremacy are under genuine strain.
The Debt Resolution Mathematics
If the Hamiltonian framework proceeds and dollar devaluation against gold becomes the path of least political resistance for resolving unsustainable debt levels, the numbers involved are striking. At current debt levels, analysts estimate that a meaningful offset of the federal debt burden through gold revaluation would require a gold price significantly in excess of $20,000 per ounce. The U.S. Treasury Secretary holds statutory authority to instruct the Federal Reserve to revalue gold reserves. This is not a market-driven price discovery event; it would be a deliberate policy revaluation. The historical precedent exists: Franklin Roosevelt revalued gold from $20.67 to $35 per ounce in 1934 as part of the New Deal debt restructuring.
The next major ASX story will hit our subscribers first
The Debt Doom Loop and Its Political Consequences
Financial Repression: The Slow Playbook Losing Political Viability
The preferred mechanism for managing U.S. debt over the past several decades has been financial repression: holding interest rates below nominal growth rates while reporting official inflation at modest levels. The arithmetic: federal debt has grown at approximately 8% CAGR since 2008, while official inflation was reported at approximately 3% and rates were held near 0–2%. The arithmetic creates a slow-motion wealth transfer from creditors to debtors, with the U.S. government as the primary beneficiary.
The off-balance-sheet problem makes this more acute. Entitlement liabilities — Social Security, Medicare — were not classified as formal debt until the cohort of 70 million Baby Boomers born between 1946 and 1964 began reaching eligibility age. This was a mathematically predictable event, not a surprise, yet the fiscal impact of those liabilities moving onto the balance sheet has been treated as an unexpected shock. The result has been accelerating debt growth that no plausible combination of growth and inflation can outrun.
The Global Defence Spending Escape Valve
The current coordinated response across the U.S., Germany, Japan, and the UK involves substantial increases in defence spending, funded by debt. Analytically, this looks like debt-fuelled fiscal stimulus structured as national security investment. The synchronised nature of this spending across major economies creates an interesting dynamic: if all major currencies are being debased simultaneously, none appears to depreciate against its peers in foreign exchange markets. All, however, depreciate against gold.
The terminal outcome of this trajectory, based on the trajectory of bond markets and political constraints on austerity, is most likely some form of yield suppression through regulatory or monetary intervention. That intervention, whenever it arrives, is structurally bullish for gold and real assets.
Institutional Decay and the Fourth Turning Framework
The Structural Predictors of Political Instability
Researcher Peter Turchin's analytical framework identifies two primary predictors of political instability: wealth inequality and what he terms "elite overproduction" — meaning the generation of more credentialed, ambitious elites than the existing institutional structure can absorb into meaningful roles. When both metrics are elevated simultaneously, historical outcomes trend toward political extremism and institutional breakdown.
By Turchin's measures, the United States currently registers its highest combined score on these two metrics since the late 1850s, the period immediately preceding the Civil War of 1861–1865. The parallels extend beyond numbers. The political dysfunction, the erosion of institutional trust, the emergence of far-left leadership in historically centrist political centres, and high-profile incidents of political violence all rhyme with the documented historical record of that pre-war period.
"The distinction that matters for investors is between a system in stress and a system in collapse. U.S. constitutional architecture has survived comparable periods of elite capture and institutional corruption before. The outcome remains genuinely uncertain, which is itself the relevant investment signal."
The "get yours while you can" mentality among elites, which drives much of the observed nepotism and institutional corruption, is rational within a system where sufficiently high-profile illegal and unethical behaviour has generated wealth without meaningful consequence — following the pattern established through the Iraq War, the 2008 financial crisis bailouts, and COVID-era policy responses. As the 18th-century investor and philosopher Charlie Munger observed, show someone an incentive and you will see the outcome. The incentive structure for elite misbehaviour has been operating without meaningful corrective mechanisms for over two decades.
Portfolio Construction for a Conflict Economy
Where the Risk-Reward Is Unfavourable
U.S. broad equity markets, by the Warren Buffett Indicator adjusted for federal debt monetisation, are now at valuations exceeding January 2000 levels — the most extreme reading in the historical record. At these levels, there is no buffer for negative surprises, and the current environment features multiple simultaneous headwinds including an unresolved military conflict, Chinese competitive pressure in key technology sectors, elevated oil prices, and depleted commodity inventories from the drawdowns used to manage early-conflict price spikes.
Where the Structural Opportunity Lies
Despite the broad equity caution, specific opportunity areas stand out:
-
Gold and gold-adjacent assets: Positioned as the primary beneficiary of dollar debasement, the Hamiltonian policy transition, and the structural shift toward a multipolar reserve system. The 12-year trend of central bank gold accumulation while Treasury holdings stagnate represents institutional validation of this thesis.
-
U.S. electrical infrastructure: Grid modernisation, transmission buildout, and domestic energy transition infrastructure benefit from reshoring regardless of the geopolitical outcome. This is a domestic demand story insulated from trade war dynamics.
-
Japanese equities: Japan is structurally positioned as the primary allied manufacturing partner for U.S. reshoring ambitions that cannot be executed domestically without foreign industrial capacity. If the U.S.-China economic divorce proceeds, Japan is the most natural beneficiary.
-
Cash and short-duration instruments: Maintaining 20–22% liquidity allocation serves as both risk management and optionality in an environment where valuation extremes create vulnerability to sudden repricing.
Silver: The Physical vs. Paper Tension
Silver occupies a dual identity: monetary relic and critical industrial material. Its use in electric vehicles, solar panels, and electrical systems means that the industrial reshoring agenda, if executed, will generate genuine physical demand pressure. The current pricing mechanism relies heavily on unallocated derivatives — credit silver and credit gold systems — to absorb demand increases without allowing spot prices to rise. Physical holders of silver may be rewarded within a two-year horizon as genuine industrial demand overwhelms the paper supply mechanism, though the precise timeline carries significant uncertainty.
From Monopoly to Multipolarity: The Transition Already Underway
What a Successful Transition Looks Like
The most likely long-run outcome is not dollar collapse but dollar transition: from unchallenged monopoly reserve currency to first among equals in a multipolar system where gold serves as the neutral settlement asset between blocs that do not trust each other's currencies. The dollar retains its liquidity and transaction advantages. It loses its monopoly on reserve accumulation and energy trade settlement. Gold becomes the bridge asset that allows trade surplus recycling without requiring political trust between counterparties.
If this transition is managed without a disorderly breakdown, the structural rebalancing of global trade that would follow could generate economic expansion comparable in scope to the post-World War II reconstruction period. That outcome requires coordinated multilateral policy action, U.S. willingness to accept a lower trade-weighted dollar, and Chinese willingness to partially open capital accounts as part of a negotiated monetary rebalancing. None of these conditions are guaranteed. However, the architecture for this transition — including CIPS, offshore yuan gold clearing hubs, and Hamiltonian economic policy in Washington — is already being constructed.
Consequently, understanding the global monetary shift now underway is essential context for interpreting not just the Iran conflict, but the broader reconfiguration of financial power that will define the decade ahead. As analysis from Frontline notes, the Iran war has meaningfully accelerated de-dollarisation dynamics that were already firmly in motion.
The Iran war and dollar hegemony are not separate subjects. They are two expressions of the same structural reality: a monetary order under transition, a conflict partly designed to arrest that transition, and a financial market environment where the short-term signals and long-term structural forces are pointing in opposite directions.
This article represents analytical commentary and does not constitute financial advice. All forward-looking statements involve material uncertainty. Past performance of any asset class is not indicative of future results. Readers should conduct their own due diligence before making investment decisions.
Want to Track the Commodity and Resource Discoveries That Could Benefit From a Shifting Monetary Order?
As capital rotates toward gold, silver, and real assets amid the structural pressures outlined above, Discovery Alert's proprietary Discovery IQ model delivers real-time alerts on significant ASX mineral discoveries — instantly translating complex data across 30-plus commodities into clear, actionable insights for investors at every level. Explore Discovery Alert's dedicated discoveries page to understand why historic mineral discoveries have generated extraordinary returns, and begin your 14-day free trial today to position yourself ahead of the market.