
June 22, 2026
How Market Psychology Shapes Investment Cycles in Precious Metals
Understanding investor behaviour during economic uncertainty requires examining the psychological forces that drive capital allocation during stress periods. When traditional financial assets lose their appeal amid economic deceleration and geopolitical tensions, market participants exhibit predictable patterns in their flight toward alternative stores of value. This behavioural framework becomes particularly relevant when analysing the gold price forecast 2026, as psychological factors often amplify fundamental drivers beyond what pure economic models would suggest.
The convergence of recessionary signals and energy market disruptions creates a unique environment where multiple investor psychology triggers activate simultaneously. Rather than isolated market movements, these conditions produce cascading effects that reshape portfolio allocation strategies across institutional and retail segments alike.
When big ASX news breaks, our subscribers know first
What Economic Indicators Signal Gold's Upward Trajectory?
GDP Growth Deceleration Analysis
Economic growth momentum has shifted dramatically as measured by key performance indicators. Real GDP expansion slowed to just 0.7% on an annualised basis in Q4 2025, representing a substantial decline from earlier projections and historical averages. This deceleration pattern mirrors conditions that have historically preceded significant economic downturns.
The manufacturing sector has contracted for multiple consecutive months, with the ISM Manufacturing PMI remaining below the critical 50 threshold. This sustained contraction indicates industrial activity is shrinking rather than expanding, creating a ripple effect through employment markets and consumer confidence measures.
| Economic Indicator | Current Reading | Historical Significance |
|---|---|---|
| Real GDP Growth | 0.7% annualised | Below recessionary threshold |
| Manufacturing PMI | Sub-50 (contracting) | Multi-month weakness |
| Consumer Confidence | Declining trend | Future expectations weakening |
| Jobless Claims | Rising trajectory | Labour market deterioration |
Labour Market Stress Indicators
Employment data reveals concerning trends that support precious metals positioning. Initial jobless claims have been climbing since late 2025, approaching levels that historically trigger Federal Reserve policy responses. The pace of deterioration suggests labour market conditions are weakening faster than many economists anticipated.
Consumer confidence surveys indicate future economic expectations are declining more rapidly than current condition assessments. This pattern has preceded recessions by 6-12 months in previous cycles, suggesting investors should prepare for continued economic weakness through 2026.
How Do Energy Market Disruptions Amplify Gold Demand?
Oil Price Transmission Mechanisms
WTI crude oil trading near $97 per barrel creates inflationary pressure through multiple transmission channels. Energy costs flow directly into transportation, manufacturing, and consumer goods pricing, while supply chain disruptions amplify these effects across the broader economy.
The Strait of Hormuz represents a critical vulnerability point, with approximately 20% of global oil trade passing through this waterway. Military tensions and shipping route threats in this region have created risk premiums that extend beyond immediate energy markets into broader economic uncertainty.
Historical precedent demonstrates the power of energy shocks to reshape economic conditions rapidly. When oil prices surged to $115 per barrel during the Russia-Ukraine conflict, headline CPI reached nearly 9% within months, illustrating how quickly energy disruptions translate into broader inflationary pressure.
Inflation Dynamics and Fed Policy Constraints
Current inflation readings present a complex picture that challenges traditional monetary policy responses. Headline CPI at 2.4% appears manageable, but core CPI running at 2.5% suggests underlying price pressures remain elevated. This inversion pattern often indicates inflationary momentum may be stronger than surface-level data suggests.
The Federal Reserve faces an increasingly difficult policy environment where traditional tools may prove inadequate. Cutting interest rates to combat recession risks could worsen inflation, while maintaining tight policy could accelerate economic deterioration. Furthermore, this policy paralysis historically benefits gold as investors seek alternatives to both currencies and traditional assets.
What Role Does Stagflation Play in Gold's Investment Case?
Economic Scenario Analysis
Stagflation represents the most challenging macroeconomic environment for policymakers and the most favourable for precious metals. This condition combines weak economic growth requiring monetary stimulus with elevated inflation making such stimulus counterproductive.
The 1970s stagflationary period provides compelling historical context, where gold appreciated from approximately $35 to over $800 per ounce between 1971 and 1980. This 2,000%+ return occurred as traditional asset classes struggled with the dual pressures of economic weakness and currency debasement.
Portfolio Positioning During Economic Uncertainty
Investment strategy during stagflationary conditions requires understanding how different asset classes perform under these unique circumstances. Consequently, investors must carefully consider bull market catalysts that drive precious metals performance:
- Equities typically underperform as corporate earnings weaken amid economic slowdown
- Bonds face pressure from inflation expectations and potential central bank policy errors
- Commodities benefit from supply constraints and currency debasement concerns
- Gold serves as both inflation hedge and safe-haven asset simultaneously
How Do Technical Patterns Support Higher Gold Prices?
Long-Term Chart Structure Analysis
Gold's technical foundation reflects a multi-year pattern completion that supports continued upward movement. The breakout above $2,075 in 2024 represented the completion of a massive cup-and-handle pattern that had been forming since 2011, suggesting the recent rally represents a structural shift rather than temporary momentum.
Current record high gold prices near $5,600 establish new psychological and technical reference points, while key support levels provide downside protection:
- $5,000: Primary support representing first major retracement level
- $4,800: Secondary support at ascending wedge boundary
- $4,400: Deeper support from October 2025 breakout level
Momentum Indicator Considerations
Technical momentum indicators suggest caution regarding the pace of future advances while maintaining bullish structural outlook. RSI readings have reached elevated levels similar to those seen in 1973, 1980, and 2008, periods that preceded significant corrections within ongoing bull markets.
However, these corrections did not mark the end of secular bull trends. Instead, they represented healthy consolidation phases that attracted additional buyers and created stronger foundations for subsequent rallies toward higher targets.
Which Financial Institutions Project the Highest Targets?
Major Bank Forecast Analysis
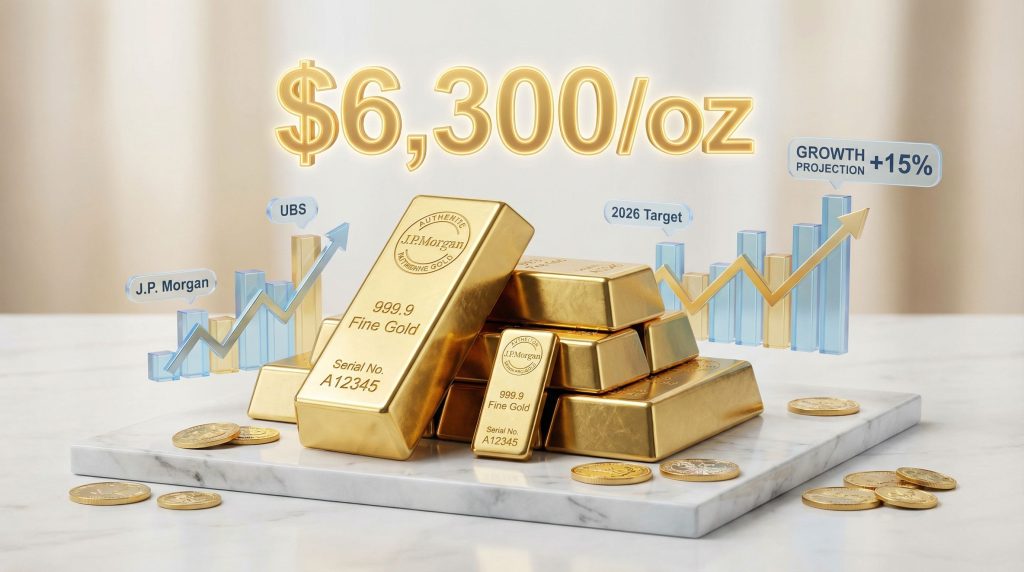
Investment banking research divisions have published increasingly bullish gold price forecast 2026 projections as economic conditions deteriorate:
| Institution | 2026 Target | Primary Drivers |
|---|---|---|
| J.P. Morgan | $6,300/oz | Central bank buying, ETF flows |
| UBS | $6,200-$7,200/oz | Bull market momentum continuation |
| Bank of America | $6,000/oz | Fed uncertainty, allocation shifts |
| Deutsche Bank | $6,000/oz | Sustained demand fundamentals |
| Goldman Sachs | $5,400/oz | Conservative currency debasement trade |
Analytical Methodology Comparison
These forecasts reflect different analytical approaches and assumption sets. J.P. Morgan emphasises physical market dynamics and institutional demand, while Goldman Sachs focuses more conservatively on monetary debasement scenarios. UBS provides the widest target range, acknowledging uncertainty while maintaining optimistic upside potential.
The convergence around $6,000+ targets across multiple institutions suggests broad consensus regarding significant upside potential, even among traditionally conservative forecasting teams. Moreover, JPMorgan's analysis demonstrates particular confidence in sustained demand fundamentals.
The next major ASX story will hit our subscribers first
How Do Central Bank Purchases Influence Price Discovery?
Official Sector Demand Quantification
Central bank gold purchases have accelerated to levels not seen since the 1950s, with 850 tonnes accumulated in 2025 representing approximately 26% of annual mine output. This institutional demand creates persistent upward pressure on physical markets while reducing available supply for private investors.
Projected 2026 purchases of 800 tonnes suggest this trend will continue, driven by reserve diversification objectives and geopolitical hedging strategies. The geographic distribution of buying activity spans emerging markets seeking alternatives to dollar-denominated reserves.
Market Structure Impact
Official sector purchases affect price discovery mechanisms differently than private investment flows. Central banks typically buy physical metal for long-term holding rather than trading, effectively removing supply from circulation. This dynamic creates structural tightness in physical markets that can amplify price movements during periods of increased private demand.
The absorption capacity for continued central bank buying remains substantial, particularly as institutions seek portfolio diversification away from traditional reserve assets that carry counterparty and currency risks.
What Currency Dynamics Support Gold's Appreciation?
Dollar Index Technical Analysis
The U.S. Dollar Index recently tested critical support near 96, representing the lower boundary of a long-term ascending channel. Currency weakness typically provides tailwinds for gold prices, as international investors find dollar-denominated gold more affordable and attractive.
Should the dollar break below this support level amid recession fears and capital rotation, the next technical target would be approximately 90. Historical analysis shows dollar weakness of this magnitude has corresponded with major precious metals rallies.
Multi-Currency Perspective
Gold's appeal extends beyond dollar-denominated investors, as currency debasement concerns affect multiple monetary systems simultaneously. European investors face their own inflation challenges, while emerging market currencies experience periodic devaluation pressures that drive local gold demand.
In addition, the purchasing power parity framework suggests gold may be catching up to decades of currency depreciation rather than simply experiencing speculative appreciation. This fundamental revaluation process could support sustained upward movement even beyond immediate economic stress factors.
How Should Investors Position for Stagflationary Scenarios?
Portfolio Allocation Framework
Strategic positioning for stagflationary conditions requires understanding how different economic scenarios affect optimal gold allocations:
| Economic Environment | Suggested Gold Weighting | Primary Rationale |
|---|---|---|
| Recession + Deflation | 5-10% | Safe-haven demand, monetary response |
| Stagflation | 10-20% | Dual inflation hedge and safety |
| Growth + Inflation | 5-15% | Partial purchasing power protection |
| Growth + Deflation | 0-5% | Opportunity cost versus growth assets |
Implementation Considerations
Physical ownership eliminates counterparty risks that become increasingly relevant during economic stress periods. Paper gold alternatives like ETFs provide liquidity advantages but introduce institutional dependencies that may prove problematic during financial system stress.
The choice between physical ownership and financial instruments depends on individual circumstances, but the stagflationary scenario argues for increased physical allocation given the potential for broader financial system challenges.
What Are the Primary Risks to Gold's Bull Market?
Economic Recovery Scenarios
The primary downside risk to gold involves stronger-than-expected economic recovery that reduces safe-haven demand and creates opportunity costs relative to growth-oriented assets. Robust GDP growth resumption could pressure precious metals if accompanied by stable energy prices and reduced geopolitical tensions.
Federal Reserve policy normalisation represents another significant risk factor. If economic data improves sufficiently to warrant sustained interest rate increases, the opportunity cost of holding non-yielding gold could become more significant for yield-oriented investors.
Technical Correction Possibilities
Even within secular bull markets, corrections of 20-40% have occurred historically as momentum indicators reset and profit-taking activities emerge. Current RSI readings suggest some consolidation may be healthy for the long-term uptrend structure.
However, technical performance analysis indicates corrections within precious metals bull markets typically represent buying opportunities rather than trend reversals, particularly when fundamental drivers remain intact.
Which Investment Vehicles Offer Optimal Gold Exposure?
Physical vs. Financial Instruments
Investment vehicle selection affects both risk profile and return characteristics:
| Option | Counterparty Risk | Storage Requirements | Liquidity | Tax Treatment |
|---|---|---|---|---|
| Physical Coins/Bars | None | Significant | Moderate | Capital gains |
| Gold ETFs | Custodian dependent | None | High | Capital gains |
| Mining Equities | Operational/market | None | High | Dividend + capital |
| Futures Contracts | Clearinghouse | None | Highest | Mark-to-market |
Due Diligence Requirements
Physical ownership requires careful consideration of storage security, insurance coverage, and regulatory compliance. Professional vault storage eliminates many risks associated with home storage while maintaining the benefits of direct ownership.
ETF selection should focus on physically-backed funds with established custodial arrangements and transparent reporting. Synthetic or futures-based funds introduce additional complexity and risks that may not align with long-term wealth preservation objectives.
What Leading Indicators Should Gold Investors Monitor?
Economic Data Priority List
Key economic indicators for gold price forecast 2026 monitoring include:
- Real GDP growth trajectories: Quarterly readings and recession probability models
- Manufacturing PMI trends: Sustained readings below 50 indicate continued weakness
- Employment market signals: Jobless claims, participation rates, wage growth patterns
- Inflation expectations: TIPS breakeven rates and consumer price index evolution
Market-Specific Metrics
Gold-specific indicators provide insight into supply-demand dynamics and investor sentiment:
- ETF flow data: Institutional and retail investor positioning changes
- Futures market positioning: Commercial versus speculative trader net positions
- Physical demand proxies: Coin sales, jewellery consumption, industrial usage patterns
- Central bank activity: Official sector purchases and reserve diversification trends
Strategic Implementation for Precious Metals Exposure
The convergence of economic deceleration, energy market disruptions, and monetary policy constraints creates a compelling fundamental backdrop supporting the gold market surge toward targets of $6,000 or higher. Technical analysis reinforces this view through sustained uptrend patterns and institutional forecasting consensus.
Risk-adjusted implementation suggests gold allocations of 5-15% in diversified portfolios, with higher weightings justified during stagflationary conditions. Physical ownership provides optimal protection during economic stress periods, while ETF exposure offers tactical positioning flexibility.
The success of this investment thesis depends on continued economic weakness, sustained geopolitical tensions, and accommodative monetary policy responses. Key monitoring points include GDP growth returning above 2%, oil prices falling below $80, or Federal Reserve policy turning decisively hawkish.
Investment Disclaimer: This analysis is for educational purposes only and does not constitute financial advice. Past performance does not guarantee future results. Precious metals investing involves risks including potential loss of principal. Consult qualified financial professionals before making investment decisions.
Ready to Position Yourself for the Next Precious Metals Discovery?
Discovery Alert's proprietary Discovery IQ model delivers instant notifications on significant ASX mineral discoveries, empowering subscribers to identify actionable opportunities in gold, precious metals, and other commodities before the broader market responds. Start your 14-day free trial today to gain the market-leading advantage that comes from discovering tomorrow's opportunities today.

