Understanding the Current State of the Metals and Mining Industry
The metals and mining industry has experienced significant volatility and transformation in 2024, with several commodities reaching remarkable price points. Gold has surpassed the $3,000 per ounce threshold, creating exceptional profit margins for producers who maintain disciplined operational approaches. Recent gold price trends and investment insights show that this price level provides approximately 50% margins for efficient miners with well-managed all-in sustaining costs (AISC).
Copper recently reached an all-time high of around $12,000 per ton, driven by a combination of supply concerns and speculation regarding potential tariffs. This price surge has intensified interest in copper mining projects, though many face significant permitting challenges.
Meanwhile, silver has demonstrated its monetary metal characteristics by tracking gold more closely than copper, with a correlation coefficient of 0.87 compared to 0.63 with copper. This alignment highlights silver's dual role as both a precious and industrial metal, as detailed in the latest gold and silver market recap: key trends.
In contrast, uranium prices have declined to the low-to-mid $60s range, significantly below the industry's current incentive price of $70-80 per pound. This price gap has created challenges for new project development, with approximately 75% of planned uranium projects requiring prices above $70/lb to achieve economic viability.
Perhaps most notably, mining companies across sectors are demonstrating improved financial discipline compared to previous market cycles. This prudent approach has contributed to expanded margins and increased investor confidence.
Key Market Trends in 2024
Gold's remarkable performance has been accompanied by significant ETF inflows totaling approximately $12 billion year-to-date, demonstrating strong institutional demand. Producer margins have expanded substantially, with top-tier miners achieving AISC margins around $1,400 per ounce compared to the industry average of $1,100 per ounce.
Copper's price surge can be partially attributed to potential tariff policies, with Trump's copper tariff proposal triggering a 22% price increase in Q2 2024 before stabilizing. Additionally, supply disruptions have contributed to market tightness, with Panama's Cobre Panama mine closure removing approximately 1.5% of global copper supply.
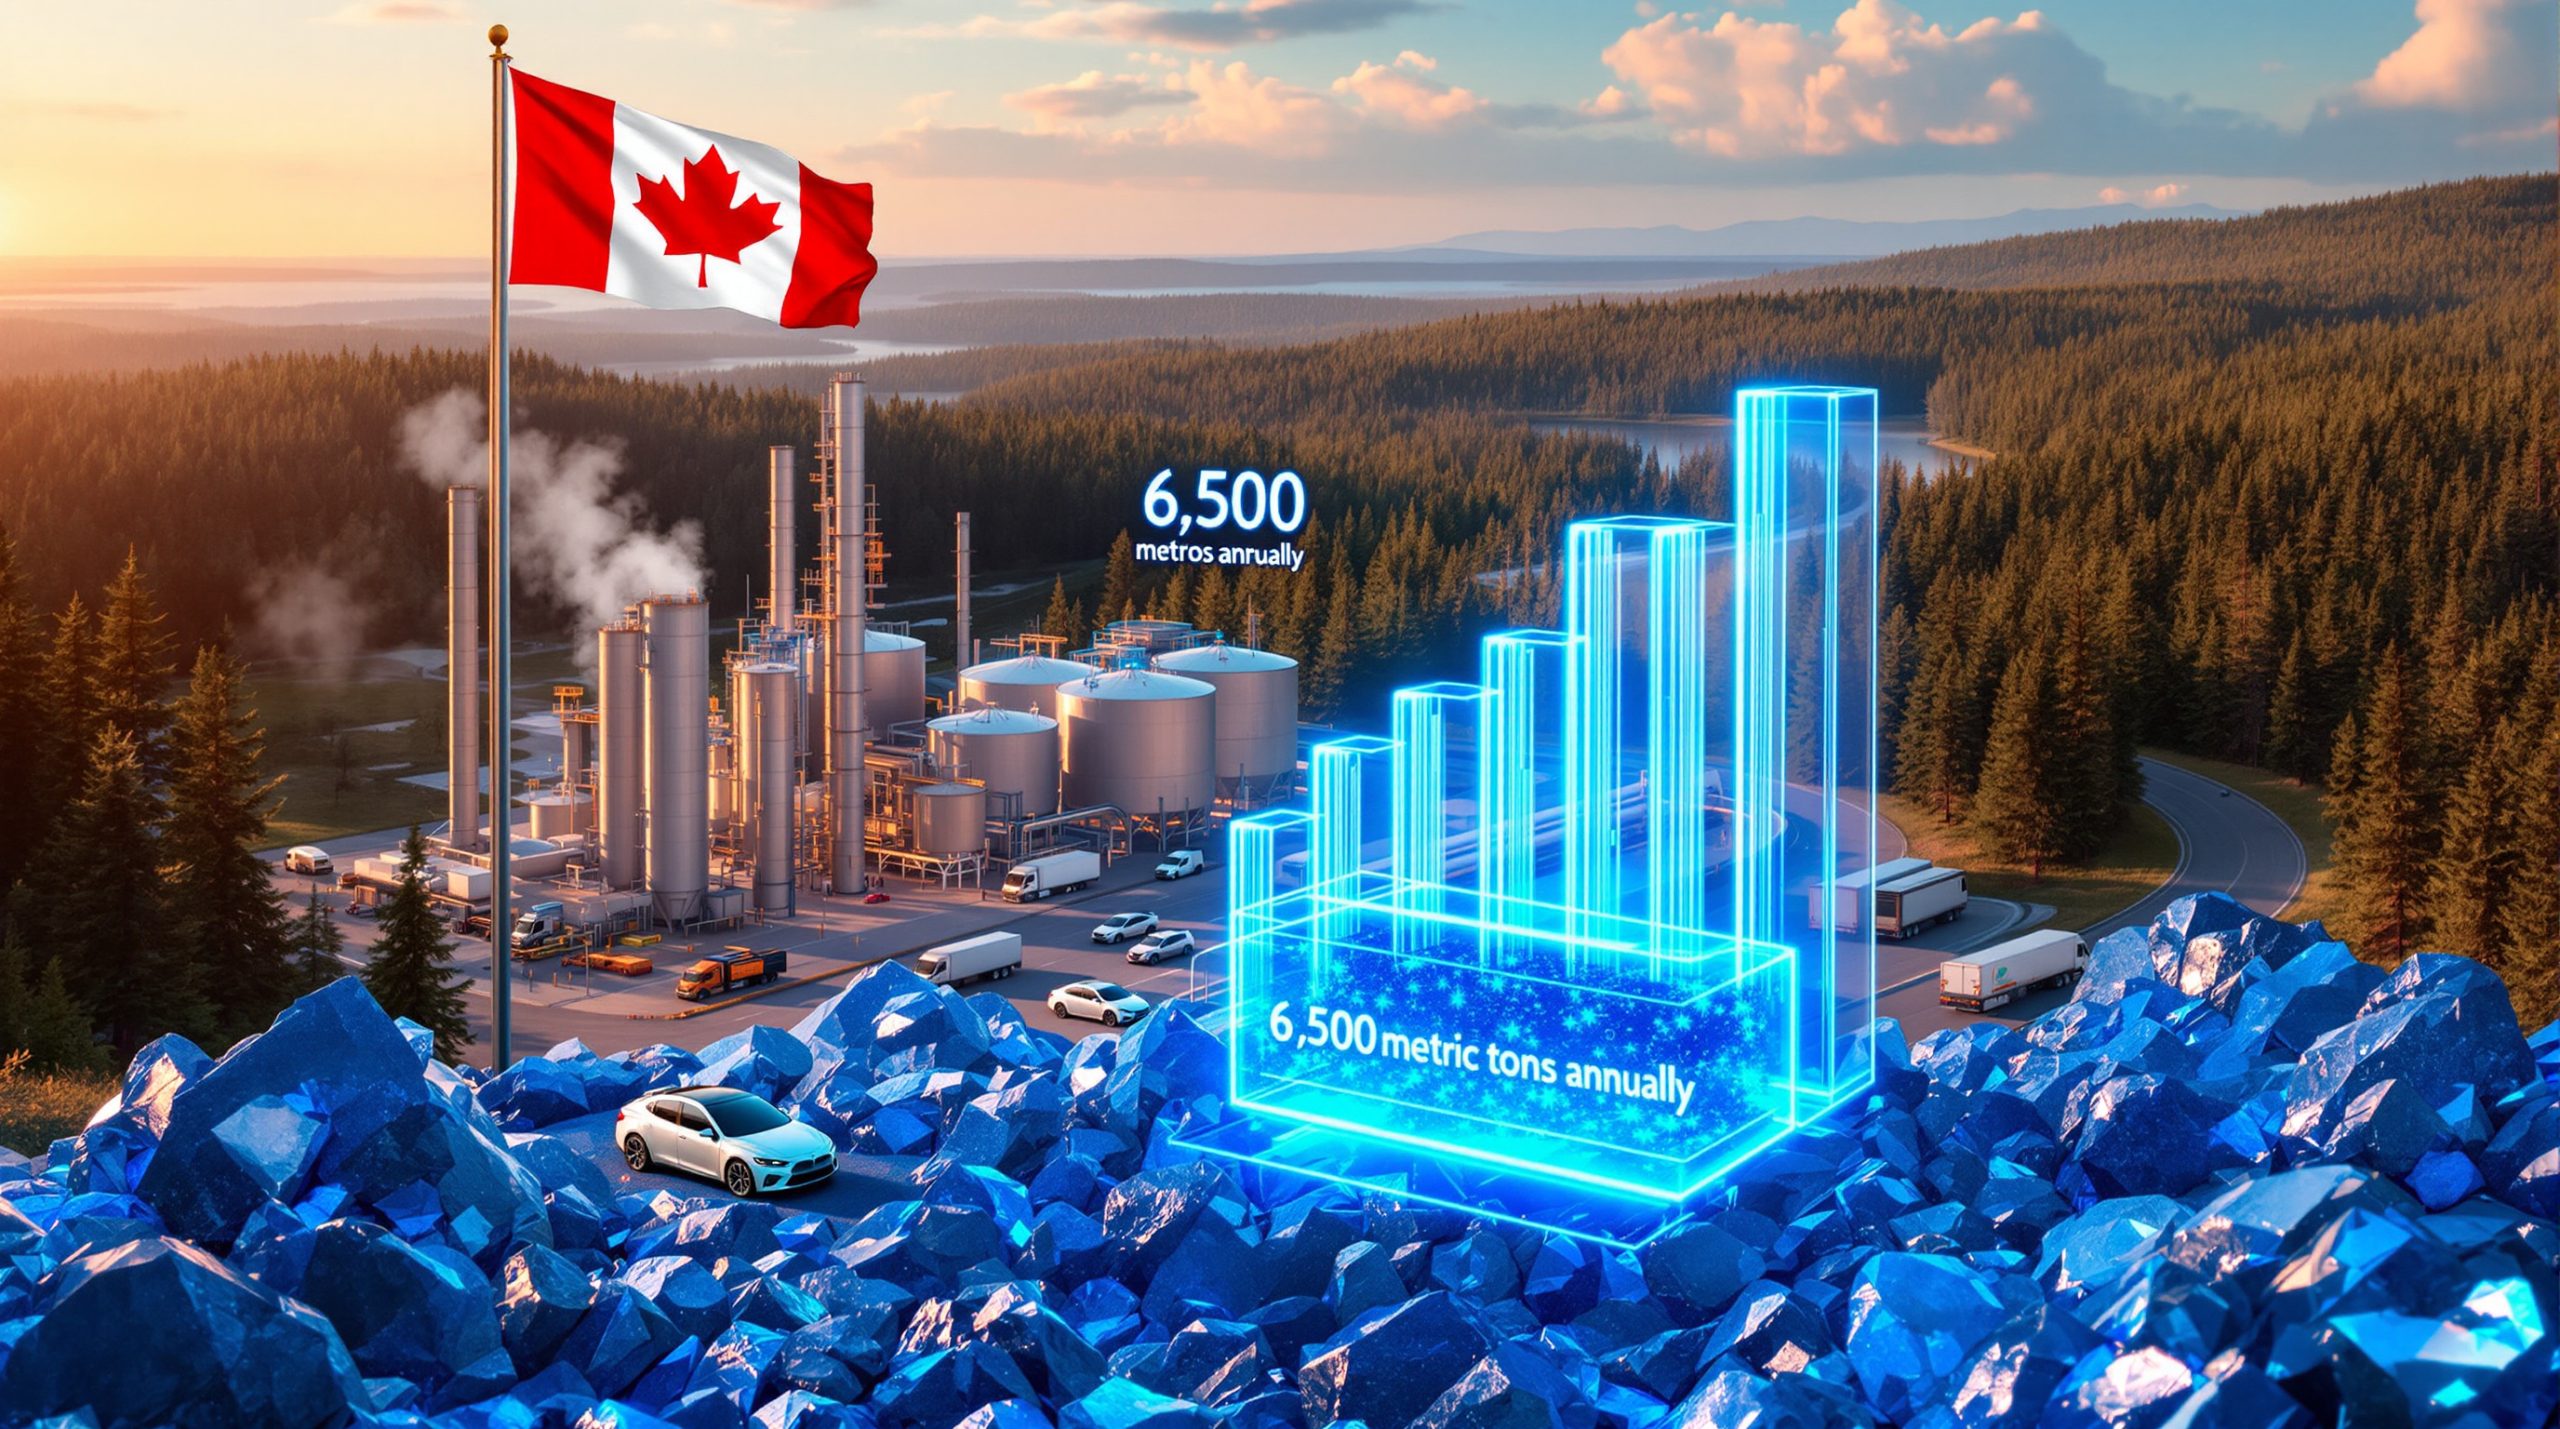
Silver's five-year supply deficit has reached a cumulative shortfall equivalent to six months of global production. The photovoltaic sector now consumes around 8,500 tons annually, representing 12% of total silver demand—a percentage that continues to grow with renewable energy expansion.
The uranium market faces ongoing challenges despite long-term fundamental strength. Kazatomprom, the world's largest uranium producer, revised its 2024 production targets downward by 15% due to workforce shortages and operational difficulties, highlighting the supply-side constraints in this sector. For a more comprehensive understanding, the uranium mining market analysis and investment strategies provides valuable insights into current market dynamics.
How Macroeconomic Factors Are Influencing Mining Stocks
The persistent inflationary environment continues to support commodity prices broadly, with mining stocks outperforming the S&P 500 by approximately 18% during 2024's 6.2% inflation period. Metals and mining companies often function as effective inflation hedges during such economic conditions.
Market dynamics have shifted substantially, with what some analysts call the "Trump shock" becoming a more significant market driver than Federal Reserve decisions. As one industry expert noted, "Markets now react more to Trump's tweets than Fed rate decisions – we've entered a 'Trump Shock' era for commodities." Understanding how Trump's policies are reshaping global commodity markets has become essential for investors in the sector.
Potential tariffs have created substantial price volatility, particularly in copper, where a 10% tariff could potentially raise U.S. construction costs by an estimated $15 billion annually. This policy uncertainty has contributed to both opportunities and challenges for mining investors.
Permitting reform initiatives could significantly accelerate the development of new mining projects, with proposals aiming to reduce U.S. mine approval timelines from the current 7-10 years to less than 2 years. This potential regulatory shift could unlock considerable value in domestic mining projects that have faced decades of delays.
Supply chain concerns, particularly for critical minerals, are driving increased interest in domestic mineral production. According to the International Council on Mining and Metals, the U.S. critical minerals executive order targets 12 high-priority metals, including uranium and gold, reflecting growing recognition of resource security importance.
How to Evaluate Mining Companies
Successful mining investment requires a structured analytical approach that combines macroeconomic understanding with detailed company-specific due diligence. The most profitable mining investors typically build a comprehensive framework before making individual investment decisions.
Establishing a Macro Framework for Mining Investments
Begin with a big-picture view of global economic trends, assessing how factors like inflation, interest rates, and geopolitical developments might impact commodity demand. During inflationary periods, precious metals typically outperform, while industrial metals often thrive during periods of economic expansion.
Identify which commodities are positioned for growth based on supply/demand fundamentals rather than short-term price movements. This approach requires examining production pipelines, depletion rates at existing mines, and emerging demand drivers like electrification or renewable energy development.
Focus on areas within your expertise rather than chasing unfamiliar sectors. As one mining expert advises: "The best operators aren't just surviving at $3,000 gold – they're generating 20%+ free cash flow yields." This level of performance separates exceptional companies from mere commodity price beneficiaries.
Consider the overall sector direction before evaluating individual companies, as even excellent operators struggle when their commodity sector faces structural decline. Mining success is highly dependent on underlying commodity price trends due to the capital-intensive nature of the business.
Recognize jurisdictional risk differentials across mining regions. For example, African gold projects typically require 4-7% higher internal rate of return (IRR) thresholds compared to North American assets to compensate for increased political and operational uncertainties.
Key Financial Metrics for Mining Stock Analysis
All-in sustaining cost (AISC) margins provide the most comprehensive view of a mining company's operational efficiency. This metric includes operating costs, sustaining capital, corporate overhead, and exploration expenses, offering a true picture of what it costs to maintain current production levels.
Free cash flow generation demonstrates a company's ability to convert resource extraction into shareholder value. Top-tier miners with disciplined capital allocation are currently achieving free cash flow yields exceeding 20% at current commodity prices, a stark contrast to previous cycles.
Debt-to-equity ratios indicate financial stability and flexibility. Companies maintaining ratios below 0.3x outperformed their more leveraged peers by approximately 33% in 2024, highlighting the importance of balance sheet strength in the metals and mining industry.
Production growth projections reveal future potential, but must be critically evaluated against a company's historical execution. Companies frequently miss production targets due to technical challenges, permitting delays, or overly optimistic engineering assumptions.
Reserve replacement costs offer insights into exploration efficiency. Tier-1 gold producers typically spend £150-200 per ounce on reserve replacement, compared to £350 per ounce for junior companies, demonstrating the scale advantages of major producers.
Due Diligence Process for Mining Investments
Thoroughly review financial statements beyond company presentations, with particular attention to footnotes regarding resource calculations and valuation assumptions. Marketing materials often emphasise favourable scenarios while downplaying risks.
Verify claims through independent geological assessments when possible. Third-party engineering reports provide valuable validation of company-provided resource estimates and development timelines.
Evaluate management team's track record and experience, particularly their history in similar jurisdictions and with comparable deposit types. Successful mining executives typically have at least 10 years of experience in the specific regions where they operate.
Consider jurisdictional risks and permitting timelines, which vary dramatically across locations. The Arizona Resolution Copper project, for example, remains stalled after 24 years of permitting battles, illustrating the extreme delays possible in challenging regulatory environments.
Assess technical feasibility of projects and production timelines through a comprehensive due diligence checklist covering:
- Management track record (minimum 10 years in jurisdiction)
- Third-party engineering reports verification
- ESG compliance history
- Offtake agreement terms
- Contingency planning for permit delays
Gold Mining Sector Analysis
The gold mining sector has entered a period of exceptional profitability combined with improved operational discipline, creating opportunities for both companies and investors.
Why Gold Producers Are Outperforming Previous Cycles
Mining companies are demonstrating better capital discipline than in previous bull markets, focusing on margin expansion rather than production growth at any cost. This shift represents a fundamental change in management philosophy from past cycles.
All-in sustaining cost margins are expanding alongside gold price increases, with top-quartile producers maintaining AISC around £1,600 per ounce. This cost discipline creates substantial margin expansion as gold prices approach $3,000 per ounce.
Unlike previous cycles where a 7x increase in gold price led to decreasing free cash flow due to cost inflation and reckless expansion, today's producers are prioritising shareholder returns. This focus on return on invested capital has rebuilt investor confidence after the disappointments of previous bull markets.
Major producers are delivering improved financial results, with debt reduction, dividend increases, and share repurchases becoming common. The sector's average debt-to-equity ratio has declined significantly, reducing financial risk.
Market confidence is returning as miners demonstrate operational discipline. As one gold mining analyst observed, "Gold producers are delivering expanded margins without repeating past mistakes of reckless spending. This discipline is rebuilding market confidence."
What's Driving M&A Activity in Gold Mining
Gold deals predominantly involve production-stage companies in Australia and Canada, reflecting the premium valuation placed on assets in politically stable jurisdictions. Recent copper M&A strategies (2013–2024) have shown similar patterns, with the 2024 total for gold sector M&A reaching approximately $18 billion and average deal premiums around 32%.
Major consolidation has occurred at the top tier, exemplified by the Newmont-Newcrest merger which achieved approximately $500 million in annual cost savings through operational synergies. This transaction reduced the universe of major gold producers available for investment.
The universe of major producers has significantly contracted, with fewer large-cap options available to investors seeking exposure to gold mining. This consolidation has created a more concentrated industry structure at the top tier.
Single-asset mid-tier producers are likely acquisition targets, particularly those with 2 million ounce-plus resources trading at discounted valuations. Mid-tier companies currently trade at approximately 0.8x price-to-net asset value compared to 1.3x for senior producers, creating valuation gaps that drive acquisition interest.
Companies must acquire reserves to replace depleted resources, with the top five gold majors needing to acquire approximately 42 million ounces annually to maintain production levels. This replacement imperative drives ongoing M&A activity regardless of market conditions.
How to Approach Gold Mining Investments
Consider a barbell approach with both major producers and junior explorers, avoiding the middle tier where companies often lack both scale advantages and exploration upside. This strategy provides exposure to both production stability and discovery potential.
Focus on operators with proven track records of delivering to the bottom line rather than those promising dramatic production growth. Historical execution provides the most reliable indicator of future performance.
The better operators significantly outperformed gold price increases in 2024, delivering share price appreciation exceeding the underlying commodity movement. This outperformance demonstrates the leverage potential of well-managed mining companies.
ETFs like GDX may underperform due to inclusion of weaker companies that dilute overall returns. The broad-based nature of these instruments prevents investors from concentrating capital in the highest-quality operators.
Selective stock picking can provide better leverage to gold price increases for investors willing to conduct thorough due diligence. The performance dispersion between top and bottom quartile producers frequently exceeds 50% annually.
Silver Market Outlook
Silver presents a unique investment case due to its hybrid nature as both a precious and industrial metal, creating multiple demand drivers.
Why Silver Is Showing Strength in 2024
Silver is tracking gold more closely than copper, emphasising its monetary characteristics during periods of economic uncertainty. The correlation coefficient between silver and gold has strengthened to 0.87 in 2024, compared to just 0.63 with copper.
The metal offers dual exposure to both precious and industrial demand, creating a favourable dynamic during inflationary periods with ongoing industrial growth. This combination provides more potential catalysts than gold, which relies primarily on investment demand.
Under inflationary conditions, silver has more potential upside drivers than gold, benefiting from both safe-haven buying and industrial consumption growth. This dynamic creates what one analyst describes as a "win-win scenario" under inflationary pressures.
Silver would need to reach triple digits (inflation-adjusted) to match previous all-time highs. The 1970s inflation-adjusted peak would equate to approximately $120 per ounce in today's pounds, suggesting significant potential upside from current levels.
The metal has been in a five-year supply deficit according to industry reports, with the cumulative shortfall now equaling about six months of global production. This sustained deficit has gradually reduced above-ground inventories available for industrial consumption.
Industrial vs. Monetary Drivers for Silver
Silver functions as a "financial alloy" of gold and copper, with price behavior reflecting elements of both metals depending on market conditions. This hybrid nature creates unique investment characteristics not found in other commodity markets.
Industrial demand provides an additional growth driver beyond monetary factors, with the photovoltaic sector now consuming around 8,500 tons annually, representing 12% of total silver demand. This percentage continues to increase with solar energy deployment.
Electrification trends support industrial consumption through multiple applications including electric vehicles, charging infrastructure, and renewable energy generation. Each electric vehicle contains approximately 25-50 grams of silver in various electronic components.
Monetary demand increases during inflationary periods as investors seek tangible assets with historical preservation of purchasing power. This investment demand remains substantial despite the digital age, with physical silver investment accounting for approximately 20% of annual demand.
This dual nature can create a "win-win" scenario under the right economic conditions, particularly during periods of inflation accompanied by industrial growth. Few other commodities benefit from this combination of demand drivers.
Separating Signal from Noise in Silver Analysis
Many sensationalist claims about imminent price explosions have proven false, damaging credibility within the silver investment community. These extreme predictions typically ignore fundamental supply/demand dynamics in favour of conspiracy theories.
Focus on fundamental supply/demand dynamics rather than conspiracy theories about market manipulation or imminent shortages. While short-term price movements can be volatile, longer-term trends typically reflect physical market realities.
Short-term coordinated buying efforts ("buy silver day") are unlikely to create sustainable price movements in a market with global depth and liquidity. These social media campaigns generate headlines but rarely impact longer-term price trends.
Long-term structural factors are more important than short-term trading patterns, with particular attention to industrial growth in solar and electronic applications. These demand drivers have created the five-year supply deficit currently supporting prices.
Current fundamentals appear bullish for silver prices based on continued industrial demand growth combined with monetary demand resilience. The combination of these factors suggests continued supply deficits without significant price increases to stimulate new production.
Copper Market Analysis
Copper's critical role in electrification and industrial growth has placed it at the centre of both economic and geopolitical considerations.
Why Copper Reached All-Time Highs in 2024
Price increases were driven largely by potential tariff concerns rather than supply disruptions, with Trump's copper tariff proposal triggering a 22% price surge in Q2 2024 before stabilising. This policy-driven volatility created both opportunities and challenges for copper investors.
Trump's executive order to examine copper tariffs created market uncertainty, highlighting the metal's strategic importance to industrial policy. The potential for 10% tariffs could raise U.S. construction costs by an estimated $15 billion annually.
Discussions about expediting mining permits for critical minerals including copper have intensified, with proposals aiming to reduce approval timelines from 7-10 years to less than 2 years. This regulatory shift could significantly impact future supply dynamics.
Underlying electrification and infrastructure trends support long-term demand, with AI and data center growth projected to increase copper consumption by approximately 250% by 2030. This technological transformation represents a substantial new demand driver.
Current price movements may include a "fear premium" that could be temporary if trade policy uncertainty resolves. However, fundamental supply constraints suggest sustained price strength regardless of short-term policy developments.
Long-Term Copper Supply Challenges
Permitting delays have prevented development of new mines in the U.S., creating a growing gap between domestic consumption and production. These regulatory barriers represent a significant constraint on increasing supply in politically stable jurisdictions.
Projects like the copper mine in Arizona have been in permitting for 20-30 years, demonstrating the extreme timeline challenges facing domestic development. The Resolution Copper project, despite containing one of the world's largest undeveloped copper resources, remains stalled after 24 years.
New copper mines require significant development lead times, typically 15-25 years from discovery to production, even with expedited permitting. This timeline creates substantial lags between price signals and supply responses.
DRC has expanded production, potentially offsetting some supply concerns, though raising ethical and supply chain security questions. The country's copper output has grown approximately 8% year
Ready to Spot the Next Major Mineral Discovery?
Stay one step ahead of the market with Discovery Alert's proprietary Discovery IQ model, which instantly analyses ASX announcements to identify significant mineral discoveries as they happen. Visit our discoveries page to see how historic mineral discoveries have created exceptional returns and start your 30-day free trial today.