June 22, 2026

What Are Copper Spheres of Control?
Copper spheres of control represent the geopolitical divisions of global copper production, categorizing countries based on their political, economic, and cultural alignments. These spheres highlight how global powers consolidate control over copper, a metal essential for renewable energy infrastructure, electronics, and industrial growth.
The Five Spheres Defined
The American Sphere (48.7% of global output) includes Chile, Peru, and the U.S., leveraging longstanding trade partnerships and advanced mining technologies. The Chinese Sphere (29.9%) centers on the Democratic Republic of Congo (DRC) and Central Asian nations, supported by Belt and Road Initiative investments. The Russian Sphere (10%) relies on Siberian deposits and partnerships with Kazakhstan, while the Coalition of the Willing (10%) comprises neutral states like Australia and Canada. The Undrafted Nations (1.9%) remain unaligned, often due to political instability or underdeveloped resources.
When big ASX news breaks, our subscribers know first
How Is Global Copper Production Distributed?
The distribution of copper production across these geopolitical spheres reveals significant power imbalances and potential vulnerabilities in global supply chains. With the American and Chinese spheres controlling nearly 80% of global output, smaller nations face increasing pressure to align with major powers to secure market access.
Production Breakdown by Sphere
-
American Sphere: Chile's Atacama Desert alone produces 27% of global copper, with U.S. projects in Arizona and New Mexico expanding domestic capacity. This sphere accounts for 48.7% of global copper output.
-
Chinese Sphere: The DRC's Kamoa-Kakula mine, operated by Zijin Mining, contributes 5% of global output, while Chinese-backed projects in Laos and Myanmar bolster regional dominance. This sphere represents 29.9% of global production.
-
Russian Sphere: Norilsk Nickel's Arctic mines account for 7% of production, though sanctions have limited access to Western technology. This sphere controls approximately 10% of global copper output.
-
Coalition of the Willing: These nations maintain neutrality while contributing about 10% of global copper production, often serving as swing suppliers during geopolitical tensions.
-
Undrafted Nations: Contributing just 1.9% of global output, these countries often possess underdeveloped resources with significant potential for future exploitation.
Key Production Countries
Chile's state-owned Codelco remains the world's largest copper producer, with ore grades averaging 0.6% copper content – significantly higher than the global average of 0.4%. Peru's Las Bambas mine (operated by MMG Limited) faces frequent disruptions due to community protests, with production losses estimated at 150,000 tons in 2023 alone.
The DRC's output is projected to double by 2030, driven by Chinese investments totaling $12 billion since 2020. Notably, the Congolese copper belt contains ore grades exceeding 3% in some locations, representing some of the highest-quality deposits globally.
Why Does American Sphere Dominate Copper Production?
The American Sphere's control of nearly half of global copper production stems from historical advantages, technological superiority, and strategic partnerships. Chile's copper industry, developed with significant U.S. investment since the 1950s, forms the backbone of this dominance.
Strategic Advantages
-
Supply Chain Security: The Inflation Reduction Act (2022) prioritizes domestic sourcing, with $6 billion allocated for critical mineral projects. U.S. companies are actively reshoring processing capabilities, reducing the 67% dependence on Chinese refineries reported in 2020.
-
Technological Edge: Automation and AI-driven exploration tools, developed by firms like Freeport-McMoRan, improve extraction efficiency by 20% compared to traditional methods. These technologies enable profitable extraction from lower-grade ores (below 0.3% copper content) that would otherwise be economically unviable.
-
Trade Leverage: American Sphere countries benefit from preferential access to Western markets, with reduced tariffs averaging 7.5% lower than those imposed on Chinese Sphere producers.
Key American Sphere Production Centers
The Chilean copper belt, producing 5.6 million metric tons annually, is bolstered by Free Trade Agreements (FTAs) ensuring preferential access to U.S. markets. The Escondida mine alone contains reserves sufficient for 54 years of production at current rates.
North American projects, such as Resolution Copper in Arizona, aim to reduce reliance on imports, which currently satisfy 35% of U.S. demand. When operational, Resolution will produce 25% of U.S. copper needs from a single location, though environmental permitting challenges have delayed development.
How Is China Expanding Its Copper Influence?
Despite trailing the American Sphere in overall production, China has implemented a comprehensive strategy combining resource acquisition, processing dominance, and geopolitical diplomacy. This multifaceted approach aligns with China's broader goal of industrial self-sufficiency.
Chinese Copper Strategy
China's Rio Tinto's copper strategy focuses on controlling the entire value chain, from mining to manufacturing. Over 60% of Africa's copper exports now flow to China, with the DRC and Zambia serving as key hubs. Chinese-backed operations typically employ a "resources for infrastructure" model, exchanging development projects for mining rights.
Chinese firms control 15% of global copper refining capacity, leveraging low-cost labor and state subsidies to undercut competitors. By 2025, China aims to process 40% of globally traded copper concentrate, creating a potential chokepoint for Western supply chains.
The integration of copper assets with the Belt and Road Initiative serves dual economic and geopolitical objectives. By financing port facilities, railways, and power plants in copper-rich regions, China creates dependencies that facilitate preferred access to resources.
Notable Chinese Sphere Operations
-
DRC Mining Operations: Sicomines, a $6.5 billion joint venture, produces 400,000 tons annually, with 70% exported to China. Chinese engineers have developed specialized techniques for extracting copper from DRC's unique oxide ores, achieving recovery rates 12% higher than Western competitors.
-
Central Asian Partnerships: The Belt and Road-funded Altyn-Topkan mine in Tajikistan secures access to untapped reserves containing an estimated 13 million tons of copper. Chinese geological surveys have identified deposits in Kyrgyzstan and Kazakhstan that were overlooked by Soviet-era exploration.
-
Southeast Asian Processing: China has established processing hubs in Myanmar and Laos that circumvent environmental regulations, processing copper concentrate with arsenic levels exceeding international standards. These facilities operate at 30% lower cost than comparable Western operations.
What Role Does Russia Play in Global Copper Markets?
Russia's copper industry, though smaller than its American and Chinese counterparts, provides strategic leverage through partnerships with former Soviet states. Russian copper assets are increasingly oriented toward Asian markets as Western sanctions limit access to technology and capital.
Russian Copper Assets
Russia's Udokan deposit, the largest undeveloped copper reserve globally, is projected to produce 400,000 tons annually by 2030, contingent on Chinese financing. The deposit contains 26.7 million tons of copper, but challenging Arctic conditions and permafrost have delayed development by decades.
Sanctions have redirected 80% of Russian exports to Asia, deepening ties with Beijing. Russian metallurgical companies have adapted by developing proprietary technologies to replace Western equipment, though at the cost of reduced efficiency.
Russian copper producers benefit from some of the world's lowest energy costs – approximately $0.04 per kWh compared to global averages of $0.11 – creating a competitive advantage in energy-intensive refining operations.
How Might Copper Control Shift in a More Polarized World?
Geopolitical realignment could significantly alter copper supply dynamics, particularly as climate policies accelerate demand for the metal. By 2035, global copper demand is projected to reach 50 million tons annually – double current production – driven by electric vehicle manufacturing and renewable energy infrastructure.
Potential Future Scenarios
Escalating U.S.-China trade tensions could force neutral nations like Indonesia and Mongolia to choose sides, potentially fragmenting global markets. Australian producers, currently supplying both Western and Chinese markets, face increasing pressure to prioritize "friendly" customers.
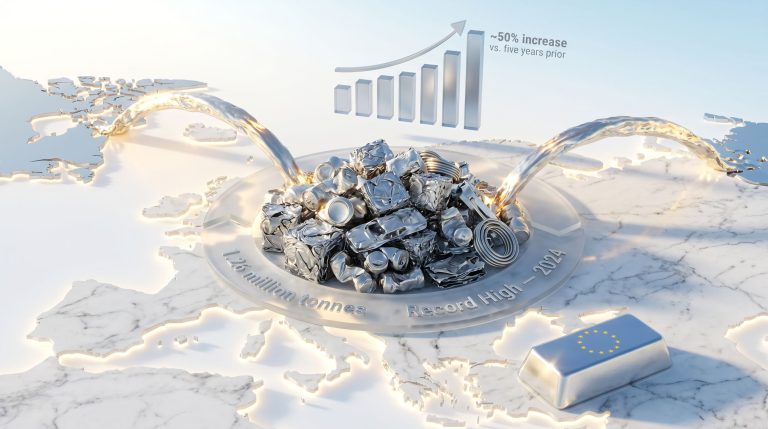
Recycling initiatives, such as the EU's Circular Economy Action Plan, aim to offset shortages by recovering 50% of copper from e-waste by 2030. This could reduce primary copper demand by 8 million tons annually, potentially weakening the leverage of major producing nations.
Technological innovation may reduce copper intensity in critical applications. Aluminum-based alternatives for electrical transmission could decrease copper requirements by 20% for equivalent performance, though at the cost of increased energy losses.
The next major ASX story will hit our subscribers first
What Are the Implications for Copper Markets and Prices?
The concentration of production within specific geopolitical spheres creates both price volatility and strategic vulnerabilities. Market participants increasingly factor geopolitical risk premiums into copper pricing models.
Market Considerations
Geopolitical tensions could increase price volatility, with "friendly" copper premiums rising 15–20% by 2030 as nations prioritize secure supply chains over lowest-cost options. The concept of "trusted copper" – produced in politically aligned nations with transparent environmental standards – is emerging as a market differentiator.
Supply chain vulnerabilities are particularly acute for semiconductor manufacturing, which requires 99.9999% pure copper. Only seven refineries globally can produce this grade, creating bottlenecks that could limit technological advancement.
The London Metal Exchange reports a 30% surge in speculative trading since 2023, reflecting investor anxiety over supply security. Hedge funds have created specialized "geopolitical disruption" instruments that profit from supply chain dislocations.
Recent copper smelting trends indicate significant shifts in processing capacity, with satellite data revealing unexpected activity spikes in regions facing political instability. These dynamics further complicate the ability of market participants to forecast price movements accurately.
FAQ: Understanding Copper Spheres of Control
What factors determine which sphere a country belongs to?
Countries are categorized based on geographic proximity, social ties, cultural connections, economic relationships, and potential alignments in a more polarized global environment. Trade patterns, particularly the destination of copper exports, serve as a key indicator, with nations sending over 60% of production to a specific sphere typically categorized accordingly.
Why is copper geopolitically significant?
Copper's unique properties – including electrical conductivity second only to silver, heat transfer capabilities, and antimicrobial properties – make it irreplaceable in modern infrastructure. The metal is essential for renewable energy technologies, with a single wind turbine requiring up to 4.7 tons of copper. Electric vehicles use 3-4 times more copper than conventional automobiles, making the metal central to decarbonization efforts as outlined in the IEA's critical minerals report.
How might trade wars affect copper sphere alignments?
Escalating trade tensions could force countries to choose sides, potentially reshaping the current distribution of copper production across spheres of influence. Tariffs specifically targeting copper products have already reached 25% in some markets, creating artificial price disparities that encourage realignment. Secondary effects include the emergence of transshipment hubs designed to obscure the origin of copper products.
What role does the "Coalition of the Willing" play?
This group represents nations that maintain independence from the major powers while still participating in global copper markets, providing alternative supply options during geopolitical tensions. Countries like Australia and Canada leverage their resource wealth to maintain autonomy, often supplying both Western and Asian markets. These nations frequently benefit from price premiums during periods of heightened tension, as buyers seek politically neutral suppliers.
The Future of Copper Geopolitics
As clean energy transitions accelerate, control of copper resources will increasingly influence global power dynamics. Nations that secure reliable access to the metal will gain advantages in renewable energy deployment, technological innovation, and economic growth.
The coming decade may see increased competition for the remaining "undrafted" copper resources, particularly in frontier regions like Central Africa and Central Asia. Western companies, backed by government incentives, are already reevaluating projects previously deemed marginal as supply security concerns outweigh purely economic calculations.
Understanding the geology of ore deposits becomes increasingly strategic as exploration focuses on politically stable regions. Companies must develop sophisticated geopolitical market strategies to navigate the complex landscape of copper spheres of control.
Ultimately, the infographic copper spheres of control highlight interdependence that may either exacerbate geopolitical tensions or encourage cooperation. The global copper market outlook suggests the metal's critical role in addressing climate change could potentially foster collaborative approaches to resource management, even among competing powers recognizing their shared interests in a stable supply chain.
Want to Profit from the Next Major Mineral Discovery?
Stay ahead of the market with Discovery Alert's proprietary Discovery IQ model that identifies significant ASX mineral discoveries as they happen, turning complex data into actionable investment insights. Explore why historic discoveries can generate substantial returns by visiting Discovery Alert's dedicated discoveries page.