Understanding the Dow-to-Gold Ratio: A Key Market Indicator for Investors
The Dow-to-Gold ratio represents a powerful financial metric that measures how many ounces of gold it takes to buy the entire Dow Jones Industrial Average. Unlike conventional indicators that rely solely on dollar values, this ratio offers a unique perspective by comparing stock market performance against gold—historically considered a store of value. This comparison effectively neutralizes currency inflation effects, revealing the true purchasing power relationship between these asset classes.
How the Ratio is Calculated
The calculation is straightforward: simply divide the current DJIA value by the current gold price per ounce in USD.
For example, using recent figures: with the Dow at approximately 40,000 points and gold trading at $2,000 per ounce, the ratio would be 20. This means it takes 20 ounces of gold to "buy" the Dow.
The Significance for Investors
This ratio provides crucial insights for investment strategy:
-
High Ratio: Suggests stocks are expensive relative to gold, potentially indicating market overvaluation
-
Low Ratio: Indicates gold is outperforming stocks, possibly signaling economic uncertainty
-
Trend Direction: The movement pattern can signal potential shifts in market sentiment
The ratio effectively functions as a currency-neutral valuation metric, providing a clearer picture of relative value between paper assets and physical gold. This perspective becomes particularly valuable during periods of significant monetary expansion.
How Has the Dow-to-Gold Ratio Evolved Historically?
The Dow-to-Gold ratio has experienced dramatic fluctuations throughout financial history, creating identifiable cycles that frequently correspond with major economic shifts.
Major Historical Cycles and Turning Points
| Period | Approximate Ratio | Market Environment |
|---|---|---|
| 1929 Peak | 18:1 | Stock market bubble before Great Depression |
| 1932 Low | 2:1 | Great Depression bottom |
| 1966 Peak | 28:1 | Post-war economic boom peak |
| 1980 Low | 1:1 | Stagflation era, gold bull market |
| 1999 Peak | 45:1 | Dot-com bubble height |
| 2011 Low | 5.5:1 | Post-financial crisis, gold bull market |
| Recent Years | 12-20:1 | Post-pandemic recovery period |
These historical cycles reveal a pattern where extreme readings often precede significant market reversals. When the ratio reaches historical extremes, it frequently signals potential investment opportunities as markets revert toward long-term averages.
The 26-Year Perspective: 1999 to Today
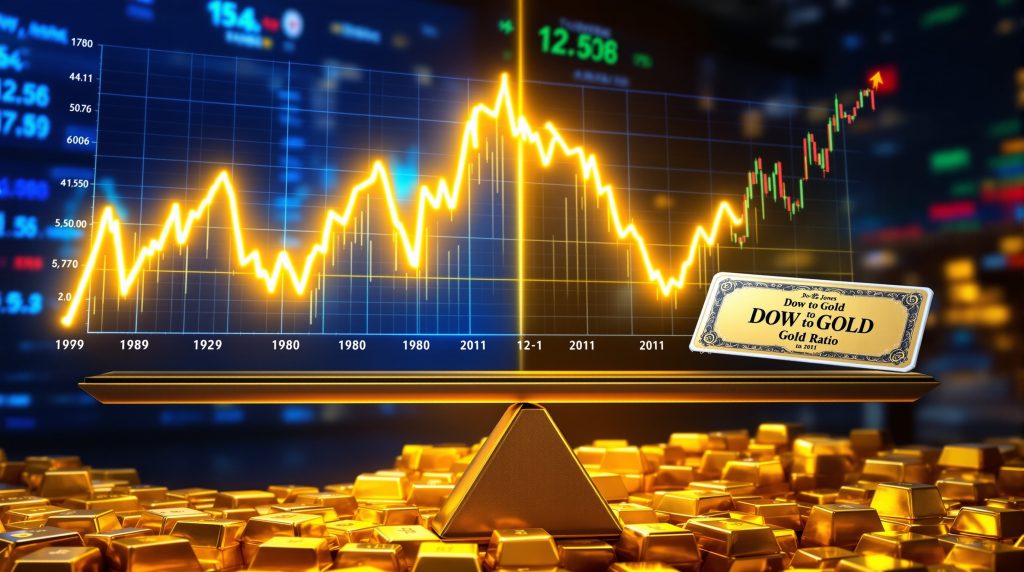
Looking at a specific 26-year window provides a particularly illuminating view of the ratio's significance. On August 25, 1999, the ratio reached a historic peak of approximately 45:1, with the Dow at 11,326 and gold at just $252 per ounce.
Fast forward to today, and the landscape has dramatically shifted. While the Dow has increased approximately 4 times (about 300%) from its 1999 value, gold has surged nearly 15 times (1,350%), pushing the ratio down to roughly 12:1.
This represents a 72% decline in the Dow's value when measured in terms of gold, despite nominal gains in dollar terms. Such divergence highlights a crucial reality: nominal price increases in stocks can mask substantial losses in real purchasing power when measured against historically stable stores of value like gold.
What Drives Changes in the Dow-to-Gold Ratio?
Understanding the factors that influence movements in this ratio can help investors anticipate potential shifts and position their portfolios accordingly.
Economic Factors Influencing the Ratio
Several key elements drive movements in the Dow-to-Gold ratio:
Monetary Policy and Interest Rates
Interest rate environments significantly impact the ratio:
-
High Rates: Traditionally favor stocks over non-yielding assets like gold
-
Low Rates: Reduce the opportunity cost of holding gold, potentially lowering the ratio
-
Rate Cutting Cycles: Contrary to common belief, aggressive rate cuts during economic downturns don't always boost stocks
For example, during the 2007-2009 financial crisis, the Federal Reserve cut interest rates from 6.5% to near-zero while markets continued declining by more than 50%. This historical example challenges conventional wisdom that rate cuts automatically support equity markets.
Inflation and Currency Devaluation
The ratio responds strongly to changes in purchasing power:
-
During periods of high inflation or currency devaluation, gold inflation hedge often outperforms stocks
-
When monetary stability prevails, stocks typically gain relative to gold
-
The U.S. dollar has lost over 90% of its value when priced in gold over the past 26 years
Market Psychology and Sentiment Cycles
Psychological factors play a crucial role in driving the ratio's movements:
-
The ratio often reflects shifts between optimism and pessimism in market sentiment
-
These sentiment cycles follow identifiable patterns that can be analyzed using frameworks like Elliott Wave theory
-
Extreme readings in either direction frequently coincide with major sentiment shifts
Elliott Wave analysis focuses specifically on these psychological patterns, tracking how investors move "from pessimism to optimism and optimism back to pessimism in a very patterned manner." This approach suggests that market psychology, rather than fundamental factors alone, drives many of the ratio's long-term movements.
How Can Investors Use the Dow-to-Gold Ratio?
The Dow-to-Gold ratio provides valuable signals for portfolio management and can help investors make more informed decisions about asset allocation.
Strategic Asset Allocation Based on Ratio Readings
Identifying Potential Market Extremes
-
Ratio Above 20: Historically suggests stocks may be overvalued relative to gold
-
Ratio Below 5: Often indicates potential undervaluation in stocks compared to gold
-
Trend Direction: The trajectory of the ratio can signal potential investment opportunities
During periods when the ratio reaches historical extremes, investors may consider adjusting their asset allocations to position for potential mean reversion.
Portfolio Rebalancing Considerations
Investors can use the ratio to inform asset allocation decisions:
-
When the ratio reaches historical highs, consider increasing gold allocation
-
During periods of extremely low ratios, equity exposure may present better value
-
The ratio serves as a guide for long-term strategic positioning rather than short-term trading
Case Study: 2007-2009 Financial Crisis
The 2007-2009 financial crisis provides a valuable case study for understanding the ratio's behavior during market stress:
-
As markets declined by more than 50%, the Federal Reserve aggressively cut interest rates from 6.5% to near-zero
-
Despite conventional wisdom suggesting rate cuts would support stocks, the market continued falling
-
The Dow-to-Gold ratio declined significantly as gold outperformed during this period of uncertainty
-
The ratio only began to recover when the broader market sentiment pattern completed its cycle
This case study demonstrates that the ratio often moves independently of conventional monetary policy expectations, instead reflecting deeper market psychology and valuation trends.
What Does the Current Dow-to-Gold Ratio Tell Us?
The present ratio positioning provides important context for investors trying to navigate today's complex market environment.
Current Market Valuation Analysis
The present Dow-to-Gold ratio sits at approximately 12:1, significantly below its 1999 peak of 45:1 but still above historical lows of 1-2:1. This positioning suggests several key insights:
-
Stocks have lost substantial value relative to gold over the past two decades despite nominal gains
-
Current valuations by traditional metrics remain historically elevated, with some analysts placing current market valuations in the top 99th percentile of all time
-
The ratio's decline reflects a long-term trend of gold outperforming equities in real terms
-
The purchasing power of fiat currency continues to diminish against tangible assets
Future Projections and Potential Scenarios
Looking forward, several scenarios could unfold:
Scenario 1: Continued Ratio Decline
If the long-term downtrend continues, we might see:
-
Further outperformance of gold relative to stocks
-
Potential for the ratio to approach historical lows (1-2:1)
-
Significant implications for real purchasing power preservation
This scenario would align with Elliott Wave projections suggesting a potential market decline potentially even larger than the 2007-2009 financial crisis, as the pattern ending now "goes all the way back to the 1932 low."
Scenario 2: Ratio Stabilization
A stabilization scenario might include:
-
The ratio finding equilibrium in the current range
-
Balanced performance between stocks and gold
-
A period of consolidation before the next major trend emerges
Scenario 3: Ratio Reversal
A reversal would suggest:
-
Renewed stock market outperformance relative to gold
-
Potential shift in monetary conditions and market sentiment
-
A new cycle beginning in the decades-long relationship
How Should Investors Position Their Portfolios Given the Dow-to-Gold Ratio?
With current valuations historically elevated and the Dow-to-Gold ratio showing a multi-decade decline, prudent investment strategies may prioritize safety while maintaining exposure to assets likely to preserve purchasing power.
Safety-Focused Investment Strategies
Current safety-oriented strategies might include:
Precious Metals Allocation
-
Gold Position: Maintaining a significant allocation to physical gold as a store of value
-
Silver Consideration: Including silver exposure for potentially higher returns with increased volatility
-
Portfolio Percentage: The appropriate allocation depends on individual risk tolerance and time horizon
Elliott Wave International analysts recommend "a good portion in gold" due to its ability to hold value during periods of currency debasement.
Fixed Income Safety
-
Short-Term Treasuries: Utilizing short-duration Treasury bills for capital preservation while earning yield
-
Current Yields: Short-term Treasury bills currently offer yields in the 3-4% range, providing income with minimal duration risk
-
Liquidity Focus: Maintaining sufficient liquidity to capitalize on potential market dislocations
Balancing Risk and Opportunity
A balanced approach might include:
-
Core Protection: Allocating a portion of assets to gold and short-term fixed income
-
Tactical Positioning: Adjusting allocations based on changes in the Dow-to-Gold ratio
-
Correction Preparedness: Being ready for potential "pullback" or "partial retracement" in precious metals prices within an ongoing bull market
Financial analysts tracking the ratio note that even with potential short-term corrections, the long-term trend in precious metals appears positive, suggesting continued outperformance against equities measured in real terms.
What Are Common Misconceptions About the Dow-to-Gold Ratio?
Several misconceptions exist regarding the Dow-to-Gold ratio that can lead investors astray.
Debunking Market Myths
Myth 1: The Ratio Always Predicts Market Timing
While the ratio provides valuable insights into relative valuation, it's not a precise timing tool. Extreme readings can persist for extended periods before reversals occur.
The ratio serves better as a valuation gauge than a timing indicator, helping investors understand relative value rather than predicting exact turning points.
Myth 2: Central Bank Actions Always Drive the Ratio
As demonstrated during the 2007-2009 financial crisis, central bank policies like interest rate cuts don't always produce their expected effects on the ratio. Market psychology and broader economic conditions often prove more influential.
Some Elliott Wave analysts explicitly note they "don't take cues from what central banks do or what the Fed does," instead focusing on investor behavior patterns.
Myth 3: The Ratio Only Matters During Crises
The Dow-to-Gold ratio provides valuable information throughout market cycles, not just during periods of distress. It offers a consistent framework for evaluating relative value across different economic environments.
This ongoing relevance makes the ratio a useful tool for long-term strategic positioning rather than just crisis management.
How Do Global Central Bank Policies Impact the Ratio?
While the ratio's movements aren't solely determined by central bank actions, these institutions can influence the relative performance of gold and equities.
Central Bank Gold Purchases and Market Implications
Recent years have seen increased gold purchases by global central banks, including:
-
Traditional gold holders strengthening their positions
-
New entrants adding gold (and potentially silver) to their reserves
-
Diversification away from traditional reserve currencies
These actions may impact the Dow-to-Gold ratio by:
-
Increasing demand for physical gold
-
Signaling a shift in institutional sentiment toward hard assets
-
Potentially accelerating trends already visible in the ratio
Some analysts note that "central banks usually are the last to act on a trend," suggesting their actions may confirm rather than initiate shifts in the ratio.
Monetary Policy Divergence Effects
Differing monetary policies across global central banks create additional dynamics:
-
Interest rate differentials between economies
-
Currency valuation impacts on gold prices
-
Varying inflation rates affecting real returns
These policy divergences can create complex cross-currents that influence both equity markets and precious metals prices, ultimately affecting the ratio's movements.
FAQ: Essential Questions About the Dow-to-Gold Ratio
What historical level indicates a potential buying opportunity for stocks?
Historically, when the Dow-to-Gold ratio approaches 5:1 or lower, it has often signaled potential undervaluation in equities relative to gold. However, context matters, and these levels should be considered alongside other valuation metrics.
Can the Dow-to-Gold ratio predict market crashes?
While the ratio doesn't precisely predict crashes, extreme high readings have often preceded significant market corrections. The ratio serves better as a valuation gauge than a timing indicator.
How does inflation impact the Dow-to-Gold ratio?
High inflation typically favors gold over stocks in real terms, pushing the ratio lower. This reflects gold's historical role as an inflation hedge compared to equities, which can struggle during periods of unexpected inflation.
Should average investors incorporate this ratio into their strategy?
Yes, the Dow-to-Gold ratio provides valuable perspective for average investors by highlighting the real value of their investments beyond nominal dollar returns. It serves as a useful tool for long-term strategic positioning rather than short-term trading.
How might the ratio behave during a recession?
During recessions, the ratio typically declines as investors seek safety in gold while equity markets face pressure. However, the magnitude and duration of this movement can vary based on the recession's severity and monetary policy responses.
What is the relationship between interest rates and the Dow-to-Gold ratio?
Conventional wisdom suggests higher interest rates favor stocks over gold (raising the ratio) while lower rates favor gold over stocks (lowering the ratio). However, historical examples show this relationship isn't always straightforward, as demonstrated during the 2007-2009 period.
The Dow-to-Gold Ratio as a Strategic Compass
The Dow-to-Gold ratio stands as one of the most illuminating metrics for understanding true market valuation across time. By comparing the stock market to gold—a historically stable store of value—investors gain insights that dollar-denominated metrics alone cannot provide.
In today's environment of historically elevated valuations and increasing economic uncertainty, the ratio suggests caution may be warranted. The substantial decline in the ratio over the past 26 years, from 45:1 to approximately 12:1, highlights the outperformance of gold despite nominal gains in equity markets.
For forward-thinking investors, the Dow-to-Gold ratio serves as a strategic compass, helping navigate the complex interplay between traditional financial assets and gold market technical analysis. By understanding this relationship, investors can make more informed decisions about portfolio construction, asset allocation, and long-term wealth preservation.
As markets continue to evolve, this time-tested metric remains an essential tool for those seeking to protect and grow their purchasing power through varying economic conditions. Furthermore, understanding the gold-stock market relationship is crucial for developing a comprehensive investment strategy that accounts for these historical patterns and gold price forecast insights. According to the 100-year Dow-to-Gold ratio chart, these historical cycles have consistently provided valuable guidance for investors attempting to navigate through different market environments.
Want to Capitalise on the Next Major ASX Mineral Discovery?
Don't miss out on potential market-beating returns when significant mineral discoveries are announced. Discover how Discovery Alert's proprietary Discovery IQ model delivers instant, real-time notifications on major ASX mineral discoveries by visiting our dedicated discoveries page today.