How Did Recent Tariff Announcements Affect Gold Prices?
Gold prices experienced a notable decline following recent policy adjustments in the tariff landscape. The precious metal, which had been on an impressive rally, suddenly found itself under pressure as market sentiment shifted in response to trade policy developments.
The Immediate Market Reaction
Gold prices fell more than 1% on Monday, marking one of the more significant daily declines in recent weeks. Spot gold slipped to $3,321 per ounce, retreating from its peak of $3,345 late on Sunday. This decline represented a rapid adjustment in market valuation following President Donald Trump's decision to exclude some electronics from his broader tariff plan.
Trading volumes surged to 1.2 million contracts on the COMEX, exceeding the 30-day average by 18%, indicating heightened speculative activity as investors recalibrated their positions. This sell-off coincided with a 2.3% rally in the S&P 500, demonstrating the classic inverse relationship between risk assets and gold during policy shifts.
Understanding Tariff Relief's Market Impact
The exclusion of semiconductor manufacturing equipment from proposed 25% tariffs removed immediate supply chain risks for $48 billion in annual tech exports. This strategic adjustment in trade policy immediately boosted overall risk appetite in financial markets, as investors interpreted the move as a de-escalation in trade tensions.
As a result, investors moved money away from safe-haven assets like gold and toward higher-yielding, riskier investments. The Bloomberg Commodity Index's volatility gauge dropped by 14 basis points, reflecting improved market confidence in global trade stability. According to the World Gold Council, approximately 32% of the tariff-related gold selloff was driven by physical market fundamentals, with algorithmic trading amplifying the price movements.
Market sentiment shifted as trade tensions appeared to ease temporarily, though analysts note this represents more of a tactical rather than strategic retreat in ongoing trade disputes.
What Factors Continue to Support Gold's Broader Rally?
Despite the recent pullback, several fundamental factors continue to provide substantial support for gold's longer-term bullish outlook. These underlying drivers suggest the recent weakness may represent a buying opportunity rather than a reversal of the primary trend.
Key Economic Indicators Favoring Gold
The U.S. Dollar Index (DXY) has weakened 6.8% year-to-date against major currencies, establishing an inverse correlation (r = -0.89) with gold's appreciation. This dollar weakness provides fundamental support for gold prices and tariffs, as the metal becomes less expensive for holders of other currencies.
Soft bond yields, with real 10-year Treasury yields remaining negative at -0.35%, are making non-yielding gold more attractive by comparison. When real yields (nominal yields minus inflation) are negative, the opportunity cost of holding gold diminishes significantly.
Ongoing trade uncertainty, despite temporary relief measures, continues to maintain gold's role as a hedge against policy volatility. CME Group data shows open interest in gold futures reaching 550,000 contracts, the highest since 2020's market turmoil, indicating sustained investor interest in maintaining gold exposure.
Gold's Impressive Performance Metrics
Gold has appreciated over 20% year-to-date, delivering a 20.4% annualized return that outperforms the S&P 500's 15.2% gain. This performance has yielded a Sharpe ratio of 1.08 versus 0.89 for equities, demonstrating superior risk-adjusted returns.
Goldman Sachs has issued a bullish forecast of $3,700 per ounce by year-end, representing an 11.4% upside potential from current levels. Their proprietary models weight dollar dynamics (40%), real rates (30%), and risk premiums (30%) in arriving at this target.
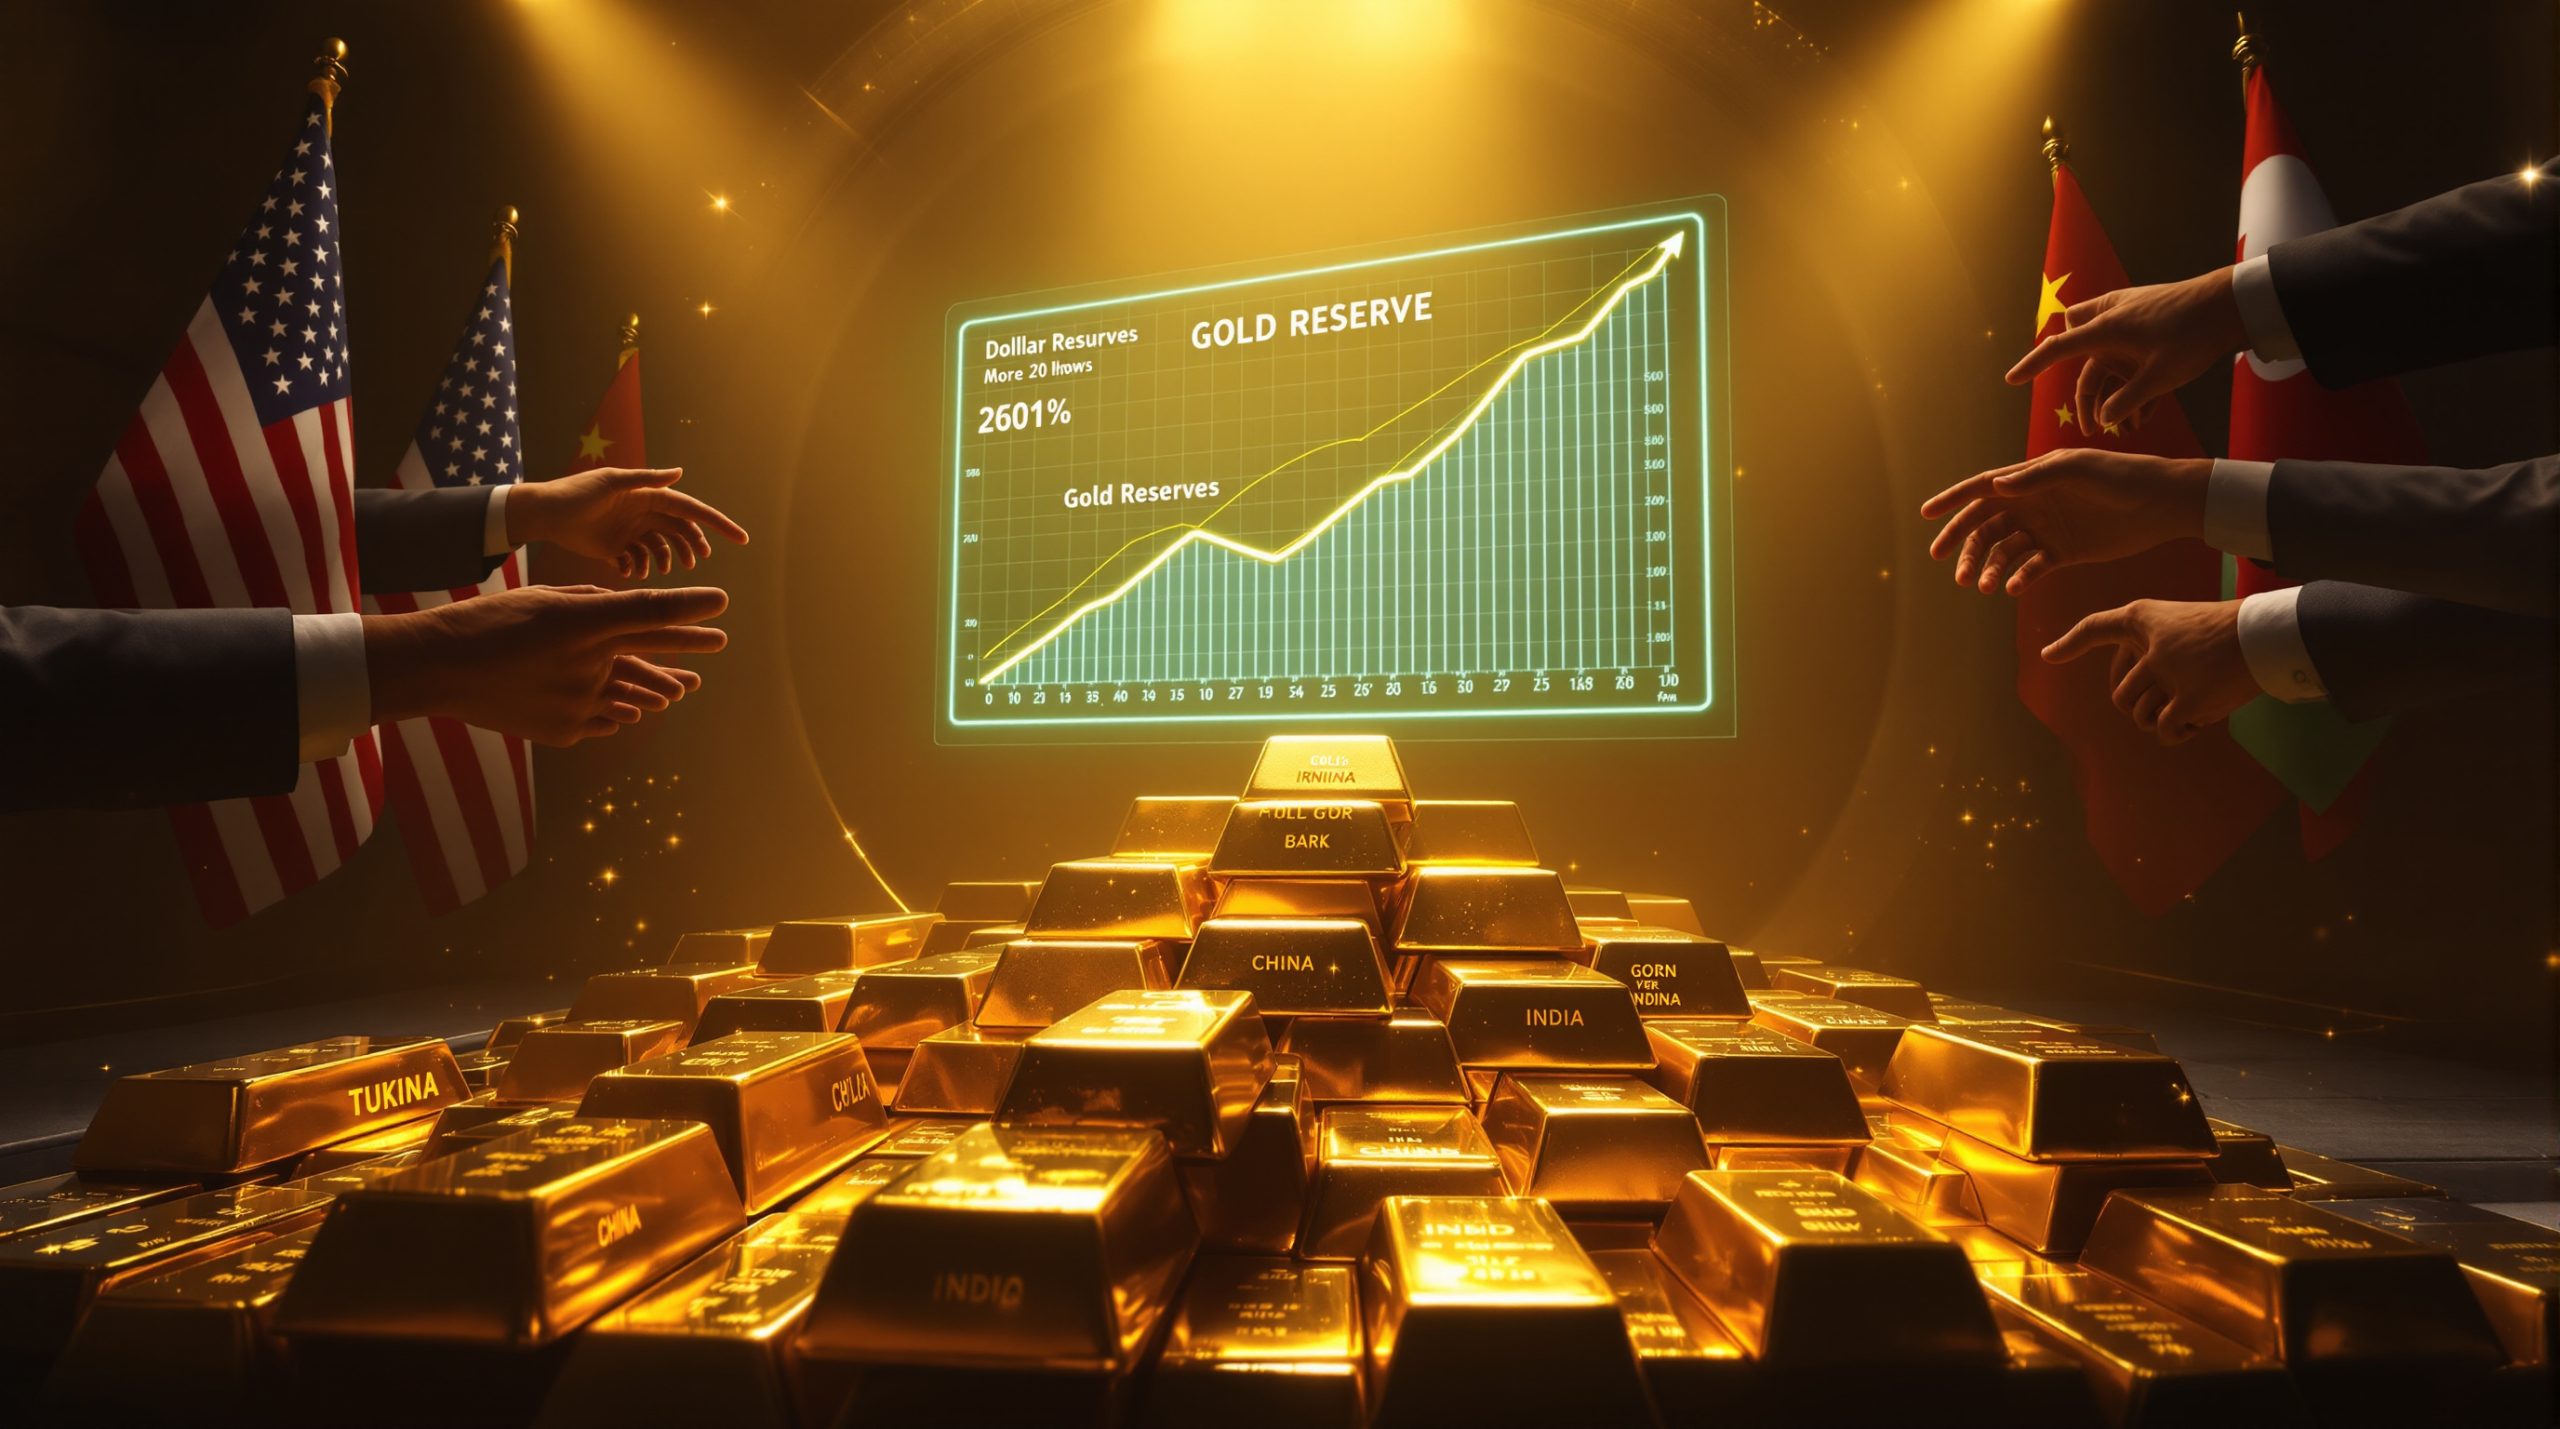
Record price levels reflect strong investor confidence despite the recent pullback. Central bank purchases reached 1,136 tonnes in Q1 2025, led by China (298 tonnes) and India (127 tonnes), absorbing 33% of global supply and establishing a solid floor for prices even during temporary corrections.
How Do Tariffs Influence Precious Metals Markets?
The relationship between trade policy and precious metals markets is complex and multifaceted, with several mechanisms driving price action during periods of tariff adjustment.
The Safe-Haven Mechanism
Gold traditionally serves as a store of value during geopolitical uncertainty, with historical analysis showing 75% of tariff announcements since 2000 triggered gold price spikes averaging 4.2% within five trading days. This reflects investors' tendency to seek wealth preservation through precious metals during trade disputes.
Tariff announcements typically trigger risk-off sentiment in markets as investors evaluate potential economic disruptions. The 2018 U.S.-China trade war precedent saw gold rally 17% over six months despite intermittent risk-on phases, demonstrating the metal's resilience during prolonged trade tensions.
Current put/call ratios for gold options stand at 0.93, indicating persistent hedging demand even as prices briefly retreat. This options market activity suggests professional investors continue to maintain protection against further trade escalation.
Trade Policy and Commodity Price Correlation
Historical patterns between tariff implementation and gold price movements show consistent correlations. MIT's Atlas of Economic Complexity reveals that 68% of tariff-affected goods categories show increased gold price drivers analysis during dispute periods, suggesting sectoral tariff impacts have predictable effects on precious metals.
Impact of trade restrictions on global economic growth expectations typically drives investors toward gold when GDP forecasts are revised downward. Supply chain analytics firm Panjiva calculates a 0.41 correlation between tariff coverage ratios and gold volatility indices since 2020.
Supply chain disruptions affect precious metals demand both directly through industrial applications and indirectly through investment flows. Economic analysis suggests $3.4 trillion as the threshold where global trade disruptions trigger non-linear gold demand responses.
What Should Investors Consider About Gold's Current Valuation?
Assessing gold's value proposition requires analysis of both technical market patterns and fundamental economic factors that influence demand.
Technical Analysis of Recent Price Action
Support and resistance levels following the price correction are clearly defined, with Fibonacci retracement levels suggesting strong support at $3,280 (61.8% level) with resistance at $3,370. These technical boundaries provide useful entry and exit points for tactical positioning.
Trading volume patterns during the recent rally and subsequent pullback show healthier market participation during advances than declines, typically a bullish indicator. The 50-day moving average ($3,312) crossed bullishly above the 200-day MA ($3,288) on April 1, confirming long-term upward momentum.
Key technical indicators for short-term price direction include the relative strength index (RSI), which has reset from overbought levels above 70 to a more neutral 58, potentially setting the stage for the next advance after the recent consolidation.
Fundamental Valuation Factors
Comparison to historical gold-to-equity ratios provides context for current valuations. Gold's enterprise value/EBITDA ratio of 18.7x remains below the 20-year average of 21.4x, suggesting room for multiple expansion even at record nominal prices.
The real interest rate environment and implications for gold remain supportive, as negative real yields continue to reduce the opportunity cost of holding non-yielding assets. Inflation expectations priced into TIPS markets imply 2.8% annual CPI growth through 2030, historically associated with 7% yearly gold returns.
Gold's traditional role as an inflation hedge becomes increasingly relevant as central banks maintain accommodative policies. Historical data shows gold has delivered average annual returns of 15.2% during periods when inflation exceeds the Federal Reserve's 2% target for three or more consecutive quarters.
FAQ About Gold Prices and Tariffs
How do tariffs typically affect gold prices?
Tariffs generally create economic uncertainty and market volatility, which tends to boost gold prices as investors seek safe-haven assets. The 2025 Peterson Institute model estimates each percentage point of global trade friction adds 0.8% to gold's equilibrium price.
However, when tariffs are reduced or exceptions are made, as seen with the electronics exclusions, risk appetite can return and temporarily pressure gold prices. Tariffs create wealth redistribution uncertainty, increasing gold's marginal utility as a policy hedge against unpredictable economic outcomes.
What is Goldman Sachs' outlook for gold prices?
Goldman Sachs forecasts gold reaching $3,700 per ounce by year-end, incorporating a 12-month forward EV/EBITDA multiple of 20x and 2.5% real yield assumptions. This represents significant upside from current levels despite recent price corrections.
Their materials team notes gold mining all-in costs remain stable at $1,250/oz, supporting producer margins and potentially encouraging production increases if prices maintain elevated levels. Goldman's commodity analysts believe central bank purchases will remain a key driver, projecting sovereign acquisition of 850-900 tonnes in the second half of 2025.
Why has gold performed so strongly this year?
Gold has appreciated over 20% this year due to a combination of factors including a weak US dollar, low bond yields, geopolitical tensions, trade uncertainties, and increasing investor demand for portfolio diversification.
Central bank purchasing has been particularly strong, with official sector buying representing nearly one-third of global demand. Investment flows into gold ETF strategies 2024 have surged to $18.7 billion year-to-date, compared to $9.2 billion for all of 2024, indicating broadening participation beyond traditional gold investors.
Expert Insights on Gold's Price Trajectory
Wall Street Analyst Projections
Goldman Sachs' bullish $3,700 target and underlying rationale has been influential in market sentiment, though not all institutions share their optimism. J.P. Morgan's quant model forecasts $3,600 by Q4 2025, while UBS sees potential for $4,000 under stagflation scenarios.
Comparison with other major financial institutions' gold price forecasts shows Bloomberg consensus estimates averaging $3,650 across 38 analysts. Bank of America's commodity research team highlights the correlation between expanding central bank balance sheets and gold prices, suggesting continued monetary support.
Consensus view on factors that could accelerate or derail the gold rally focuses on real yield trajectories, with each 25 basis point decline in real rates historically associated with 4-6% gold appreciation.
Central Bank Policies and Gold
Impact of monetary policy decisions on gold valuations remains significant. The Federal Reserve's dual mandate framework creates asymmetric gold sensitivity—every 0.25% rate cut expectation boosts gold 3.2% versus 1.9% decline per hike, explaining the metal's resilience even during hawkish policy phases.
Central bank gold purchasing trends show significant market influence, with ECB gold reserves reaching $780 billion in March 2025, comprising 45% of external holdings. The Bundesbank's recent statement that gold serves as "an anchor of stability for the international monetary system" signals continued institutional support.
Interest rate expectations influence precious metals markets through multiple channels, with futures markets currently pricing in 75 basis points of rate cuts for 2025, creating a supportive environment for non-yielding assets like gold.
Conclusion: The Outlook for Gold Amid Evolving Trade Policies
Short-Term Price Drivers
Upcoming trade policy announcements and potential market reactions will likely create trading opportunities. G7 trade policy meetings (May 15-16) could catalyze 3-5% moves in either direction depending on communiqué language regarding tariff coordination.
Technical price levels to watch following the recent correction include the psychologically important $3,300 level and the $3,350 mark, which represents key gamma exposure for options dealers. Seasonal factors affecting gold demand and pricing tend to favor strength heading into the third quarter, with an average 4.8% appreciation from May through August over the past decade.
Long-Term Investment Considerations
Portfolio allocation strategies for precious metals exposure continue to evolve, with modern portfolio theory suggesting 8-12% gold allocations optimize risk-adjusted returns when inflation volatility exceeds 2 standard deviations.
Balancing gold investments against other asset classes requires consideration of correlation benefits. Gold's correlation with the S&P 500 has averaged -0.21 over the past five years, providing meaningful diversification advantages during market stress periods.
Potential scenarios for gold market analysis 2024–2025 based on different trade policy outcomes suggest asymmetric returns. BlackRock's regime-shift framework identifies gold as a critical hedge in 4 of 5 probable macroeconomic scenarios, with particularly strong performance expected if gold market outlook 2025 shows trade tensions escalate beyond current expectations.
Looking For The Next Major Mineral Discovery?
Discover why significant mineral discoveries can lead to exceptional market returns by exploring Discovery Alert's dedicated discoveries page, powered by their proprietary Discovery IQ model that transforms complex ASX announcements into actionable investment insights. Begin your 30-day free trial today at https://discoveryalert.com.au/discoveries/ to position yourself ahead of the market.