How High Could Gold Prices Go in 2025-2026?
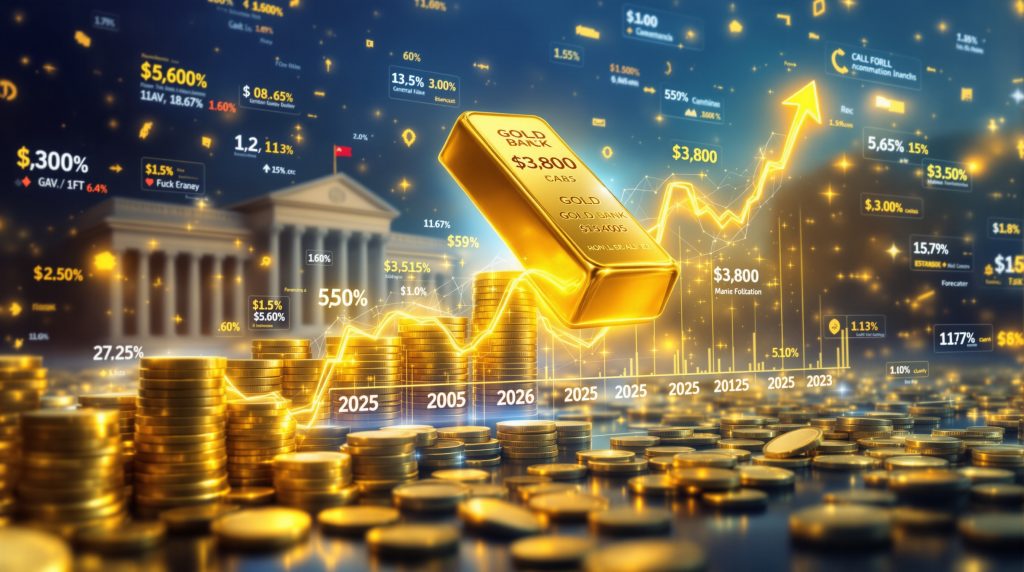
Gold's remarkable performance in 2025 has prompted ANZ raises gold forecast to 3800 per ounce, with prices potentially reaching $4,000 by mid-2026. This bullish outlook reflects gold's 38% year-to-date surge, which has already propelled the precious metal to a record high of $3,673.95 as of September 2025.
Current Gold Price Momentum and Recent Records
Gold hit an all-time high analysis of $3,673.95 in September 2025, demonstrating exceptional strength in global markets. The precious metal's 38% year-to-date increase has surprised even seasoned market analysts, with trading volumes indicating sustained investor interest across all major exchanges.
Market data reveals that gold's upward trajectory has been remarkably consistent throughout 2025, with only minor pullbacks serving as buying opportunities for institutional and retail investors alike. Technical analysts note that gold has maintained its position above key moving averages, suggesting strong underlying support for continued price appreciation.
What's Driving Gold's Historic Bull Run?
Monetary Policy Shifts Fueling Precious Metals
The anticipated interest rate cuts by central banks worldwide have created an ideal environment for gold appreciation. As a non-yielding asset, gold typically performs exceptionally well when interest rates decline.
The Federal Reserve's policy pivot in early 2025 marked a significant turning point for gold markets. With the Trump administration advocating for accommodative monetary policy to stimulate economic growth, the Fed has signaled multiple rate cuts through 2026, creating a favorable backdrop for precious metals.
Federal Reserve's Dovish Stance
Lower interest rates reduce the opportunity cost of holding gold, making it more attractive compared to interest-bearing assets. Historical data shows that gold has averaged gains of 15-20% during previous rate-cutting cycles, with the current cycle potentially delivering even stronger returns.
The monetary easing stance has weakened the US dollar significantly, creating a powerful tailwind for dollar-denominated gold prices. Currency traders note that the dollar index has declined nearly 12% since January 2025, amplifying gold's gains for international investors.
Market expectations of at least four additional rate cuts through 2026 continue to support bullish gold forecasts, with futures markets pricing in a federal funds rate below 2% by late 2026.
Geopolitical Uncertainty Creating Safe-Haven Demand
Global tensions and economic uncertainties continue to drive investors toward gold as a reliable store of value during turbulent times.
The recent escalation of trade disputes between major economies has heightened market volatility, prompting increased allocation to safe-haven assets. President Trump's implementation of new tariff policies has created additional uncertainty in global markets, benefiting gold as investors seek portfolio protection.
Key Geopolitical Factors Supporting Gold
Ongoing international conflicts in strategic regions have disrupted supply chains and energy markets, increasing economic uncertainty. Regional tensions in the Middle East and Eastern Europe remain unresolved, creating persistent background support for gold prices.
Trade tensions between the United States and China have intensified following the implementation of new technology export restrictions, with retaliatory measures threatening global economic stability.
Political transitions in key emerging markets have raised concerns about policy continuity and fiscal discipline, with investors increasingly turning to gold as insurance against potential currency devaluations.
Currency devaluation concerns in various regions have accelerated the trend toward hard assets, with several emerging market currencies experiencing double-digit declines against the US dollar despite the greenback's overall weakness.
How Are Central Banks Influencing the Gold Market?
Record Central Bank Purchasing Trends
Central banks globally have maintained aggressive gold acquisition strategies, significantly impacting available supply and market sentiment.
The World Gold Council reports that official sector purchases reached unprecedented levels in 2024, with central banks acquiring over 1,120 tonnes – marking the third consecutive year of extraordinary buying. This trend has continued into 2025, though at a slightly moderated pace.
Central Bank Acquisition Statistics
| Year | Central Bank Gold Purchases | % Change |
|---|---|---|
| 2023 | 1,037 tonnes | +8.7% |
| 2024 | 1,120 tonnes (estimated) | +8.0% |
| 2025 | 950 tonnes (projected) | -15.2% |
| 2026 | 875 tonnes (forecasted) | -7.9% |
The statistics reveal that while the pace of acquisitions may be slowing from record highs, central bank demand remains well above historical averages, providing fundamental support for gold prices.
De-Dollarization Trends Supporting Gold Demand
The strategic shift by many nations to reduce dollar dependency has translated into increased gold reserves as an alternative store of value.
This trend accelerated following geopolitical tensions and sanctions that highlighted vulnerabilities in the dollar-dominated global financial system. Several major economies have publicly announced plans to reduce dollar exposure in their foreign exchange reserves.
Notable Central Bank Buyers
Emerging economies have led the diversification movement, with Russia, China, India, and Turkey collectively accounting for approximately 60% of central bank gold purchases since 2023.
BRICS nations have systematically increased their gold allocations, with Brazil and South Africa joining the trend more recently. Their combined purchases in 2025 are projected to exceed 400 tonnes.
Middle Eastern countries have converted significant portions of their oil revenue to gold assets, with Saudi Arabia and the United Arab Emirates accounting for approximately 15% of central bank acquisitions in 2025.
Southeast Asian central banks have expanded their precious metals holdings significantly, with Thailand, the Philippines, and Singapore adding over 100 tonnes collectively since 2024.
What Do Major Financial Institutions Forecast for Gold?
Comparative Gold Price Forecasts for 2025-2026
Multiple financial institutions have revised their gold price forecasts upward, though projections vary significantly in magnitude and timing.
The table below presents the latest forecasts from major financial institutions, providing insight into market expectations for gold through 2026:
| Institution | 2025 Forecast | 2026 Forecast | Key Drivers Cited |
|---|---|---|---|
| ANZ | $3,338 | $3,845 | Investment demand, monetary easing |
| Goldman Sachs | $3,280 | $4,025 | Central bank buying, inflation hedging |
| JP Morgan | $3,336 | $4,068 | Geopolitical risks, portfolio diversification |
| Bank of America | $3,356 | $3,750 | Monetary policy, safe-haven demand |
| UBS | $3,500 | – | Recession concerns, investment flows |
| Deutsche Bank | $3,188 | $3,700 | Currency devaluation, central bank demand |
| Morgan Stanley | $3,359 | $3,313 | Technical factors, ETF inflows |
| HSBC | $3,215 | $3,125 | Monetary policy, jewelry demand |
While forecasts vary, the average 2025 year-end projection across major institutions is approximately $3,335, with 2026 forecasts averaging $3,690 – indicating broad consensus on continued strength in the gold market.
It's worth noting that several institutions, including Goldman Sachs and JP Morgan, anticipate gold reaching the $4,000 mark in 2026, aligning with ANZ's recent upward revision.
How Are Investment Flows Affecting Gold Prices?
ETF Investment Trends and Impact
Gold-backed exchange-traded funds have seen substantial inflows in 2025, reflecting growing investor interest in the precious metal.
After experiencing outflows in 2023 and early 2024, gold ETFs reversed course dramatically as macroeconomic conditions shifted. Industry data shows that global gold ETF holdings have increased by approximately 18% year-to-date in 2025.
ETF Investment Statistics
Total gold ETF holdings increased by 18% year-to-date, representing net inflows of approximately 450 tonnes of gold valued at over $50 billion at current prices.
North American ETFs lead with approximately 55% of global inflows, with SPDR Gold Shares (GLD) and iShares Gold Trust (IAU) accounting for the majority of this activity.
European ETFs account for roughly 30% of new investment, with UK and German investors particularly active following currency volatility.
Asian ETF demand is growing at the fastest rate, up 25% year-over-year, with Chinese gold ETFs experiencing record inflows as domestic investors seek alternatives to real estate and equities.
Retail Investment Demand Patterns
Physical gold demand from retail investors has shown resilience despite higher prices, particularly in key markets.
Traditional gold-buying cultures have maintained strong demand even as prices have risen substantially. Market data indicates that physical premiums over spot prices have remained stable, suggesting consistent retail buying interest.
Regional Retail Demand Trends
North American coin sales are up 15% compared to 2024, with the US Mint reporting record demand for American Eagle gold coins in the first three quarters of 2025.
European bar and coin demand increased by 12% year-over-year, with particularly strong buying in Switzerland, Germany, and the UK amidst economic uncertainty.
Asian physical gold purchases are showing 8% growth despite price sensitivity, with Indian demand recovering strongly after initial resistance to higher price levels.
Middle Eastern jewelry and investment demand remains robust, with the region's traditional appreciation for gold as a store of wealth supporting consistent buying.
What Factors Could Push Gold to $4,000 by Mid-2026?
Economic Uncertainty and Recession Concerns
Persistent economic challenges could further enhance gold's appeal as a safe-haven asset.
Several leading economic indicators have flashed warning signs in recent months, including the yield curve inversion that has historically preceded recessions. Many economists now assign a 40-60% probability to a mild recession in 2026.
Economic Indicators to Watch
GDP growth projections in major economies have been revised downward, with consensus forecasts now suggesting sub-2% growth in the United States and European Union through 2026.
Inflation persistence despite monetary intervention remains a concern, with core inflation measures proving stubborn despite rate hikes in 2023-2024.
Labor market stability and consumer confidence metrics have deteriorated gradually over the past two quarters, suggesting potential weakness in household spending.
Corporate earnings and business investment trends indicate caution among company executives, with many firms building cash reserves rather than pursuing expansion.
Supply Constraints in Gold Production
Limited new mine supply and production challenges may create additional upward price pressure.
Gold mining executives have highlighted significant challenges in replacing reserves and developing new projects, with grade declines at existing operations reducing output over time.
Gold Production Outlook
Global mine production is projected to increase only 1.2% in 2025, following three consecutive years of flat or declining output.
Major producers are reporting declining ore grades, with the industry average falling approximately 0.15% annually over the past decade.
Exploration budgets remained constrained by previous market cycles, with capital discipline limiting the pipeline of new projects even as gold prices have risen.
Regulatory and environmental challenges are limiting new project development, with permitting timelines extending to 7-10 years in many jurisdictions, compared to 3-5 years historically.
How Does the Silver Market Compare to Gold's Performance?
Silver Price Forecast and Gold-Silver Ratio
Silver prices have also benefited from gold's momentum, though with characteristic higher volatility.
The white metal reached $41.60 per ounce in September 2025, representing a year-to-date gain of approximately 45%. This outperformance relative to gold is typical during precious metals bull markets.
Silver Market Dynamics
ANZ forecasts silver reaching $44.70 by year-end 2025, representing additional upside of approximately 7.5% from current levels.
The gold-silver ratio insights suggest a narrowing to 78:1 by December 2025, down from its current level of 88:1, reflecting silver's traditional outperformance during advanced stages of precious metals bull markets.
Industrial demand is providing additional support beyond investment flows, with technology and renewable energy sectors consuming increasing quantities of silver.
Mining supply constraints are more pronounced than in the gold sector, with silver often produced as a byproduct of base metal mining rather than from primary silver mines.
Industrial Demand Supporting Silver Prices
Unlike gold, silver benefits from significant industrial applications that provide fundamental support beyond investment demand.
The metal's unique properties, including superior electrical conductivity, thermal conductivity, and reflectivity, make it essential in numerous high-tech applications with growing demand profiles.
Key Silver Demand Sectors
Renewable energy applications, particularly solar panels, are consuming 22% more silver year-over-year, with photovoltaic installations accelerating globally under various clean energy initiatives.
Electronics manufacturing requires 15% more silver annually, with the growth of 5G infrastructure, electric vehicles, and connected devices driving consistent demand growth.
Medical applications are showing steady 8% growth, with silver's antimicrobial properties finding new uses in healthcare settings and consumer products.
Automotive sector demand is increasing with electrification trends, as electric vehicles typically use twice the silver content of conventional internal combustion models.
What Could Derail the Gold Price Rally?
Potential Headwinds for Gold Prices
Despite the bullish outlook, several factors could limit gold's upside potential or trigger temporary corrections.
Investors should monitor these potential headwinds carefully when formulating their precious metals strategy.
Risk Factors to Monitor
Unexpected shifts to hawkish monetary policy could occur if inflation proves more persistent than anticipated. Even minor changes in central bank rhetoric can trigger short-term volatility in gold markets.
Stronger-than-anticipated US dollar performance would create headwinds for gold, particularly if economic data suggests greater resilience than currently expected.
Resolution of major geopolitical tensions would reduce safe-haven demand, potentially triggering profit-taking among investors who purchased gold as a hedge against geopolitical risk.
Significant equity market rallies could reduce safe-haven demand if investor risk appetite increases substantially, diverting capital from precious metals to higher-yielding assets.
Technical Resistance Levels and Price Consolidation
Technical market analysis suggests potential consolidation phases before reaching new highs.
Chart patterns indicate that gold may experience several phases of consolidation as it approaches psychological price barriers, with technical resistance becoming more significant as prices reach unprecedented levels.
Key Technical Levels
Primary resistance exists in the $3,700-3,750 range, representing the recent all-time high plus a small premium. This zone may require multiple attempts to breach conclusively.
Secondary resistance around the $3,850-3,900 zone will likely emerge as gold approaches the psychologically important $4,000 level.
Support has been established at the $3,500-3,550 level, corresponding to previous resistance that has now become support following the recent breakout.
Additional support exists at the $3,350-3,400 range, aligning with the 50-day moving average and previous consolidation zone.
How Should Investors Approach Gold in the Current Market?
Portfolio Allocation Strategies
Financial advisors suggest various approaches to gold investment based on risk tolerance and investment objectives.
The optimal allocation varies significantly depending on an investor's overall financial situation, time horizon, and views on macroeconomic conditions.
Allocation Considerations
Conservative portfolios typically benefit from a 5-10% allocation to precious metals, providing portfolio diversification without overexposure to a single asset class.
Moderate risk profiles might consider 10-15% gold exposure, particularly for investors concerned about inflation risk or currency devaluation.
Aggressive investors may implement tactical positioning with 15-20% allocation during key market phases, especially when multiple bullish factors align as they do currently.
Rebalancing strategies become increasingly important as prices approach forecast targets, with periodic profit-taking helping to maintain target allocations as gold prices rise.
Investment Vehicle Comparison
Different gold investment vehicles offer varying advantages and considerations for investors seeking exposure to the yellow metal.
The table below compares the primary options available to investors:
| Investment Type | Advantages | Considerations |
|---|---|---|
| Physical Gold | Direct ownership, no counterparty risk | Storage costs, insurance, potential premium over spot |
| Gold ETFs | Liquidity, low transaction costs | Annual expense ratios, paper ownership |
| Mining Stocks | Operational leverage, dividend potential | Company-specific risks, market volatility |
| Futures/Options | Leverage, hedging capabilities | Expiration dates, margin requirements |
Each approach offers distinct benefits and drawbacks, with the optimal choice depending on investment goals, account type, and personal preferences.
Physical gold provides maximum security but requires secure storage and insurance. ETFs offer convenience but involve ongoing expense ratios. Mining stocks can outperform gold itself during bull markets but come with operational and management risks. Derivatives provide leverage but require more active management.
FAQs About Gold Price Forecasts
What factors are most influential in ANZ's gold price forecast?
ANZ raises gold forecast to 3800 citing robust investment demand as the primary driver behind its bullish forecast. This includes strong ETF inflows, central bank purchases, and retail investor interest, all supported by a backdrop of monetary easing and geopolitical uncertainty.
The bank's analysts particularly emphasize the impact of anticipated interest rate cuts, noting that gold typically performs exceptionally well during periods of declining real interest rates.
How do interest rate decisions impact gold prices?
Interest rate reductions typically benefit gold prices as they lower the opportunity cost of holding non-yielding assets. When interest-bearing investments offer lower returns, gold's appeal as a store of value increases substantially.
Historical data demonstrates a strong inverse correlation between real interest rates and gold prices. When adjusted for inflation, negative real rates create particularly favorable conditions for gold appreciation.
Are central banks expected to continue buying gold at current rates?
While the pace may moderate slightly from the record levels seen in 2023-2024, central banks are projected to remain significant net buyers through 2025-2026, with estimated annual purchases of 875-950 tonnes.
This volume represents a slight decline from peak levels but remains well above the historical average of approximately 450 tonnes annually before 2018, indicating sustained structural support for the gold market.
How does gold perform during economic recessions?
Gold has historically performed well during recessions, often serving as a portfolio stabilizer. During the 2008 financial crisis, gold gained approximately 25% while equity markets declined significantly. Similar patterns were observed during the COVID-19 market disruption in 2020.
The metal's counter-cyclical properties make it particularly valuable during periods of economic contraction, as it typically maintains or increases its value while other assets experience significant declines.
What is the relationship between inflation and gold prices?
Gold has traditionally served as an inflation hedge, though this relationship can vary in strength. During periods of unexpected inflation or inflation uncertainty, gold typically performs particularly well as investors seek to preserve purchasing power.
Analysis of inflationary periods over the past 50 years indicates that gold has maintained its purchasing power over long time horizons, though short-term correlations can be inconsistent depending on other macroeconomic factors.
Conclusion: Gold's Outlook Through 2026
The convergence of accommodative monetary policy, persistent geopolitical tensions, strong central bank demand, and robust investment flows creates a favorable environment for gold prices through 2025 and into 2026. ANZ's forecast of $3,800 by year-end 2025 and potential for $4,000 by mid-2026 aligns with the broader consensus among financial institutions, though with slightly more bullish expectations.
While price volatility should be expected, the fundamental drivers supporting gold's structural bull market remain firmly in place. Investors seeking portfolio diversification, inflation protection, and safe-haven exposure may find strategic gold allocations increasingly valuable in navigating the complex global economic landscape ahead.
Market professionals emphasize the importance of viewing gold as a long-term strategic holding rather than a short-term trading vehicle. With multiple supportive factors aligning simultaneously, the current gold bull market may have considerable room to run, potentially setting new record-highs and inflation hedge well into 2026.
For those considering gold as part of their portfolio, understanding various investment strategy trends can help maximize potential returns while managing risk appropriately during this extraordinary bull market cycle.
Want to Stay Ahead of the Next Major Gold Discovery?
Discovery Alert's proprietary Discovery IQ model delivers instant notifications when significant ASX gold discoveries are announced, giving you a crucial market advantage before the masses react. Explore how historic gold discoveries have generated exceptional returns by visiting the Discovery Alert discoveries page and position yourself for the next opportunity.