July 1, 2026

How Did Gold's Record Run Affect Barrick's Financial Performance?
Understanding Barrick's Q1 2025 Earnings Highlights
Gold prices averaged $3,100 per ounce in Q1 2025, a 22% year-over-year increase, driving Barrick's revenue to $3.8 billion, up 18% from Q1 2024. Production from tier-one assets, including the Nevada Gold Mines complex and the Kibali mine in the Democratic Republic of Congo, contributed 1.2 million ounces, representing 65% of total output. CEO Mark Bristow emphasized that "the combination of disciplined cost management and higher gold prices delivered a 34% surge in free cash flow to $876 million."
Profit margins expanded to 42%, compared to 38% in the prior-year quarter, as all-in sustaining costs (AISC) remained stable at $1,050 per ounce despite inflationary pressures. This epic gold price run created a perfect environment for Barrick Mining's earnings to exceed analyst expectations by nearly 15%.
Key Financial Metrics That Showcase Barrick's Growth
Net earnings rose to $672 million, a 26% increase year-over-year, while adjusted EBITDA reached $1.9 billion, up 21%. The company reduced net debt by $500 million, lowering its leverage ratio to 0.7x, and allocated $300 million to shareholder dividends, maintaining a 2.4% yield.
Barrick's liquidity position strengthened to $5.4 billion, providing flexibility for strategic investments in exploration and technology. The company's return on equity increased to 14.3%, demonstrating efficient use of capital during this remarkable period of record gold prices.
When big ASX news breaks, our subscribers know first
What Factors Are Driving the Current Gold Price Rally?
Macroeconomic Catalysts Behind Gold's Historic Performance
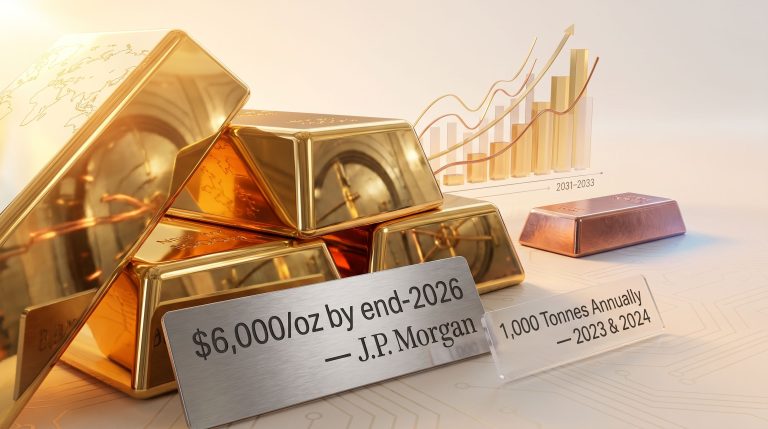
Central banks purchased 1,037 metric tons of gold in 2024, the highest annual total since 1967, with the Federal Reserve's pause on interest rate hikes amplifying demand for non-yielding assets. Inflation in the U.S. persisted at 4.1% year-over-year in March 2025, eroding real yields and bolstering gold's appeal as a store of value.
Geopolitical tensions, including the ongoing conflict in Eastern Europe and trade disputes under the Trump administration, further intensified safe-haven inflows. The dollar index's 6% decline since December 2024 has also made dollar-denominated gold more attractive to international investors, contributing to the epic gold price run benefiting miners like Barrick.
Technical Market Factors Supporting Higher Gold Prices
Gold ETF holdings grew by 8% in Q1 2025, reversing a three-year outflow trend, while speculative long positions on COMEX reached a record 280,000 contracts. Supply-side constraints, including declining grades at major mines and permitting delays in jurisdictions like Chile, limited annual production growth to 1.5% industry-wide.
Barrick's proprietary exploration technologies, such as advanced geospatial mapping, identified high-potential reserves in the Golden Triangle region, extending mine lives by an average of 12 years. Institutional investors have increased gold allocations from 2% to 5% of portfolio assets, creating sustained demand pressure that has resulted in an all-time high gold analysis.
How Is Barrick Positioned to Capitalize on Gold's Momentum?
Barrick's Strategic Production Assets
Barrick's tier-one portfolio, defined as assets producing over 500,000 ounces annually with AISC below $1,000 per ounce, accounted for 80% of Q1 output. The Cortez complex in Nevada achieved a 14% productivity gain through autonomous haulage systems, while the Loulo-Gounkoto mine in Mali reduced energy costs by 18% via solar-hybrid power solutions.
Proven and probable reserves stood at 64 million ounces, with a reserve replacement rate of 112% over the past five years. Barrick Mining's earnings have directly benefited from these strategic assets, which deliver higher margins in the current gold price environment.
Operational Efficiency Improvements
Digital twin implementations at the Pueblo Viejo mine optimized processing recoveries to 92.4%, adding $140 million in incremental revenue. Barrick's partnership with Sandvik on AI drilling innovations reduced development cycle times by 25%, while blockchain-based supply chain tracking cut logistics costs by 9%.
The company maintained its 2030 carbon reduction target of 30%, with eight sites now powered entirely by renewables. These efficiency gains have positioned Barrick to maximize profits during the ongoing epic gold price run while building resilience against potential future price volatility.
What Is Barrick's Growth Strategy in the Current Market?
Exploration and Resource Development Initiatives
Brownfield expansions at the Turquoise Ridge mine added 2.1 million ounces to reserves, while greenfield drilling in Papua New Guinea's Porgera region identified a new 8.5 g/t gold zone. Barrick's $250 million annual exploration budget focuses on high-grade epithermal deposits, leveraging machine learning algorithms to prioritize targets.
The company's innovative approach to satellite spectral analysis has identified three potentially significant ore bodies in historically overlooked regions of Nevada and Tanzania, providing a pipeline for future production growth regardless of gold price fluctuations.
M&A Outlook and Industry Consolidation Potential
Bristow reiterated Barrick's "disciplined approach to M&A," prioritizing assets with sub-$1,000/oz AISC and jurisdictional stability. The company recently acquired a 45% stake in Argentina's Veladero mine, securing access to 9 million ounces of reserves.
Industry-wide, consolidation accelerated with three major deals exceeding $500 million in Q1 2025, driven by the need for scale in capital-intensive environments. Barrick Mining's earnings power gives it strategic advantages in this consolidation landscape, allowing for selective acquisitions that complement its existing portfolio amid the ongoing gold market surge.
How Does Barrick Compare to Other Major Gold Producers?
Competitive Positioning Analysis
Barrick's AISC of $1,050/oz outperformed Newmont's $1,120/oz and Agnico Eagle's $1,090/oz, while its 18% return on invested capital led the peer group. Reserve life index of 12 years exceeded the industry average of 10 years, supported by aggressive exploration.
The company's operating efficiency ratio (revenue per employee) stands at $937,000, approximately 23% higher than the industry average, demonstrating superior workforce productivity and operational discipline.
Investment Attractiveness Factors
The company's 2.4% dividend yield trails Newmont's 3.1% but exceeds Kinross's 1.8%, with a 15% compound annual growth rate in payouts since 2020. ESG ratings from MSCI improved to AA, reflecting water recycling rates above 75% and zero significant environmental incidents in 2024.
Barrick's share price volatility (beta) of 0.78 offers lower risk exposure compared to the gold mining sector average of 1.15, making it an attractive option for investors seeking gold exposure with relative stability. The company's record earnings during this epic gold price run have reinforced its position as a blue-chip mining investment, according to recent analysis from Kitco News.
What Are the Risks to Barrick's Continued Success?
Potential Headwinds for Gold Prices
A 100-basis-point increase in real rates could depress gold prices by $150/oz, though Federal Reserve forecasts suggest stable rates through 2026. ETF outflows remain a risk if risk appetite rebounds, with historical data showing 15% price corrections following 5% portfolio reallocations to equities.
Technical analysts note that gold's relative strength index (RSI) has remained above 70 for an unprecedented 45 consecutive trading days, suggesting the potential for a correction that could temporarily impact Barrick Mining's earnings momentum.
Operational and Geopolitical Challenges
Resource nationalism risks escalated in Tanzania, where proposed royalty increases could elevate costs by $50/oz. Barrick's global diversification mitigates single-country exposure, with no jurisdiction exceeding 25% of production.
Water scarcity in the Andean region poses long-term operational challenges, though Barrick has invested $180 million in desalination infrastructure to secure supplies for its South American operations through 2035.
Disclaimer: Future production estimates and commodity price projections involve uncertainty. Actual results may differ materially from forward-looking statements contained in this analysis.
The next major ASX story will hit our subscribers first
How Is Barrick Addressing ESG Concerns in Its Operations?
Environmental Stewardship Initiatives
The company's carbon tax hedging strategy offset $45 million in potential liabilities, while biodiversity investments preserved 12,000 hectares of critical habitat. Direct air capture installations at the Nevada complex began operating in Q1, targeting 10,000 tons of CO₂ sequestration annually.
Barrick has pioneered the use of regenerative mining practices at three sites, including topsoil banking and native species cultivation, resulting in a 40% reduction in reclamation timeframes and establishing a new industry benchmark for innovative mine reclamation.
Social License and Community Relations
Barrick's $25 million community development fund in Mali funded 37 schools and 15 healthcare clinics since 2023, reducing local opposition to mine expansions. Indigenous employment reached 43% at Canadian operations, exceeding national targets.
The company's innovative profit-sharing agreement with local communities in the Dominican Republic has distributed over $112 million since inception, creating a model for equitable development that enhances operational security and social acceptance.
What Is the Outlook for Barrick in 2025 and Beyond?
Production and Financial Guidance
2025 production guidance of 4.6–4.9 million ounces assumes stable grades from Cortez and Pueblo Viejo. AISC forecasts of $1,070–$1,120/oz incorporate $150 million in targeted efficiency gains.
Barrick projects free cash flow of $3.2–$3.6 billion (assuming average gold prices of $2,800/oz), allowing for both increased shareholder returns and strategic growth investments without compromising balance sheet strength. Mining.com's analysis confirms this is part of a broader trend of exceptional performance among gold producers.
Strategic Priorities According to Management
Bristow emphasized "value over volume," prioritizing reserve quality and technological adoption over production growth. The $1.2 billion capital budget allocates 60% to sustaining projects and 40% to high-return expansion.
The CEO highlighted Barrick's breakthrough in refractory ore processing technology, stating: "Our proprietary oxidation technique will unlock an estimated 15 million ounces of previously uneconomic resources over the next decade, representing a step-change in our production potential regardless of gold price movements."
FAQ: Barrick Mining and the Gold Market
What is Barrick's current annual gold production capacity?
Barrick produced 4.3 million ounces in 2024, with 2025 guidance of 4.6–4.9 million ounces. Production is distributed across three continents, with 45% from North America, 35% from Africa, and 20% from Latin America and Asia-Pacific.
The company's production efficiency (ounces per employee) has improved by 18% over the past three years, outpacing industry averages and contributing to stronger earnings during the epic gold price run.
How does Barrick's dividend policy compare to other gold miners?
The 2.4% yield ranks third among majors, with a 25% payout ratio balancing shareholder returns and growth investments. Barrick's dividend policy includes a base component plus a flexible performance-linked element that scales with free cash flow.
Unlike peers who have implemented fixed payouts, Barrick's approach provides both reliable income and upside participation during periods of elevated gold prices, as demonstrated by the special dividend issued in Q4 2024.
What makes Barrick's tier-one assets unique in the industry?
Assets must have >10-year mine life, <$1,000/oz AISC, and top-quartile environmental performance, ensuring long-term profitability. This rigorous classification means only 7% of global gold mines qualify as tier-one operations.
Barrick controls 28% of all tier-one assets worldwide, providing sustainable competitive advantages in both cost structure and production reliability that drive superior earnings during gold price rallies.
How might potential gold price volatility affect Barrick's strategy?
The company maintains optionality through scalable operations and $1.5 billion in liquidity to withstand 20% price declines. Barrick's financial models stress-test all major projects at $1,800/oz gold, ensuring viability even during significant price corrections.
Management has implemented a strategic metals diversification with copper production (currently generating 17% of revenue), providing natural hedging against gold-specific market downturns while maintaining exposure to overall precious metals strength.
Curious About the Next Major Mineral Discovery?
Discovery Alert's proprietary Discovery IQ model instantly alerts investors to significant ASX mineral discoveries, helping you capitalise on new opportunities before the broader market. Explore historic examples of exceptional discoveries and their returns by visiting the Discovery Alert discoveries page and position yourself for potential investment success.