What's Driving Gold and Silver Prices in Today's Market?
The precious metals market has undergone fundamental shifts in recent years, with gold reaching unprecedented price levels and silver showing signs of potential breakout. Two critical macro factors are reshaping how these metals trade and creating new opportunities for investors.
The first major shift is the dominance of the physical market. For decades, paper trading controlled prices, with 150-250 paper ounces traded for each physical ounce. However, this dynamic has changed dramatically, primarily driven by substantial demand from China and broader Asian markets. According to Florian Grummes at the Frankfurt Precious Metals Conference (May 2024), "The physical market has taken over… thanks to the gold exchange in Shanghai and massive demand from Asia."
The second transformative factor is gold's remonetization. After decades of diminished prominence in the global financial system, gold is being reintegrated as a monetary asset. China has been particularly active in this regard, effectively backing its currency with gold to build trust with trading partners. This strategy represents a significant shift in how major economies view precious metals.
"China is strategically accumulating gold to support its currency's credibility in international trade, particularly as it seeks alternatives to dollar-dominated systems." – Florian Grummes, Frankfurt Precious Metals Conference, 2024
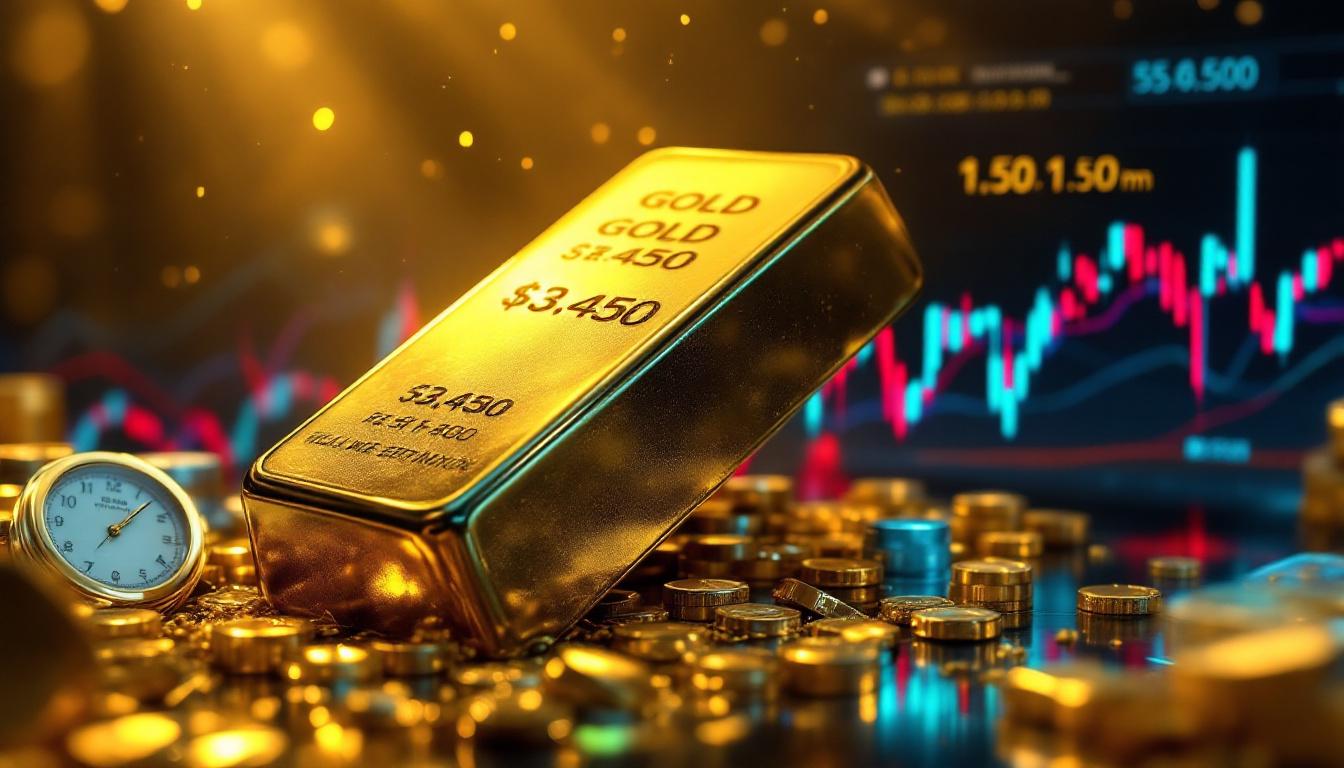
These structural changes suggest the recent pullback from gold's $3,500 high represents a consolidation rather than a long-term reversal of the bull market. The Shanghai Gold Exchange, established in 2002 and now the world's largest physical gold market, has been instrumental in this power shift from paper to physical markets.
Perhaps most telling is China's gold reserves, which have increased for 18 consecutive months as of May 2024, according to data from the People's Bank of China. This persistent accumulation signals a long-term strategic commitment rather than short-term trading activity.
How Did Gold's Price Action Develop Over Recent Years?
The Cup and Handle Pattern Formation
Gold's price action since 2000 tells a compelling technical story that helps explain its recent dramatic moves. The metal has formed what technical analysts identify as a textbook "cup and handle" formation – one of the most reliable bullish continuation patterns in market analysis.
This pattern developed through several distinct phases:
- Starting from the $250 double bottom in 2000
- Rising to $1,920 by 2011 (a remarkable 668% increase)
- Experiencing a nearly four-year correction with a 50% pullback to $1,138
- Consolidating for 13 years against resistance around $2,000-2,075
- Finally breaking out in February 2023 (with early signals appearing in November 2022)
This classic formation compressed energy for over a decade, explaining the explosive 15-month rally that followed the breakout. The pattern projected two specific price targets:
- First target: $2,535 (derived from the handle depth)
- Second target: $3,100 (derived from the cup depth)
Both targets were met and exceeded during the recent rally to $3,500, validating the pattern's predictive power.
What makes this formation particularly significant is its extended timeframe. While cup and handle patterns typically form over weeks or months, gold's formation developed over more than two decades, suggesting the magnitude of the subsequent bull market could be proportionally larger than typical pattern completions.
What Should Investors Expect for Gold Prices Going Forward?
Retracement Scenarios and Support Levels
With gold having reached uncharted territory above $3,000, the market is now focused on potential retracement scenarios. Technical analysis suggests two primary possibilities:
Best-case scenario: A shallow retracement of the rally from the $1,615 triple low (October 2022), using Fibonacci retracement levels:
- 23.6% retracement: Around $3,055
- 38.2% retracement: Around $2,800
This scenario would keep gold above $3,000 with high volatility but maintain the strong uptrend intact. The Fibonacci sequence, a mathematical pattern that appears throughout nature, has proven remarkably effective in identifying potential reversal points in financial markets.
Worst-case scenario: A deeper retracement of the entire rally since December 2015:
- This would take gold back to former resistance (now support) around $2,075
- This extreme scenario would likely only occur during a 2008-style financial crisis
- Central banks and nations would likely step in with significant buying around $3,000
"The $3,000 level has become psychologically significant. Major gold buyers, particularly central banks, view this as strategic entry point for long-term holdings." – Market analysis from World Gold Council, 2024
The technical uptrend channel supports the best-case scenario, with the middle trendline suggesting support around $3,050. This aligns remarkably well with the 23.6% Fibonacci retracement level, creating a zone of potentially strong support.
Weekly and Daily Technical Indicators
Weekly charts show a sell signal on the stochastic oscillator, suggesting the consolidation may continue for several weeks before reaching oversold conditions that would present buying opportunities. This indicator measures momentum and helps identify potential reversal points when markets become overextended.
The daily chart reveals several positive factors that support a bullish medium-term outlook:
- Two unfilled upside gaps that have an 80% probability of being filled
- Support at the 50-day moving average (around $3,150)
- The 200-day moving average rising toward $2,800
- Bollinger Bands suggesting a trading range between $3,100-3,400
These technical indicators collectively point to a period of consolidation rather than a major trend reversal, with strong support levels established below current prices.
How Does Market Sentiment Impact Gold's Price Outlook?
Market sentiment plays a crucial role in gold price movements, often acting as both a driving force and a contrary indicator at extremes. The Optix gold sentiment indicator has shown excessive optimism for nearly 12 months – a situation that would typically concern contrarian investors.
However, during established bull markets, such optimism typically doesn't fully reset to panic levels but instead experiences "cold showers" – sharp pullbacks that temporarily reduce enthusiasm before the uptrend continues. This pattern differs significantly from bear market conditions, where sentiment regularly cycles between extremes.
The recent $300 decline appears to be precisely this type of sentiment reset, with the indicator remaining above the 50-55 level that would maintain overall bullish positioning. This suggests that while some speculators have been shaken out, the core bullish trend remains intact.
What makes the current sentiment situation unusual is its persistence. Typically, extreme optimism doesn't last for extended periods without major corrections. The fact that gold has sustained high sentiment readings while continuing its uptrend speaks to the strength of the underlying fundamentals driving the market.
What Role Do Futures Markets Play in Gold Price Action?
The Commitment of Traders (COT) report, published weekly by the Commodity Futures Trading Commission (CFTC), tracks commercial positions in the futures market and has historically provided valuable insights into potential price reversals.
Recent COT data shows:
- Commercial net short positions remained relatively stable around 300,000 contracts during gold's $1,000 rise
- Recent reduction to 200,000 net short contracts
- Historically, the commercial short position would need to decline to around 100,000 contracts to signal a major bottom
While this data was critically important in previous market cycles, the physical market's dominance has reduced its significance as a primary indicator. This represents a fundamental shift in how the gold market functions.
The diminished relevance of futures positioning highlights how gold's market structure has evolved. Previously, paper markets could easily overpower physical demand, but the growing influence of physical buyers – particularly central banks and large institutional investors – has altered this dynamic.
According to CFTC data, the stabilization of commercial short positions despite gold's dramatic price rise suggests that major commercial players (primarily bullion banks) have changed their traditional hedging practices, possibly in recognition of gold's strengthened fundamentals.
How Do Seasonal Patterns Affect Gold Price Movements?
Gold continues to follow reliable seasonal patterns established over the past 15 years, providing investors with a roadmap for potential entry and exit points:
- Major tops typically form between March and May (as seen this year)
- Corrections or consolidations often occur in early summer (June-July)
- Summer rallies typically follow
- Selloffs into mid-December (often coinciding with the final FOMC meeting)
- Strong rallies from mid-December into spring
This pattern suggests several more weeks of consolidation before a potential summer rally that could test the recent highs around $3,400-3,500.
These seasonal patterns are influenced by a combination of factors:
- Wedding season demand in India (typically strongest in Q4)
- Agricultural harvest cycles that affect rural gold buying in Asia
- Chinese New Year preparations (December-January)
- Central bank buying patterns that often accelerate in Q4
- Tax-loss selling by Western investors in December
According to the World Gold Council's "Seasonality Analysis" (2023), these patterns have remained remarkably consistent despite significant changes in the global financial landscape, suggesting deep-rooted cultural and institutional factors at work.
What's the Outlook for Silver Prices?
The Gold-Silver Ratio and Silver's Potential
Silver presents a compelling opportunity due to several factors that suggest potential outperformance relative to gold:
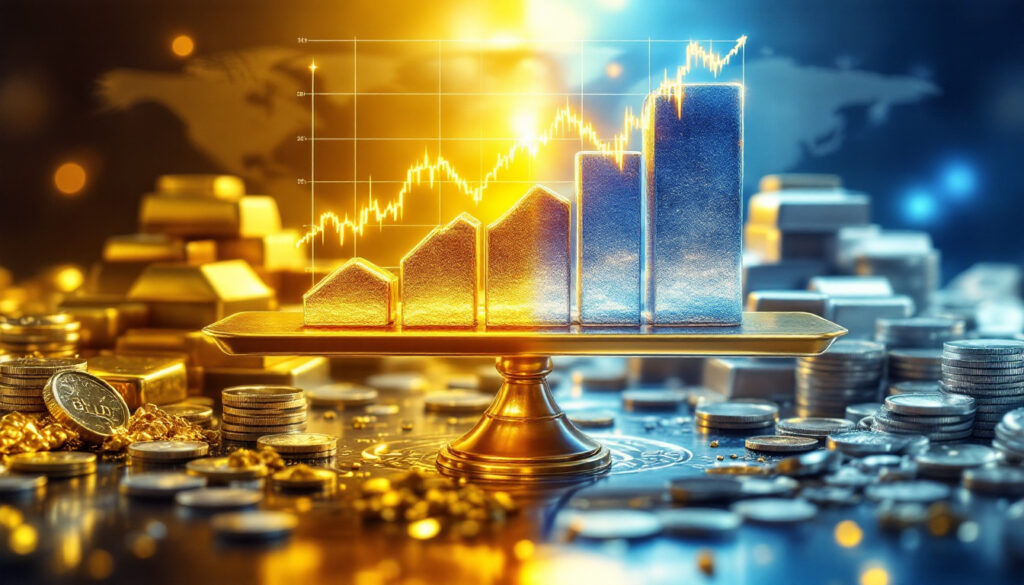
- Extreme undervaluation relative to gold (gold-silver ratio around 100:1)
- Mining ratio of approximately 7:1 (silver to gold) versus market ratio of 98:1
- Historical pattern of silver lagging gold but eventually catching up dramatically
- Movement into the $30-50 trading range, with $50 becoming a price magnet
Keith Neumeyer, CEO of First Majestic Silver, highlighted during a Q1 2024 earnings call that "the mining ratio is 7:1 versus a market ratio of 98:1," pointing to a fundamental disconnect between production realities and market pricing.
Silver displays a massive multi-decade cup and handle pattern on logarithmic charts, suggesting potential targets of:
- $100 (linear projection)
- Up to $500 (logarithmic projection, especially if the gold-silver ratio contracts to historical norms around 15:1)
What makes silver particularly interesting is its dual role as both a precious metal and an industrial metal. Growing demand from green energy technologies (solar panels, electric vehicles) and electronics provides additional support beyond investment demand.
Silver's Technical Picture
On daily charts, silver shows several promising technical developments:
- Nearly 60% appreciation over the past 15 months
- Trading around its 50-day moving average and well above the 200-day moving average
- Consolidation in a flag pattern with resistance at $34-35
- Potential for explosive moves once $35 is broken (similar to summer 2020 when silver doubled in five weeks)
The 2020 precedent is particularly relevant, as silver surged from $20 to $40 in just five weeks once key resistance levels were broken. This type of explosive move is characteristic of silver's smaller market size compared to gold, where relatively modest inflows can drive outsized price movements.
Silver's technical picture is further enhanced by its relationship to gold. Historically, silver tends to underperform during the early stages of precious metals bull markets but dramatically outperforms during the later, more speculative phases. The current gold-stock relationship suggests this catch-up phase may be imminent.
How Are Mining Stocks Performing Relative to Metals Prices?
The TSX Venture Index, which includes many junior mining companies, shows promising technical developments that suggest a sector rotation may be underway:
- Formation of a long-term bottom pattern over 15 years
- Recent uptrend gaining momentum
- Strong recovery from the March/April market turbulence
- Outperformance relative to silver prices
This suggests that undervalued mining stocks may finally be catching up to the metals' price action, potentially offering significant opportunities in the second half of the year.
Mining stocks typically offer leverage to metals prices due to their operational structure. When gold prices rise significantly above production costs, profits can increase exponentially. For example, a miner with all-in sustaining costs of $1,500 per ounce would see profits double if gold moved from $2,500 to $3,500.
The TSX Venture Index's 15-year basing pattern is particularly significant. Extended consolidation periods often precede major bull markets, as the sector undergoes consolidation, cost-cutting, and operational improvements. The companies that survive such periods are typically well-positioned to capitalize on improving market conditions.
Many junior miners are now trading at valuations that suggest minimal value for their exploration potential, creating asymmetric risk-reward profiles where downside is limited while upside potential remains substantial if precious metals prices continue their uptrend.
What's the Bottom Line for Precious Metals Investors?
The technical analysis suggests four key conclusions for investors considering precious metals exposure:
-
Gold likely remains in a long-term bull market despite the recent pullback, with structural support from physical buying and central bank demand
-
Consolidation between $3,000-3,400 appears most probable in the near term, with solid support established around the $3,050 level
-
Silver offers exceptional value at current prices with potential for dramatic outperformance, particularly if it breaks above the $35 resistance level
-
Mining stocks are showing signs of accelerating momentum after lagging the metals, potentially offering significant leverage to continued strength in gold and silver prices
"The fundamental shift from paper to physical markets represents a structural change in how precious metals are valued. This isn't merely a cyclical bull market – it's a remonetization event." – Florian Grummes, Frankfurt Precious Metals Conference, 2024
For physical metal investors, silver currently presents better value than gold at these price levels, while mining stocks may offer leverage to the underlying metals as the sector gains momentum.
The record gold analysis suggests we're in the early stages of a historic price surge that could extend well beyond current levels. Furthermore, a potential silver market squeeze could dramatically accelerate price movements in that metal. Investors looking to capitalize on these trends should consider various investment strategies based on their risk tolerance and time horizon.
For those wanting to track current gold and silver prices, resources like Perth Mint's price charts and Kitco's precious metals pricing provide reliable real-time data.
Disclaimer: This analysis is based on technical patterns and market observations. Precious metals markets can be volatile, and past performance does not guarantee future results. Investors should conduct their own research and consider their risk tolerance before making investment decisions.
Want to Capitalise on the Next Major Mineral Discovery?
Stay ahead of the market with Discovery Alert's proprietary Discovery IQ model, which instantly notifies investors of significant ASX mineral discoveries and translates complex mineral data into actionable insights. Understand why historic discoveries like De Grey Mining can generate substantial returns by visiting Discovery Alert's dedicated discoveries page.