What's Driving Gold and Silver Prices to New Heights?
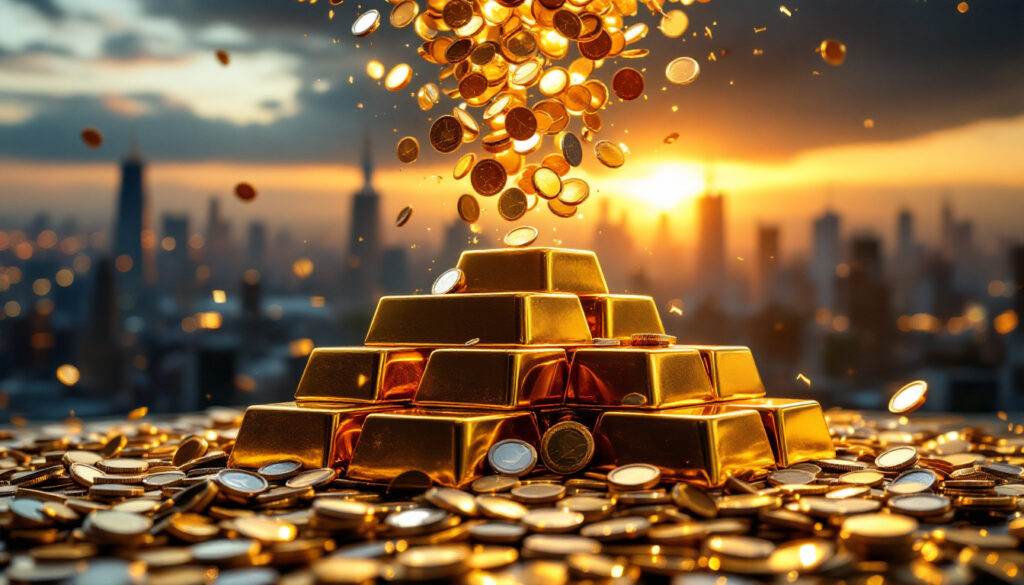
Gold has recently achieved remarkable momentum, surging to unprecedented all-time gold highs analysis with a striking $100 single-day increase that pushed prices above $2,400 per ounce. Silver has followed this impressive trajectory, approaching the $34 mark. These precious metals are significantly outperforming most other commodities in the current market environment, with gold potentially emerging as the strongest performer across all futures markets in recent months.
The World Gold Council reports that central bank gold purchases reached a staggering 1,136 tonnes in 2023, highlighting the institutional confidence in gold as a reserve asset. This trend shows no signs of slowing as we progress through 2025.
Recent Price Movements and Market Dynamics
The precious metals market is experiencing a fundamental shift in investor sentiment. Gold's ability to break through previous resistance levels with such momentum indicates strong buying pressure from both institutional and retail investors. What's particularly noteworthy is that this rally is occurring despite periods of dollar strength, breaking the traditional inverse relationship that has historically existed between gold and the US dollar.
Silver's approach to $34 per ounce represents a significant move from its previous trading range, though it remains approximately 32% below its 2011 peak of $49 per ounce. The gold-silver ratio insights currently stands at approximately 70:1, compared to a historical average closer to 30:1, suggesting potential for silver to outperform gold if historical relationships reassert themselves.
Economic Uncertainty and Central Bank Policies
The ongoing monetary policies of central banks worldwide continue to be the primary driver supporting precious metals prices. As Mike Melisinos pointedly stated in a recent Wall Street Bullion interview: "They're never going to stop printing… central banks will keep stimulating to prevent crashes." This perspective captures the essence of modern monetary theory implementation.
The Federal Reserve's balance sheet remains elevated at approximately $7.4 trillion as of May 2025, according to the Federal Reserve's H.4.1 report. This massive expansion of the money supply—an increase of more than $5 trillion since 2020—has created persistent currency debasement concerns among investors.
Negative real interest rates, currently at -1.4% based on 10-year TIPS yield data, create a favorable environment for non-yielding assets like gold and silver. Historically, precious metals have performed exceptionally well during periods of negative real rates, as seen during the 2008 crisis when gold rose approximately 250% during the Fed's quantitative easing programs.
Another significant development often overlooked is the BRICS nations' 28% increase in gold reserves over the past year, according to IMF data. This strategic diversification away from dollar-denominated assets represents a structural shift in global reserve currency preferences.
How Do Current Gold and Silver Prices Compare Historically?
When examining gold and silver prices from a historical perspective, we're witnessing a unique period in precious metals markets. Gold has not only broken through previous nominal highs but has also surpassed the inflation-adjusted 2011 high of approximately $2,300 per ounce (calculated using Bloomberg's CPI calculator).
Breaking Through Historical Resistance Levels
Gold's decisive break above previous resistance levels represents a significant technical development. Unlike many commodities that experience long periods of sideways movement, gold has demonstrated remarkable strength in recent months, convincingly clearing previous all-time highs from 2020 and 2011.
As Mike Melisinos astutely observed, "New highs rewrite charts – technical analysis becomes less relevant" when an asset enters price discovery mode. This phenomenon often leads to acceleration in price movement as traditional resistance levels no longer contain upward momentum.
Gold mining production peaked at approximately 3,300 tonnes in 2018 according to USGS data, with subsequent years showing flat or declining output despite significantly higher prices. This supply constraint adds structural support to the current bull market.
Silver's Price Patterns and Volatility
Silver has historically exhibited substantially more volatility than gold, with Bloomberg data showing 50-year volatility of 26.4% for silver versus 15.7% for gold. This characteristic often results in dramatic price spikes followed by extended periods of consolidation.
Current silver prices around $34 per ounce represent significant movement from recent ranges but remain notably below the all-time highs reached in 2011. What makes silver particularly interesting is its dual role—functioning both as a monetary metal like gold and an industrial metal with growing applications in renewable energy and electronics.
The Silver Institute projects that solar panel production alone will consume approximately 180 million ounces of silver in 2025, representing nearly 15% of annual mine supply. This industrial demand provides an additional price driver that gold doesn't have.
Comparing Current Rally to Previous Bull Markets
The 1970s bull market saw gold rise approximately 2,300% over the decade as the world transitioned away from the Bretton Woods system. While such gains may seem implausible in today's market, they illustrate the potential for precious metals when monetary systems undergo structural changes.
More recently, the 2013 "Taper Tantrum" demonstrated the vulnerability of precious metals to shifts in monetary policy, with gold dropping approximately 28% in just six months when the Federal Reserve merely suggested reducing its asset purchases.
What distinguishes the current rally from previous cycles is the unprecedented level of global debt, which the Institute of International Finance reports has reached $315 trillion as of Q1 2025. This debt burden limits central banks' ability to normalize monetary policy without triggering financial instability—creating an environment that continues to favor precious metals as monetary alternatives.
What Factors Are Influencing Investor Sentiment in Precious Metals?
Investor sentiment toward precious metals is being shaped by a complex interplay of factors that extend beyond traditional inflation hedging. From macroeconomic signals to institutional positioning, several key elements are driving capital toward the gold and silver markets.
Stock Market Volatility and Correlation
Recent stock market movements have demonstrated significant volatility, with the CBOE Volatility Index (VIX) hovering around 22.3 as of May 2025. This elevated level of uncertainty has prompted investors to seek portfolio diversification through precious metals allocation.
Gold's correlation with equities has been notably negative since 2020, with Bloomberg data showing a -0.41 correlation coefficient between gold and the S&P 500. This negative correlation makes gold particularly valuable during periods of equity market stress.
Historical examples underscore this relationship. During the 2000 dot-com crash, gold outperformed the Nasdaq by approximately 58%. Similarly, in 2022, as rising interest rates pressured both stocks and bonds, gold managed to gain 4% while the aggregate bond market lost 13%.
Institutional Positioning and Market Signals
Major investors like Warren Buffett have adopted increasingly defensive positions, with Berkshire Hathaway holding approximately $157 billion in Treasury securities according to their Q1 2025 SEC filing. This represents approximately 5% of Berkshire's portfolio and signals caution about traditional equity market valuations.
As Mike Melisinos noted, "Defensive positioning by Buffett signals institutional caution" about the broader economic outlook. This sentiment is reflected in gold ETF holdings, which the World Gold Council reports have reached approximately 3,600 tonnes as of May 2025.
CFTC Commitment of Traders data shows commercial entities reducing their traditional short positions in precious metals futures, suggesting that even industry professionals who typically hedge production are becoming hesitant to bet against further price increases.
Yield Curve Dynamics and Recession Indicators
The yield curve, which was inverted for approximately two years, has begun to normalize. According to research from the National Bureau of Economic Research (NBER), yield curve inversions have preceded the last 9 recessions in the United States.
The Sahm Rule, developed by Federal Reserve economist Claudia Sahm, triggers a recession signal when the three-month moving average of the unemployment rate rises by 0.5 percentage points or more from its 12-month low. This indicator has begun flashing warning signs in recent months.
China's economic slowdown, with GDP growth decelerating by approximately 1.2% year-over-year, adds another layer of uncertainty to global markets. While reduced industrial activity might typically pressure industrial metals, the monetary dimension of gold and silver often outweighs these concerns during periods of global economic uncertainty.
How Should Investors Approach Gold and Silver in Their Portfolios?
Incorporating precious metals effectively into investment portfolios requires strategic thinking that balances opportunity with prudent risk management. The unique characteristics of gold and silver as monetary metals necessitate approaches that differ from traditional equity or fixed-income allocations.
Technical Analysis Considerations
When assets like gold make new all-time highs, traditional technical analysis frameworks become less relevant as price discovery enters uncharted territory. As Mike Melisinos emphasized, "Most investors exit early – hold core positions through volatility" rather than attempting to time precise tops and bottoms.
Investors should maintain flexibility in their price projections and avoid letting historical chart patterns limit their perspective on potential price movements. The continuous futures charts may differ from spot prices, but the overall trend remains strongly positive across all precious metals instruments.
The Sharpe ratio (risk-adjusted return) for gold over the 2000-2025 period stands at an impressive 0.87, compared to 0.65 for the S&P 500 over the same timeframe. This highlights gold's efficiency as an investment beyond mere price appreciation.
Long-Term Investment Strategies
For long-term investors, maintaining exposure to precious metals through market cycles can be challenging but potentially rewarding. A Vanguard study found that strategic rebalancing of precious metals allocations contributed approximately 1.2% annual alpha to diversified portfolios over a 20-year period.
Yale University's endowment maintains an approximately 8% allocation to commodities and real assets as part of its strategic asset allocation. This institutional approach demonstrates the role of precious metals in sophisticated portfolio construction.
"The biggest mistake investors make with gold and silver is selling too early in bull markets. The gains often come in concentrated periods of dramatic price appreciation." – Mike Melisinos
Options strategies can provide downside protection while maintaining upside exposure. For example, protective puts on metal ETFs can limit potential losses while collar strategies can generate income while defining both upside potential and downside risk.
Portfolio Allocation Considerations
Research from the National Bureau of Economic Research suggests an optimal portfolio allocation of 5-10% to precious metals based on 45-year backtests. This allocation provides meaningful diversification benefits without overexposing the portfolio to a single asset class.
An often-overlooked consideration is the difference between physical bullion ownership and paper gold instruments. Physical metal storage costs typically range from 0.5% to 1.5% annually, while ETF expense ratios for precious metals funds average 0.25-0.50%. However, physical ownership eliminates counterparty risk inherent in paper claims.
Interestingly, gold mining stocks analysis shows they have underperformed physical gold by approximately 15% in 2024, creating potential value opportunities for investors seeking operational leverage to higher metals prices. Mining companies with strong balance sheets and growing production profiles may offer amplified exposure to continuing strength in underlying metals.
What's the Outlook for Gold and Silver Prices?
The outlook for precious metals remains influenced by a complex interplay of monetary policy, geopolitical factors, supply constraints, and evolving industrial demand patterns. While forecasts inherently contain uncertainty, several structural factors support the case for continued strength in gold and silver markets.
Short-Term Price Projections
In the near term, both gold and silver appear positioned for continued momentum, with gold leading the rally. The breakout to new all-time highs removes psychological resistance levels and opens the potential for accelerated upside movement as new investors enter the market.
The Federal Reserve's dot plot currently projects three interest rate cuts through 2026, creating a supportive environment for non-yielding assets like precious metals. With production costs averaging approximately $1,250 per ounce according to the World Gold Council, miners remain profitable even if prices experience temporary pullbacks.
Silver typically follows gold's lead but with greater percentage moves due to its smaller market size. The current gold-to-silver ratio of 70:1 remains well above historical averages, suggesting potential for silver to outperform if industrial demand strengthens alongside investment flows.
Medium-Term Market Drivers
Looking ahead 6-12 months, several factors support continued strength in precious metals prices:
- Persistent inflation concerns: Despite official narratives of contained inflation, real-world price increases in housing, healthcare, and education continue to erode purchasing power
- Geopolitical tensions: Ongoing conflicts and trade frictions increase the appeal of borderless, neutral assets like gold and silver
- Central bank gold purchasing programs: National banks continue to accumulate gold at historically elevated levels
- Mining supply constraints: Decades of underinvestment in exploration limit the ability of miners to significantly increase production
Between 2020 and 2024, gold appreciated approximately 62% while the US dollar's trade-weighted index declined 7%, demonstrating gold's effectiveness as a currency hedge during periods of monetary expansion.
Long-Term Structural Factors
Mike Melisinos captured a key insight when stating that "Monetary metals benefit from currency debasement endgames." This perspective aligns with historical precedent—periods of extraordinary monetary creation have consistently corresponded with rising precious metals valuations.
The long-term case for precious metals remains supported by structural factors including:
- Unsustainable government debt levels: The IIF reports global debt has reached $315 trillion as of Q1 2025
- Potential currency debasement: Continued monetary expansion appears inevitable given fiscal constraints
- Growing institutional recognition: Precious metals increasingly viewed as necessary portfolio components
- Technological demand shifts: Silver's industrial applications in renewable energy and electronics (45 million ounces for AI chips in 2024 alone according to Semi.org)
The BRICS nations' efforts to develop alternatives to dollar-denominated trade settlement represent another potential catalyst for precious metals. While still developing, any substantial shift away from dollar hegemony would likely benefit monetary alternatives like gold and silver.
Disclaimer: Precious metals prices can be volatile in the short term. These projections represent potential outcomes based on current information and historical patterns but are not guarantees of future performance. Investors should conduct their own research and consider their individual financial circumstances before making investment decisions.
How Do Other Precious Metals Compare to Gold and Silver?
While gold and silver receive the most attention from investors, the broader precious metals complex includes platinum, palladium, and rhodium—each with distinct market dynamics and applications. Understanding these differences provides valuable context for comprehensive precious metals investment strategies.
Platinum Market Dynamics
Unlike gold and silver, platinum currently shows relative weakness, trading at approximately $950 per ounce as of May 2025—42% below its 2008 high. This underperformance largely stems from platinum's heavy reliance on the automotive sector, with the World Platinum Investment Council (WPIC) reporting that approximately 60% of platinum demand comes from diesel catalytic converters.
The global transition toward electric vehicles represents a significant headwind for platinum, as EVs don't require catalytic converters. This shift in automotive technology has fundamentally altered platinum's demand outlook, contributing to its underperformance relative to gold and silver.
Mike Melisinos concisely explained this dynamic: "Platinum suffers from EV transition headwinds," highlighting how technological shifts can dramatically impact commodity markets. The 2015 "Dieselgate" emissions scandal demonstrated this vulnerability, with platinum falling approximately 40% in just six months as diesel vehicle demand projections collapsed.
Palladium Price Action
Palladium experienced extraordinary price appreciation from 2016 to 2022, surging from approximately $500 per ounce to over $3,000. However, Johnson Matthey reports that palladium has subsequently crashed approximately 72% from its peak, demonstrating the extreme volatility that can affect smaller precious metals markets.
This volatility stemmed from palladium's concentrated supply (Russia produces approximately 40% of global output) and its essential role in gasoline vehicle catalytic converters. The 2022 Russia sanctions triggered a 137% price spike as supply concerns dominated the market.
Rhodium, an even smaller precious metals market, exhibited even more dramatic price action—peaking near $30,000 per ounce in 2021 before falling to approximately $8,500 today. These extreme moves highlight how supply-demand imbalances in niche metals can create both opportunities and risks for specialized investors.
Comparative Strength Analysis
Among the precious metals complex, gold currently demonstrates the strongest technical position, followed by silver. This relative strength hierarchy often provides clues about broader market sentiment toward hard assets and inflation hedges.
Looking forward, hydrogen fuel cell technology could potentially revitalize platinum demand, as this energy technology requires significant platinum loadings. However, commercial adoption remains in early stages, and the timeline for meaningful impact remains uncertain.
Nickel, while not a precious metal, competes with platinum group metals in certain applications and has experienced its own volatility. Battery technology developments continue to influence demand patterns across these interconnected metal markets.
An important consideration for investors is liquidity—gold and silver markets offer substantially greater depth and lower bid-ask spreads compared to platinum group metals. This liquidity advantage becomes particularly valuable during periods of market stress when the ability to efficiently enter or exit positions becomes crucial.
FAQs About Gold and Silver Prices
What causes gold and silver prices to rise?
Gold and silver prices typically rise during periods of economic uncertainty, inflation concerns, currency debasement, geopolitical tensions, and when real interest rates (nominal rates minus inflation) are low or negative. The Federal Reserve Economic Data shows that negative real interest rates, currently at -1.4%
Ready to Capitalise on the Next Major Mineral Discovery?
Stay ahead of the market with Discovery Alert's proprietary Discovery IQ model that instantly notifies investors about significant ASX mineral discoveries, transforming complex data into actionable insights. Visit our dedicated discoveries page to understand how major mineral discoveries like De Grey Mining and WA1 Resources generated substantial returns for early investors.