Understanding the Gold/Silver Ratio: Historical Patterns and Market Implications
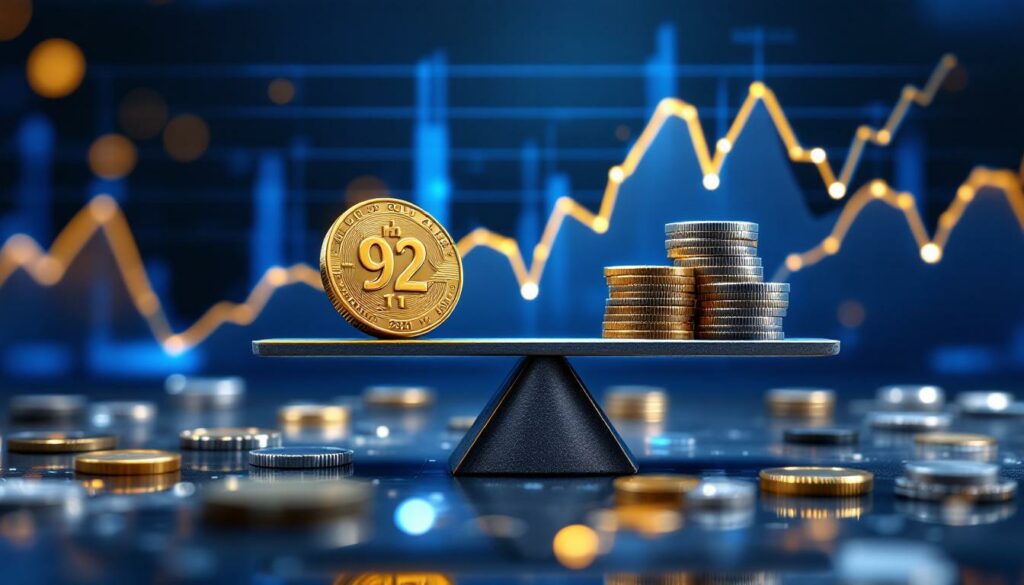
The gold/silver ratio represents the number of silver ounces required to purchase one ounce of gold. This metric is calculated by dividing the current gold price by the current silver price. For example, if gold trades at $2,300 per ounce and silver at $25 per ounce, the ratio would be 92.
Throughout history, the gold and silver ratio has served as a key indicator for precious metals investors. Dating back centuries to when both metals functioned as currency, this relationship provided insights into relative value. While the ratio averaged around 15:1 during the era of bimetallism in the 19th century, modern markets have witnessed much wider fluctuations.
The current ratio of 92 (as of July 2025) sits approximately 40% above its 25-year historical average of about 66, suggesting a significant deviation from long-term norms according to recent gold/silver ratio insights.
"The gold/silver ratio isn't just a numerical relationship—it's a window into market psychology and economic conditions," notes veteran precious metals analyst James Richardson of Capital Metals Research.
Historical Context and Significance
The ratio's importance has evolved alongside monetary systems. When the U.S. operated under a bimetallic standard in the 1800s, the government maintained a fixed 15:1 ratio. After the abandonment of the silver standard and subsequent gold standard, the ratio became a floating market indicator rather than a fixed policy target.
Modern investors track the ratio to identify potential imbalances between the two metals. Historically, extreme ratio readings—particularly above 80—have often signaled potential turning points in the market.
How Does the Gold/Silver Ratio Work as a Market Indicator?
Analysis of 25 years of precious metals market data reveals a compelling pattern: significant peaks in the gold/silver ratio have frequently preceded major upward movements in silver prices. This correlation suggests the ratio may serve as a potential indicator of silver's relative undervaluation compared to gold.
When the ratio reaches historically elevated levels, it often signals that silver has become undervalued relative to gold based on long-term averages. Subsequent market adjustments typically involve silver prices rising faster than gold prices, bringing the ratio back toward historical norms.
Silver's Dual Nature
The relationship between the ratio and subsequent price movements is partly explained by silver's unique position as both:
- A monetary metal with store-of-value properties similar to gold
- An industrial metal with growing applications in technology and renewable energy
This dual nature creates different demand drivers than gold, which functions primarily as a monetary metal and store of value. Silver's industrial demand—accounting for approximately 50% of annual consumption according to the Silver Institute—makes it responsive to both economic cycles and investment sentiment.
"Silver operates at the fascinating intersection of precious metal investment and industrial commodity," explains Dr. Maria Chen, commodities economist at Global Resource Analytics. "This duality explains much of its price behavior relative to gold during different economic phases."
Historical Case Studies: When High Ratios Preceded Silver Price Surges
Over the past quarter-century, five distinct episodes demonstrate the relationship between elevated gold/silver ratios and subsequent silver price performance. These cases provide compelling evidence of the ratio's potential as a market timing indicator.
Post-Dot Com Recovery (2003-2008)
- Ratio Peak: The gold/silver ratio reached 80 in late 2002
- Silver Performance: Following this peak, silver prices began a multi-year climb
- Percentage Gain: +340% from the cycle low to the 2008 high point
- Contributing Factors: Economic recovery, increasing industrial demand, and growing investment interest
During this period, silver rose from under $5 per ounce to over $20, outperforming most major asset classes as technology sector demand recovered and investment interest surged.
Post-Financial Crisis Period (2008-2011)
- Ratio Peak: The ratio spiked to 84 during the 2008 global financial crisis
- Silver Performance: A substantial rally followed as markets recovered
- Percentage Gain: +391% from the cycle low to the 2011 peak
- Contributing Factors: Quantitative easing, inflation concerns, and safe-haven demand
This period saw one of silver's most dramatic modern rallies, with prices surging from approximately $9 to over $48 per ounce in less than three years. The unprecedented monetary stimulus from central banks worldwide fueled concerns about currency debasement, driving strong investment demand for silver.
Mid-Cycle Consolidation (2016-2018)
- Ratio Peak: A notable high of 83 in 2016
- Silver Performance: The peak coincided with the beginning of a significant upswing
- Percentage Gain: +47% from the cycle low
- Contributing Factors: Improving industrial outlook and monetary policy shifts
While more modest than previous cycles, this period demonstrated the pattern's consistency even during less dramatic market conditions.
COVID-19 Pandemic Period (2020-2021)
- Ratio Peak: The ratio reached a modern record high of 125 during the pandemic
- Silver Performance: A sharp increase in silver prices followed
- Percentage Gain: +104% from the cycle low
- Contributing Factors: Unprecedented stimulus measures, supply chain disruptions, and inflation fears
The pandemic created extreme market conditions, with the gold/silver ratio briefly exceeding 120—its highest level in recorded history. Silver's subsequent doubling from under $12 to over $29 per ounce represented one of the metal's fastest major advances.
Rate Hike Environment (2022-2025)
- Ratio Trend: Elevated gold/silver ratio during monetary tightening
- Silver Performance: +102% gain from the 2022 low (as of July 2025)
- Contributing Factors: Industrial demand recovery, energy transition applications, and monetary policy expectations
Despite headwinds from rising interest rates, silver has doubled from its 2022 lows, driven by accelerating industrial demand, particularly in solar panel manufacturing and electrical applications, and the broader silver market squeeze impact on global finance.
| Period | Starting Ratio | Silver Price Low | Silver Price Peak | % Gain | Duration |
|---|---|---|---|---|---|
| 2003-2008 | 80 | $4.37 | $19.23 | +340% | 5 years |
| 2008-2011 | 84 | $8.79 | $48.70 | +391% | 2.5 years |
| 2016-2018 | 83 | $13.73 | $20.14 | +47% | 2 years |
| 2020-2021 | 125 | $11.64 | $29.59 | +104% | 1 year |
| 2022-2025 | 95 | $17.54 | $35.42 | +102% | 3 years |
Why Does This Pattern Occur in Precious Metals Markets?
The recurring relationship between elevated gold/silver ratios and subsequent silver outperformance stems from several fundamental market dynamics unique to precious metals.
Market Size Dynamics
The silver market is substantially smaller than the gold market in terms of total value. The annual silver market represents approximately $30 billion in value compared to gold's $180 billion market (based on recent production volumes and prices). This size disparity means that relatively modest capital flows into silver can create significant price movements.
"When investment capital shifts toward silver, the impact is magnified by the market's relatively small size," notes Michael Westfield, precious metals strategist at Resource Capital Advisors. "It's like pouring the same amount of water into a small cup versus a large bowl—the smaller container fills much faster."
Industrial Demand Influence
Unlike gold, approximately 50% of silver demand comes from industrial applications. When economic conditions improve following periods of uncertainty (when the ratio typically peaks), industrial silver demand often recovers strongly.
This industrial component creates a dual catalyst for price appreciation:
- Recovery in existing applications (electronics, photography, medical)
- Growth in emerging technologies (solar panels, EVs, 5G infrastructure)
The energy transition has particularly strengthened this relationship, with solar panel manufacturing now consuming over 10% of annual silver production.
Investment Psychology
High gold/silver ratios may signal to investors that silver is undervalued relative to gold, potentially triggering increased investment in silver and subsequent price appreciation.
This psychological component often becomes self-reinforcing when:
- Value investors identify the relative discount
- Momentum traders follow the initial price moves
- Retail investors join as media attention increases
How to Interpret the Current Gold/Silver Ratio
Present Ratio Analysis
The current ratio of 92 (July 2025) stands significantly above the 25-year historical average of 66, placing it at an elevated level from a historical perspective. While not at the extreme levels seen during the 2020 pandemic (125), the current reading remains in the upper quartile of historical observations.
This elevated position suggests potential for mean reversion through either:
- Silver prices rising faster than gold
- Gold prices falling faster than silver
- Some combination of both movements
Contextual Factors to Consider
Several key factors influence how investors should interpret the current ratio:
Global Economic Conditions
- Post-pandemic recovery continuing but showing signs of slowing
- Regional growth divergences between emerging and developed markets
- Trade tensions affecting industrial metals supply chains
Industrial Demand Projections
- Renewable energy deployment accelerating (especially solar)
- EV production increasing (silver used in electrical contacts)
- Electronics sector recovery from chip shortage
Monetary Policy Direction
- Central bank policy normalization following inflation spike
- Potential for renewed easing if economic growth falters
- Divergence between Federal Reserve and other major central banks
Supply Constraints
- Primary silver mine production growth limited
- By-product silver from base metal mining affected by copper/lead/zinc economics
- Recycling rates increasing but insufficient to meet demand growth
Investment Demand Trends
- ETF holdings relatively stable after 2021-2022 outflows
- Retail coin and bar demand showing regional strength
- Institutional interest increasing as inflation concerns persist
Potential Market Implications
While historical patterns suggest the elevated ratio could indicate potential upside for silver prices, investors should consider multiple factors beyond just the ratio when forming market expectations.
The current technical setup shows similarities to previous ratio peaks, but with important differences:
- Similar to 2003: Recovering industrial demand
- Similar to 2016: Mid-cycle consolidation
- Different from 2008/2020: Less acute economic crisis
"The gold/silver ratio should be viewed as one indicator within a broader analytical framework," cautions Dr. Elaine Wong, metals analyst at Commodity Research Partners. "Historical patterns provide context but never perfect roadmaps."
How Investors Use the Gold/Silver Ratio
Sophisticated investors employ several strategies based on the gold and silver ratio to optimize precious metals exposure and potentially enhance returns.
Ratio Trading Strategies
Some investors use the ratio to determine optimal entry and exit points, buying silver and selling gold when the ratio is historically high, then reversing the trade when the ratio normalizes.
Example Mechanics:
- When ratio exceeds 80: Convert some gold holdings to silver
- When ratio falls below 60: Convert some silver holdings back to gold
- Repeat through market cycles
This approach allows investors to maintain precious metals exposure while potentially capturing the outperformance of the undervalued metal. Historical backtesting suggests this strategy would have outperformed a static allocation by approximately 1.5% annually over the past 25 years.
Portfolio Allocation Considerations
The ratio can inform decisions about the relative allocation between gold and silver in a precious metals portfolio, potentially increasing silver exposure when the ratio suggests relative undervaluation.
A dynamic allocation approach might include:
- Base allocation: 70% gold / 30% silver (standard defensive positioning)
- Ratio above 80: Shift to 60% gold / 40% silver
- Ratio above 90: Shift to 50% gold / 50% silver
- Ratio below 60: Return to base allocation
This methodical approach helps investors maintain discipline rather than making emotional decisions during market volatility.
Risk Management Applications
Understanding the historical relationship between ratio peaks and subsequent silver price movements can help investors manage expectations and position sizing in precious metals investments.
Key risk considerations include:
- Volatility expectations: Silver typically exhibits 1.5-2x the volatility of gold
- Correlation shifts: Gold-silver correlation can vary from 0.7-0.9 depending on market conditions
- Timeframe sensitivity: Ratio strategies generally require 1-3 year horizons for mean reversion
"Properly sized positions are essential when implementing ratio-based strategies," advises wealth manager Patricia Hernandez. "Silver's higher volatility means smaller position sizes are appropriate compared to gold allocations."
FAQ: Common Questions About the Gold/Silver Ratio
What is considered a "high" gold/silver ratio?
Historically, ratios above 80 have been considered elevated, with readings above 90 reaching the upper extremes of the modern trading range. During the past 50 years:
- Above 80: Occurred less than 20% of the time
- Above 90: Occurred less than 10% of the time
- Above 100: Rare, occurring only during extreme market dislocations (2020 pandemic)
The ratio's historical average has varied by era:
- Pre-20th century: Approximately 15:1 (often fixed by monetary policy)
- 20th century: Approximately 45:1
- Past 25 years: Approximately 66:1
Does the ratio always predict silver price movements?
No, while the historical correlation is notable, past performance does not guarantee future results. Multiple factors influence precious metals prices beyond just their relative values.
The ratio's predictive value has varied by decade, with several notable exceptions:
- 1980s silver collapse: Ratio increased despite already elevated levels
- 2013-2015 bear market: Both metals declined together without ratio mean reversion
- 2018-2019 period: Ratio remained elevated without triggering significant silver outperformance
Investors should view the ratio as one tool among many rather than a definitive timing indicator.
How does inflation affect the gold/silver ratio?
Inflation concerns typically benefit both metals, but silver has historically shown greater percentage gains during inflationary periods, potentially leading to a declining ratio.
During the high inflation of the late 1970s, silver outperformed gold by nearly 4:1, causing the ratio to decline from over 40 to under 20. More recently, the 2010-2011 inflation concerns saw silver outperform gold by approximately 3:1.
This outperformance during inflation is attributed to:
- Silver's industrial component benefiting from economic activity
- Silver's smaller market size amplifying investment flows
- Historical precedent reinforcing silver as an inflation hedge alongside gold as inflation hedge
What role does industrial demand play in the ratio?
Increasing industrial applications for silver, particularly in green technology, can create additional demand drivers that may influence the ratio independently of investment demand.
Key industrial demand factors include:
- Solar panel production: Each gigawatt of solar capacity requires approximately 20-25 tons of silver
- Electric vehicles: Average EV uses 25-50 grams of silver (vs. 15-28 grams in conventional vehicles)
- 5G infrastructure: Higher silver content in telecommunications equipment
- Medical applications: Growing antimicrobial uses in healthcare settings
These industrial applications create a fundamental demand floor for silver that doesn't exist for gold, potentially supporting a long-term reduction in the ratio if industrial uses continue expanding.
Conclusion: The Gold/Silver Ratio as a Market Barometer
The gold and silver ratio represents more than just a simple price relationship—it reflects the complex interplay between monetary and industrial factors affecting both metals. While the historical pattern of ratio peaks preceding silver price rallies is compelling, investors should view it as one tool among many for understanding precious metals markets.
The current elevated ratio of 92 places it in historically significant territory, but any market implications should be considered alongside broader economic conditions, supply-demand fundamentals, and individual investment objectives. Furthermore, the continued gold price highs analysis indicates that both metals remain in a dynamic relationship affected by global market forces.
For active investors, the ratio provides a framework for relative value assessment and potential portfolio adjustments. For long-term holders, it offers context for understanding market cycles within the precious metals complex.
As the global economy navigates post-pandemic challenges and the ongoing energy transition creates new demand patterns for industrial metals, the gold/silver ratio will likely continue serving as an important barometer for precious metals investors.
Disclaimer: Past performance is not indicative of future results. The historical patterns discussed in this article may not repeat, and the gold/silver ratio should not be used as the sole basis for investment decisions. Investors should consult with qualified financial advisors regarding their specific situations and objectives.
Want to Capitalise on the Next Major Mining Discovery?
Discovery Alert's proprietary Discovery IQ model instantly identifies significant ASX mineral discoveries, delivering real-time alerts that transform complex data into actionable insights for investors of all experience levels. Explore why major mineral discoveries lead to substantial market returns by visiting Discovery Alert's dedicated discoveries page and position yourself ahead of the market.