Gold's Historic Rally: Understanding the 2025 Price Surge to All-Time Highs
The precious metals market is witnessing an unprecedented phenomenon as gold continues its remarkable ascent, breaking record after record in what analysts are calling a once-in-a-generation wealth creation opportunity. With 41 all-time high analysis already recorded in 2025 alone, gold has surpassed the previous year's impressive tally of 39 records, firmly establishing this period as one of the most extraordinary in modern financial history.
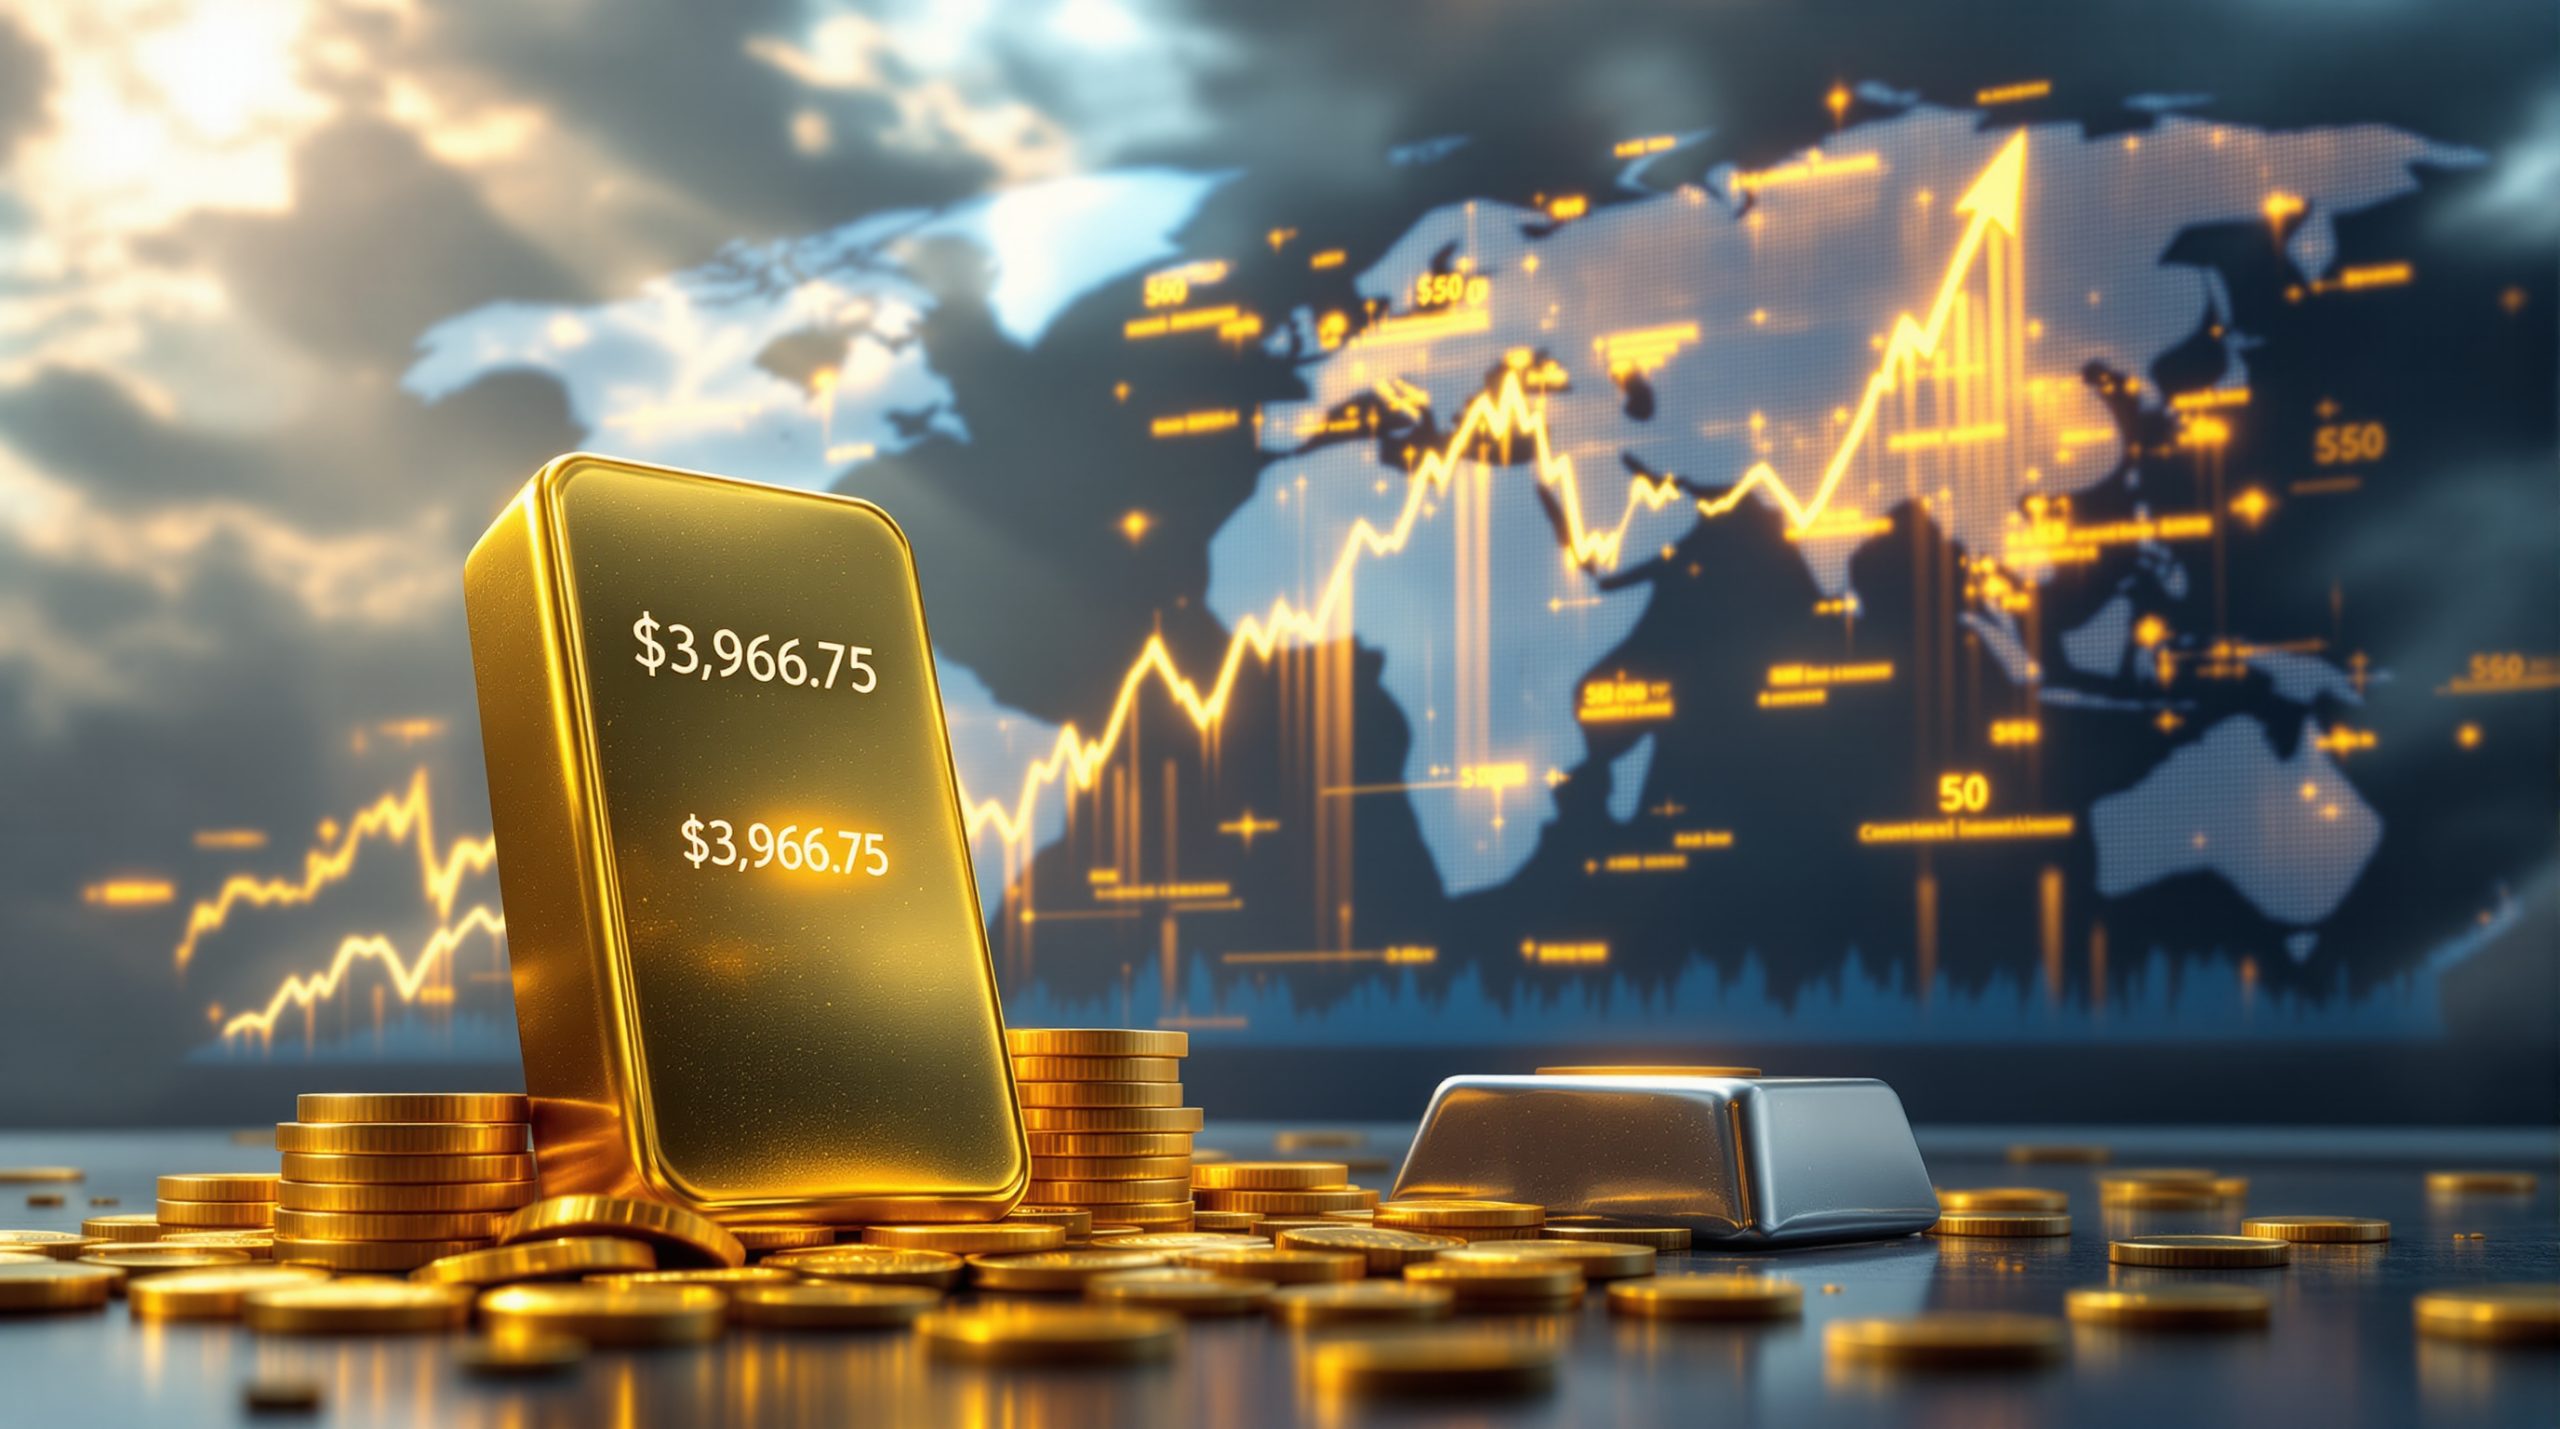
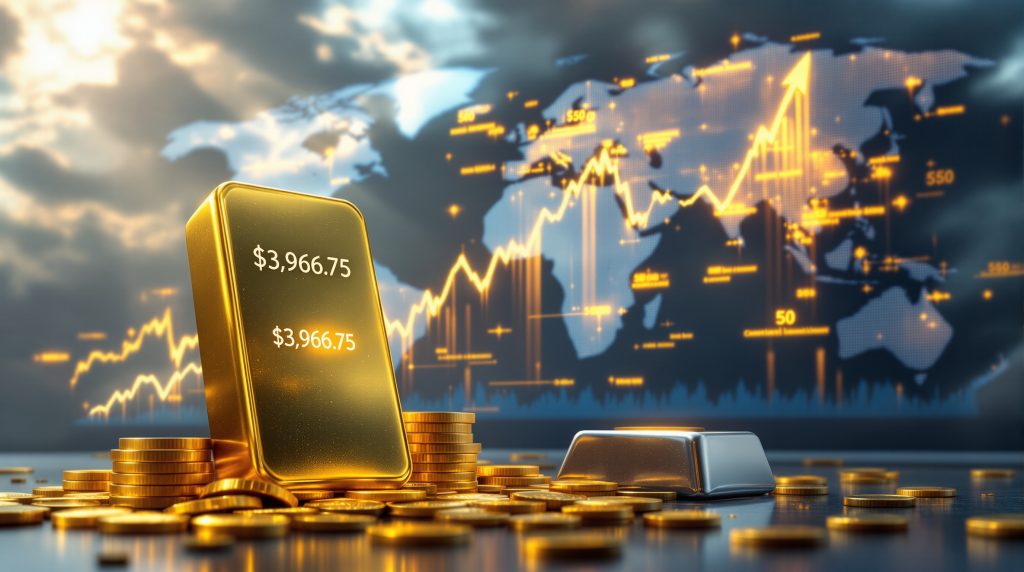
This relentless momentum isn't just impressive—it's historic. Over the past 22 months, gold has posted an astonishing 80 fresh record highs, averaging four new peaks every month for almost two consecutive years. Currently trading at $3,967.75 per ounce (as of October 6, 2025), gold prices reaching all-time highs have surged 50% year-to-date and have more than doubled with a 120% increase since October 2023.
The yellow metal is on track for its strongest annual performance since 1979, firmly positioning itself as one of the best-performing asset classes of 2025. But what exactly is driving this remarkable rally, and how can investors position themselves to benefit from this historic wealth transfer opportunity?
What's Driving Gold's Record-Breaking Performance in 2025?
The Unprecedented Rally in Numbers
The statistics surrounding gold's current rally tell a compelling story of extraordinary market conditions:
- 41 all-time record highs in 2025 alone, surpassing 2024's impressive 39 records
- 80 fresh record highs recorded over the past 22 months
- 50% price increase year-to-date in 2025
- 120% surge since October 2023, rising from approximately $1,800 to over $3,950 per ounce
- Current price of $3,967.75 per ounce (as of October 6, 2025)
- On pace to deliver its strongest yearly rally in over five decades
This rapid appreciation represents one of the most significant wealth creation opportunities in the precious metals sector, with the pace of price discovery accelerating rather than showing signs of exhaustion.
Macroeconomic Catalysts Fueling the Surge
Multiple powerful macroeconomic factors are converging to drive gold's remarkable performance:
-
U.S. Government Shutdown Effects: The ongoing government shutdown has delayed critical economic data releases, creating uncertainty that typically benefits safe-haven assets like gold. Without reliable economic indicators, investors are increasingly turning to precious metals as a store of value.
-
Federal Reserve Policy Shift: The central bank's pivot toward a more accommodative monetary stance, including multiple rate cuts, has significantly reduced the opportunity cost of holding non-yielding assets like gold. Lower interest rates traditionally support higher gold prices reaching all-time highs by decreasing the appeal of interest-bearing alternatives.
-
Currency Market Volatility: The Japanese yen has weakened considerably following the conservative leadership election, contributing to broader currency market instability that typically drives investors toward hard assets like gold.
-
Political Transitions and Uncertainty: Leadership changes in France and other major economies have created political uncertainty, historically a strong catalyst for gold appreciation as investors seek stability during governmental transitions.
-
Trade Tensions and Tariff Policies: The current administration's approach to international trade, including the implementation and threat of new tariffs, has increased economic uncertainty and supply chain concerns, further bolstering the case for gold as a record-high inflation hedge.
How Are Central Banks Influencing the Gold Market?
Record Central Bank Purchasing Patterns
Central banks worldwide have emerged as significant drivers of gold demand, fundamentally altering market dynamics:
-
Strategic Diversification: National reserves managers are actively reducing exposure to traditional reserve currencies, particularly the U.S. dollar, in favor of increasing gold allocations.
-
Regional Accumulation Trends: Emerging market central banks, particularly in Asia and Eastern Europe, have been the most aggressive buyers, with China, Russia, Turkey, and India leading the charge.
-
Geopolitical Hedging: Central banks are increasingly viewing gold as an important geopolitical hedge against Western financial system risks and potential sanctions.
-
De-Dollarization Movement: Many nations are accelerating their "de-dollarization" strategies, with gold serving as the primary alternative reserve asset during this transition.
The scale of central bank buying represents a structural shift in the gold market that wasn't present in previous bull markets. This institutional demand creates a solid floor under prices while simultaneously reducing available supply for other market participants.
Impact on Global Gold Supply Dynamics
The supply side of the gold equation is facing significant challenges that further support higher prices:
-
Production Constraints: Major mining jurisdictions are experiencing declining production volumes due to aging mines, lower ore grades, and regulatory challenges.
-
Reserve Depletion: Gold miners have struggled to replace reserves at the rate they're being depleted, with discovery rates of significant new deposits declining steadily over the past decade.
-
Rising Production Costs: The all-in sustaining costs (AISC) for gold mining operations have increased substantially, creating a higher effective floor price needed to incentivize new production.
-
Environmental Regulations: Stricter environmental standards and permitting challenges have extended development timelines for new mines from discovery to production.
This combination of robust central bank demand and constrained supply has created a fundamental imbalance that market forces can only resolve through higher prices.
What Makes This Gold Rally Different From Previous Cycles?
Historical Context of Gold Super Cycles
To appreciate the current rally's significance, it's essential to place it within historical context:
-
1976-1980 Super Cycle: Gold quadrupled in value during this period, rising from approximately $135 to $850 per ounce, driven by high inflation, geopolitical tensions, and monetary uncertainty.
-
2001-2011 Bull Market: Gold increased nearly seven-fold from its lows around $250 to peak above $1,900, fueled by the aftermath of the dot-com bubble, the 2008 financial crisis, and unprecedented quantitative easing.
-
Current Super Cycle (2023-Present): The ongoing rally shares some characteristics with previous cycles but is distinguished by several unique factors, including the scale of central bank participation and the backdrop of record global debt levels.
The current cycle has already demonstrated remarkable resilience, with gold maintaining its upward trajectory despite periodic increases in real interest rates—a relationship that had historically been more consistently inverse.
Unprecedented Investment Flows
Modern investment vehicles and broader market participation have transformed gold market dynamics:
-
ETF Innovation Impact: Gold-backed ETFs have democratized access to the precious metal, allowing retail investors to gain exposure without the logistics of physical ownership.
-
Record Institutional Allocations: Major pension funds, sovereign wealth funds, and institutional investors are increasing their gold allocations to historically high levels.
-
Retail Investor Participation: Individual investors are entering the gold market at unprecedented rates, driven by concerns about inflation, currency devaluation, and systemic financial risks.
-
Futures Market Positioning: Commercial hedgers, typically producers who sell futures to lock in prices, have decreased their short positions relative to previous cycles, indicating less selling pressure at higher price levels.
This combination of institutional legitimization and retail enthusiasm has created a more diverse and resilient buyer base than in previous cycles, potentially extending the duration and magnitude of the current rally.
Where Are Gold Prices Headed Next?
Major Financial Institutions' Price Projections
The world's leading financial institutions have been continuously revising their price forecast insights upward:
- Average analyst consensus points to $3,675 per ounce by year-end 2025
- Multiple institutions project gold reaching $4,000 per ounce by mid-2026
- The most bullish forecasts suggest $5,000 per ounce is achievable within the current super cycle
- Even traditionally conservative analysts now acknowledge the structural factors supporting a sustained bull market
These projections are based on rigorous analysis of monetary policy trajectories, inflation expectations, currency valuations, and global economic growth forecasts. The convergence of bullish outlooks from diverse institutions suggests the rally has solid fundamental underpinnings.
Technical Analysis of Gold's Price Trajectory
From a technical analysis perspective, gold's chart patterns reveal several important insights:
- Key Resistance Levels: $4,000 represents the next major psychological barrier, with limited historical resistance above this level
- Support Structure: Multiple technical support levels have formed during the rally, creating a "stair-step" pattern that has absorbed selling pressure
- Volume Patterns: Trading volumes have consistently expanded during breakouts, confirming the strength and legitimacy of price advances
- Momentum Indicators: Technical oscillators have maintained positive readings despite the extended rally, suggesting the uptrend remains technically healthy
Technical analysts note that gold's rally has been characterized by relatively low volatility compared to previous bull markets—a sign of a mature market with broader participation and potentially more sustainable price discovery.
How Does Silver Compare in This Precious Metals Rally?
Silver's Remarkable Performance Metrics
While gold has dominated headlines, silver's performance has been equally impressive:
- Nearly 150% increase in just two years, rising from around $20 to approaching $50 per ounce
- Currently trading at 14-year highs with strong momentum indicators
- Five consecutive years of supply deficits with limited new production coming online
- Potential for a historic breakout above the psychologically significant $50 per ounce level, which has twice served as a ceiling for silver prices (in 1980 and 2011)
Silver's historical volatility and smaller market size typically result in more dramatic percentage moves than gold during precious metals bull markets—a pattern that appears to be repeating in the current cycle.
Industrial Demand Driving Silver's Fundamentals
Unlike gold, silver's price is significantly influenced by industrial applications:
-
Solar Energy Revolution: Photovoltaic demand consumes approximately 15% of annual silver production, with solar panel manufacturing requiring silver for its superior electrical conductivity properties.
-
Electric Vehicle Production: Each electric vehicle uses between 25-50 grams of silver in various components, from battery management systems to electrical contacts.
-
5G Infrastructure: The rollout of 5G networks requires significant silver inputs for components that ensure reliable high-frequency data transmission.
-
Advanced Computing Applications: Emerging AI technologies and high-performance computing centers utilize silver in various specialized electronic components.
This dual nature as both a precious metal and an industrial commodity gives silver unique market dynamics that can amplify its performance during periods when both investment and industrial demand are simultaneously strong.
The Gold-Silver Ratio Analysis
The relationship between gold and silver prices provides valuable insights for investors:
-
Current Ratio Context: The gold-to-silver ratio (the number of silver ounces needed to buy one ounce of gold) has compressed from over 100:1 in 2020 to approximately 80:1 currently.
-
Historical Average: The long-term historical average for the ratio is approximately 55:1, suggesting significant potential for additional silver outperformance.
-
Cycle Patterns: During precious metals bull markets, the ratio typically compresses substantially, reaching as low as 15:1 during the 1980 peak.
-
Investment Implications: Many analysts view a declining gold-silver ratio as confirmation of a healthy bull market in precious metals, as it indicates broad-based demand rather than isolated safe-haven buying.
This ratio analysis suggests that while both metals have significant upside potential, silver may offer greater percentage gains if historical patterns repeat.
What Are the Investment Implications of This Historic Rally?
Portfolio Allocation Strategies in a Gold Bull Market
Financial advisors and wealth managers are increasingly recommending precious metals exposure:
-
Baseline Allocations: Conservative portfolio strategies typically suggest 5-10% precious metals exposure as a baseline.
-
Strategic Overweighting: During periods of monetary uncertainty and inflation concerns, tactical increases to 15-25% can provide enhanced portfolio protection.
-
Physical vs. Paper Exposure: Direct ownership of physical gold and silver provides insurance against systemic financial risks, while ETFs and mining stocks offer liquidity and potential leverage.
-
Mining Equity Considerations: Gold and silver mining companies typically provide leverage to metal prices due to their fixed cost structures, potentially delivering outsized returns during bull markets.
The appropriate allocation strategy depends on individual risk tolerance, investment time horizon, and overall financial objectives. However, the historical data suggests that some precious metals exposure benefits virtually all portfolios during periods of financial uncertainty.
Risk Factors That Could Impact Gold's Trajectory
While the outlook remains overwhelmingly positive, several factors could temporarily interrupt gold's ascent:
-
Monetary Policy Reversals: A sudden return to aggressive interest rate hikes could increase the opportunity cost of holding non-yielding assets.
-
Deflation Scenario: A severe economic contraction resulting in deflation rather than inflation would challenge the inflation-hedge narrative for precious metals.
-
Technical Corrections: Even the strongest bull markets experience periodic corrections, with 10-15% pullbacks being normal and healthy within a longer-term uptrend.
-
Dollar Strength: A significant rally in the U.S. dollar, though seemingly unlikely in the current environment, would typically create headwinds for dollar-denominated gold prices.
Prudent investors recognize these risk factors while maintaining focus on the longer-term structural drivers supporting the bull market thesis.
How Can Investors Capitalize on the Current Gold Market?
Entry Point Strategies for New Investors
For those looking to initiate or increase their precious metals exposure:
-
Dollar-Cost Averaging: Systematic buying at regular intervals regardless of price mitigates timing risk and reduces the psychological burden of market entry decisions.
-
Technical Level Purchases: Buying during pullbacks to identified support levels can improve entry prices while maintaining discipline.
-
Fundamental Trigger System: Establishing personal buy signals based on real interest rates, dollar index levels, or inflation readings provides an objective framework for allocation decisions.
-
Scaling Approach: Gradual position building allows investors to average into positions while maintaining capital for potential better opportunities if corrections materialize.
These approaches can be used individually or in combination depending on an investor's comfort with market timing and technical analysis.
Trading Versus Long-Term Holding Considerations
Investors must align their approach with their capabilities and objectives:
-
Time Horizon Implications: Shorter timeframes typically require more active management and technical analysis skills, while longer-term positions can focus more on fundamental drivers.
-
Tax Efficiency: In many jurisdictions, physical precious metals and certain ETFs receive preferential tax treatment compared to mining stocks, particularly for longer holding periods.
-
Liquidity Requirements: Investors should consider their potential need to access funds when choosing between physical metals (less liquid) and exchange-traded products (more liquid).
-
Performance Benchmarking: Establishing clear metrics to evaluate strategy success helps investors maintain discipline during volatile periods and make rational adjustments when necessary.
The gold market offers opportunities for both traders and long-term investors, but success in either approach requires clear objectives, disciplined execution, and realistic expectations.
FAQ: Gold's All-Time Highs in 2025
What factors typically drive gold to new all-time highs?
Gold typically reaches new heights during periods of economic uncertainty, inflation concerns, geopolitical tensions, currency debasement, and shifts in central bank policies. The current environment features all these catalysts simultaneously, creating a perfect storm for gold appreciation.
How does gold perform during recession periods?
Historically, gold has served as a store of value during recessions, often outperforming traditional asset classes like stocks and real estate. During the 2008 financial crisis, for example, gold delivered positive returns while equity markets experienced significant losses. This counter-cyclical performance makes gold particularly valuable during economic downturns.
What is the relationship between interest rates and gold prices?
Lower interest rates generally support higher gold prices by reducing the opportunity cost of holding non-yielding assets. When real interest rates (nominal rates minus inflation) are low or negative, gold typically performs exceptionally well. The current environment of relatively low rates despite inflation concerns creates an ideal backdrop for market performance surge.
How do geopolitical tensions impact gold prices?
International conflicts, political instability, and diplomatic tensions typically drive safe-haven demand for gold as investors seek protection from market volatility and currency fluctuations. The current geopolitical landscape features multiple flashpoints that continue to support gold's risk-hedge appeal.
What role does inflation play in gold's price movement?
Gold has traditionally served as an inflation hedge, with prices often rising when investors seek protection from currency devaluation and purchasing power erosion. The current inflationary environment, combined with unprecedented levels of global debt and monetary expansion, strengthens gold's appeal as a store of value.
The Generational Wealth Transfer Opportunity
Historical Context of Market-Defining Moments
The current gold bull market represents more than just a typical uptrend—it potentially marks a historic milestone insight:
-
Rarity of Current Conditions: The confluence of factors supporting gold prices reaching all-time highs has few historical precedents, with the 1970s being the closest parallel.
-
Paradigm Shifts: Major wealth creation periods often coincide with paradigm shifts in monetary systems, which many analysts believe is currently underway.
-
Duration Implications: Previous precious metals super cycles have lasted 8-12 years, suggesting the current move may still be in its early to middle stages if historical patterns repeat.
-
Wealth Preservation Context: Beyond price appreciation potential, gold's enduring role as a store of value takes on heightened importance during periods of currency devaluation and financial system stress.
This historical context suggests that the current gold market may represent not just a trading opportunity but a generational wealth creation and preservation vehicle.
Positioning Strategies for the Remainder of 2025 and Beyond
As investors navigate this extraordinary market environment:
-
Key Indicators to Monitor: Real interest rates, central bank policy statements, inflation data, and currency strength metrics provide valuable signals for timing allocation adjustments.
-
Risk Management Imperatives: Position sizing appropriate to individual risk tolerance and maintaining some dry powder for potential corrections remains prudent even in strong bull markets.
-
Diversification Within the Sector: Balancing physical metals, ETFs, mining majors, and junior explorers provides exposure to different aspects of the precious metals complex.
-
Long-Term Perspective: Understanding that even powerful bull markets experience periodic corrections helps investors maintain conviction during inevitable periods of volatility.
For those with the foresight to recognize the significance of current market conditions, the remainder of 2025 and beyond may provide extraordinary opportunities in the precious metals sector as this historic bull market continues to unfold.
Ready to Spot the Next Major Gold Discovery?
Don't miss out on the next big mineral discovery that could deliver exceptional returns like this gold rally. Visit Discovery Alert's discoveries page to see how their proprietary Discovery IQ model instantly notifies investors of significant ASX mineral discoveries, giving you the market edge before prices surge.