What's Driving the Current Silver Price Rally?
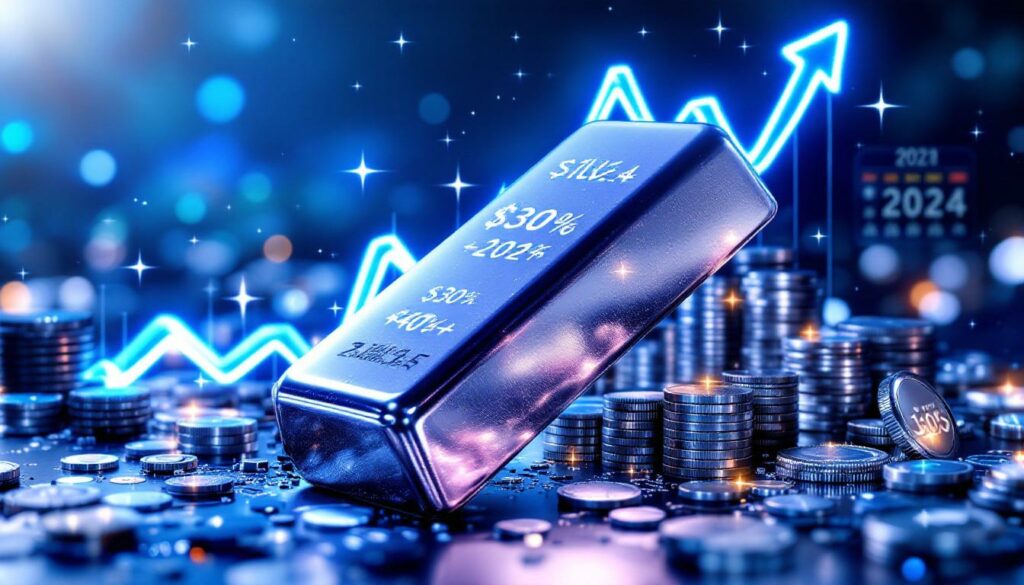
The silver market has been on a remarkable upward trajectory in 2024, with prices demonstrating exceptional momentum that has caught the attention of investors worldwide. Silver has gained over 30% since the beginning of 2024, significantly outperforming gold and many other commodities in percentage terms.
June 2024 proved particularly dramatic for silver prices, with a stunning 10% price jump that pushed the metal above $39 per ounce—marking the first time silver has traded at these levels since 2011. This milestone represents more than just a psychological threshold; it signals renewed investor confidence in silver's potential for sustained growth.
Strong Market Performance Indicators
The current rally is built on solid fundamentals rather than speculative fervor. Trading volumes have been consistently high during price advances, indicating broad-based participation from both institutional and retail investors. Moreover, silver has maintained price levels above key moving averages throughout 2024, suggesting the uptrend has technical support to continue.
"The persistence of silver's price action above the 200-day moving average since January 2024 provides a strong technical foundation for further gains," notes market analyst Devon Morgan from Mining.com.
What makes this rally particularly compelling is silver's ability to maintain momentum even during periods when other assets have faltered, demonstrating its emerging status as both an industrial metal and monetary asset.
Supply-Demand Fundamentals Creating Pressure
The silver market has experienced consecutive annual supply deficits, with 2023 marking the third straight year of shortfall. Industry experts estimate the 2023 deficit exceeded 140 million ounces—a figure that continues to exert upward pressure on prices as above-ground inventories steadily decline.
This fundamental imbalance is exacerbated by strategic decisions from major producers, many of whom are deliberately withholding inventory in anticipation of higher prices. As one industry insider candidly stated, "Why sell today what will be worth substantially more tomorrow?"
The supply constraints aren't likely to ease soon due to several structural factors:
- Limited primary production growth: New silver mines require 5-7 years from discovery to production
- Declining ore grades: Average silver content in mines has fallen approximately 25% in the past decade
- Production concentration: Nearly 60% of silver comes as a byproduct of other mining operations
- Geopolitical constraints: Major producing regions facing increasing regulatory and political challenges
On the demand side, industrial applications continue to expand at a pace that outstrips production increases. Solar panel manufacturing alone consumed over 140 million ounces in 2023, with forecast growth of 15% annually through 2025 as renewable energy initiatives accelerate globally.
Important note: While industrial demand provides a solid floor for silver prices, investors should recognize that technological innovations could eventually reduce silver intensity in some applications.
What Are Major Banks Forecasting for Silver Prices?
The analyst community has been revising silver price targets upward throughout 2024, with several major financial institutions publishing increasingly bullish outlooks as supply-demand fundamentals continue to strengthen.
Citigroup's Bullish Silver Outlook
Citigroup has emerged as one of the more bullish voices on silver, recently raising its 3-month forecast from $38 to $40 per ounce. More impressively, the bank has established a 12-month target price of $43 per ounce, representing approximately 10% upside from current levels.
The bank's analysis cites several compelling factors supporting their revised outlook:
- Persistent back-to-back annual supply deficits creating market tightness
- Major producers strategically withholding stockpiles in anticipation of higher prices
- Strong buying momentum across both industrial and investment sectors
- Growing industrial applications, particularly in green technology sectors
"Silver remains uniquely positioned as both an industrial metal with growing applications and a monetary metal with safe-haven characteristics," Citigroup noted in their metals outlook report. "This dual nature provides multiple drivers for price appreciation in the current economic environment."
Factors Supporting Higher Price Targets
Beyond Citigroup's assessment, several key macroeconomic factors are contributing to the bullish consensus:
Global trade tensions have intensified throughout 2024, driving safe-haven demand for precious metals as investors seek portfolio protection. Unlike gold, silver benefits from this dynamic while simultaneously enjoying industrial demand growth—effectively receiving "two tailwinds" from the same economic conditions.
The renewable energy sector continues to expand its silver usage, with solar panel manufacturing requiring approximately 100 mg of silver per cell. As global solar capacity is projected to double by 2030, this represents a significant and growing demand source that wasn't present during previous silver market squeeze.
| Silver Demand Source | 2020 (Moz) | 2023 (Moz) | 2025 Forecast (Moz) | Growth Rate |
|---|---|---|---|---|
| Solar Panels | 101 | 140 | 185 | +32% |
| Electronics | 88 | 92 | 98 | +6.5% |
| Investment | 200 | 250 | 290 | +16% |
| Jewelry/Silverware | 170 | 178 | 183 | +2.8% |
Investment demand is showing sustained growth patterns, with ETF inflows accelerating since March 2024. Retail investors have been particularly active, with silver coin and small bar demand reaching record levels in Q2 2024.
The technical price breakout above the critical $30 level has attracted momentum traders and algorithmic buying programs, providing additional fuel for the rally. Many technical analysts note that silver has broken through its 10-year downtrend line, potentially signaling the start of a multi-year bull market.
How Does Silver Compare to Other Metals in the Current Market?
Silver's performance in 2024 has been exceptional even when measured against other metals, establishing it as one of the standout commodities in the current market environment.
Silver vs. Gold Performance Metrics
The traditional relationship between silver and gold has seen a significant shift in 2024, with silver outperforming the yellow metal by a substantial margin. While gold has posted respectable gains of approximately 15% year-to-date, silver's 30%+ performance has captured greater investor attention.
This outperformance has manifested in the gold-to-silver ratio (GSR), a key metric watched by precious metals investors:
- January 2024: GSR approximately 85:1 (85 ounces of silver equaled 1 ounce of gold)
- July 2024: GSR approximately 68:1 (68 ounces of silver equaled 1 ounce of gold)
- Historical average: 60:1 (though has ranged from 15:1 to 125:1 over centuries)
The compression in this ratio indicates stronger silver fundamentals and suggests potential for continued outperformance if historical patterns reassert themselves. During previous precious metals bull markets, the ratio has often compressed to 50:1 or lower, implying significant additional upside for silver relative to gold if gold-silver ratio insights from past markets hold true.
"Silver's dual nature as both an industrial metal and a monetary metal creates distinct advantages during periods of economic uncertainty combined with industrial growth," explains mining sector analyst Devon Morgan. "While gold responds primarily to monetary factors, silver benefits from both monetary concerns and industrial demand."
Silver's greater volatility compared to gold remains a double-edged sword for investors. Historically, silver prices exhibit approximately 1.5x the volatility of gold, meaning both larger gains during bull markets and steeper declines during corrections.
Iron Ore Market Developments
The broader metals complex has shown significant strength in 2024, with iron ore providing another example of robust performance. Iron ore price trends recently surpassed $100 per ton for the first time since May, driven primarily by optimism surrounding China's economic outlook, property sector support measures, and anticipated steel capacity reductions.
Unlike silver, which faces supply constraints, major iron ore producers are accelerating production timelines. Rio Tinto's massive Simandou project in Guinea has announced plans to begin shipping initial exports of up to 1 million tons in November 2024, months ahead of schedule. When fully operational, the project is expected to produce 120 million tons annually, potentially creating downward price pressure in the longer term.
This contrast highlights a key difference between silver and industrial metals like iron ore:
- Silver production: Constrained by limited primary mines, declining ore grades, and long lead times for new projects
- Iron ore production: Dominated by major miners with ability to expand production relatively quickly when prices justify investment
These differing supply dynamics may contribute to silver's ability to sustain price gains over a longer timeframe than iron ore, which faces potential oversupply issues as new production comes online.
What Supply Developments Could Impact Silver Prices?
The supply side of the silver market presents a complex picture with several developing trends that could significantly influence price trajectories through 2025.
Mining Production Outlook
Global silver mine production has struggled to keep pace with demand growth, with total output hovering around 820 million ounces annually since 2020. Several factors contribute to this production plateau:
Geographic concentration represents a significant supply risk. The top three silver-producing countries—Mexico, Peru, and China—account for over 50% of global output. Political developments in these regions can have outsized impacts on the global silver market.
- Mexico (23% of global production): Facing increased environmental regulations and security challenges
- Peru (16%): Political instability affecting investment in new mining projects
- China (13%): Increasingly focused on domestic consumption rather than export
Production costs have risen substantially, with all-in sustaining costs (AISC) at primary silver mines averaging $15-18 per ounce in 2023, up from $10-12 five years earlier. This cost inflation stems from:
- Energy price increases affecting mining operations
- Higher labor costs in major producing regions
- Declining ore grades requiring more material to be processed per ounce
- Stricter environmental regulations requiring additional capital investment
Secondary production from lead and zinc mining contributes approximately 70% of annual silver output, creating an interesting dynamic where silver supply is partially dependent on base metal economics rather than silver prices alone. When lead and zinc prices decline, mines producing these metals may reduce output, inadvertently reducing silver supply as a byproduct.
Strategic Corporate Movements in Mining Sector
Several significant corporate developments across the mining sector could indirectly affect silver supply and market sentiment:
AngloGold Ashanti has announced plans to expand its Nevada gold operations through the acquisition of Augusta Gold for C$152 million. While primarily a gold-focused transaction, the deal includes the Reward and Bullfrog deposits, which contain silver as a byproduct. This consolidation reflects a broader trend of major miners seeking to secure high-quality resources in stable jurisdictions.
Newmont Corporation, the world's largest gold miner, continues its portfolio optimization strategy, recently divesting non-core assets to focus on tier-one properties. The company raised $470 million by selling stakes in Greatland Resources and Discovery Silver, signaling a strategic prioritization of its project pipeline that could affect future silver supply.
Rio Tinto has appointed Simon Trot as its new CEO, effective August 25. Trot, a 20-year company veteran and current head of iron ore, replaces Jakob Stausholm. While Rio Tinto is not a significant silver producer, leadership changes at major mining companies often reflect broader industry trends and can influence capital allocation decisions across the sector.
The ongoing industry consolidation potentially affects silver supply chains through:
- Reduced exploration budgets as companies focus on existing assets
- Project delays as newly merged entities reassess development pipelines
- Increased focus on jurisdictional risk, potentially limiting development in some silver-rich regions
Investment perspective: Mining sector developments suggest a continued environment of disciplined capital allocation rather than aggressive production growth, supporting the thesis that silver supply will remain constrained relative to demand.
What Technical Indicators Support the Silver Price Forecast?
Technical analysis provides additional evidence supporting the bullish case for silver prices through 2025, with several key indicators aligning to suggest continued upward momentum.
Chart Patterns and Price Momentum
Silver's price chart reveals several compelling technical developments that have historically preceded extended rallies:
Breaking through long-term resistance levels has been perhaps the most significant technical milestone. In April 2024, silver decisively broke above the $30 level, which had acted as stubborn resistance since 2013. This breakthrough came with substantial volume, indicating strong conviction among market participants.
The subsequent move above $35 in May and $39 in June established a clear pattern of higher highs and higher lows—the textbook definition of an uptrend. Each new resistance level that falls typically becomes support during subsequent consolidations, creating a "stair-step" pattern characteristic of sustainable bull markets.
Volume analysis during recent price surges reveals increasing participation on up days and decreasing volume during consolidations—a healthy pattern suggesting accumulation rather than distribution. The volume profile since January 2024 shows approximately 40% higher average daily volume compared to 2023, indicating growing market interest.
Moving average convergence/divergence (MACD) signals remain in bullish territory on weekly charts, with no sign of negative divergence despite the substantial price appreciation already realized. The MACD histogram continues to expand, suggesting momentum remains strong rather than waning.
Relative strength indicators compared to historical rallies show the current move is less overextended than previous silver bull markets at similar stages. During the 2010-2011 silver rally, the weekly RSI reached above 85 before a significant correction, while the current rally has maintained RSI levels between 65-75, suggesting room for continued upside before becoming technically overbought.
Seasonal Patterns and Historical Comparisons
Silver's price action often follows seasonal patterns that can provide insight into potential future movements:
Typical seasonal performance shows silver tends to perform strongest from January through May, with a secondary strength period from July through September. The current rally has followed this pattern closely, suggesting seasonal tailwinds may continue to support prices through Q3 2024.
A comparison to previous bull markets in 2011 and earlier reveals interesting parallels:
| Bull Market Period | Duration | Price Increase | End Catalyst |
|---|---|---|---|
| 2003-2008 | 5 years | 320% | Financial crisis |
| 2008-2011 | 2.5 years | 450% | Margin requirement changes |
| 2020-2023 | 3 years | 150% | Interest rate hikes |
| 2023-Present | Ongoing | 85% (so far) | ? |
Based on historical patterns, silver bull markets typically last 3-5 years and deliver 150-450% returns before exhaustion. By these metrics, the current rally may be in its middle stages rather than approaching a climax.
Price velocity measurements against historical rallies show the current move has been more measured than previous silver bull markets. The 2010-2011 rally saw silver prices double in just seven months before correcting sharply, while the current rally has taken approximately 18 months to achieve similar percentage gains—suggesting a more sustainable pace less prone to sudden reversals.
Potential resistance levels based on previous market behavior include:
- $44-45: Previous high from April 2011
- $49-50: All-time nominal high from January 1980 and April 2011
- $60: Psychological round number with no historical precedent
Technical perspective: While short-term corrections should be expected given the magnitude of gains already achieved, the overall technical picture supports continued upward momentum through 2025, with potential targets in the $44-50 range representing previous all-time highs.
How Might Investors Position for the Silver Price Forecast?
With silver showing strong fundamentals and technical indicators supporting higher prices, investors face important decisions about how to gain exposure to this potential opportunity while managing associated risks.
Investment Vehicle Comparison
Investors have several options for gaining silver exposure, each with distinct advantages and considerations:
Physical silver remains the most direct form of ownership, completely removing counterparty risk. However, practical considerations include:
- Storage costs: Professional vault storage typically costs 0.5-0.7% annually
- Liquidity challenges: Physical silver is bulkier than gold (requiring roughly 80x more storage space per dollar value)
- Premium considerations: Silver coins and small bars often carry premiums of 15-30% above spot prices
- Tax implications: In some jurisdictions, physical silver is subject to sales tax, unlike many paper investments
Silver ETFs offer convenient exchange-traded exposure without storage concerns. The largest silver ETF, the iShares Silver Trust (SLV), holds physical silver in allocated vaults and closely tracks the spot price. Benefits include:
- High liquidity with tight bid-ask spreads
- No need for secure storage arrangements
- Ease of buying/selling through standard brokerage accounts
- Relatively low expense ratios (typically 0.5-0.6% annually)
However, ETFs introduce counterparty risk and don't provide the same inflation protection benefits as direct ownership during extreme economic scenarios. For those interested in understanding more about the dynamics of these markets, the latest analysis of silver market tariffs provides valuable context.
Mining stocks provide leveraged exposure to silver prices
Ready to Catch the Next Major Silver Price Move?
Discover investment opportunities in real-time as they unfold in the silver market and beyond with Discovery Alert's proprietary Discovery IQ model, which transforms complex mineral data into actionable insights for traders. Visit the Discovery Alert discoveries page today to understand how major mineral discoveries have historically generated substantial returns for early investors.